
Key Takeaways
- PwC audits more US broker-dealers than any other firm, 148, according to their Form X-17A-5 annual reports filed with the SEC.
- The four largest audit firms audit 18% of broker-dealers but firms holding 95% of broker-dealer assets, according to SEC filings.
- 427 audit firms sign at least one broker-dealer's annual report; 239 of them audit only one.
- PwC audits the broker-dealers with the most assets, $3.33 trillion.
PwC audits more US broker-dealers than any other accounting firm, 148, according to the annual reports broker-dealers file with the SEC on Form X-17A-5, followed by Sanville & Company and EY. The four largest audit firms audit 18% of broker-dealers, and the broker-dealers they audit hold 95% of the assets in the reports whose figures could be checked.
Every registered broker-dealer files an annual report examined by an independent public accountant under PCAOB standards, and 17 CFR 240.17a-5 requires that accountant to be registered with the PCAOB where the Sarbanes-Oxley Act requires it. The report's cover names the firm. Most broker-dealers are small, and 427 audit firms sign at least one report; 239 of them sign only one.
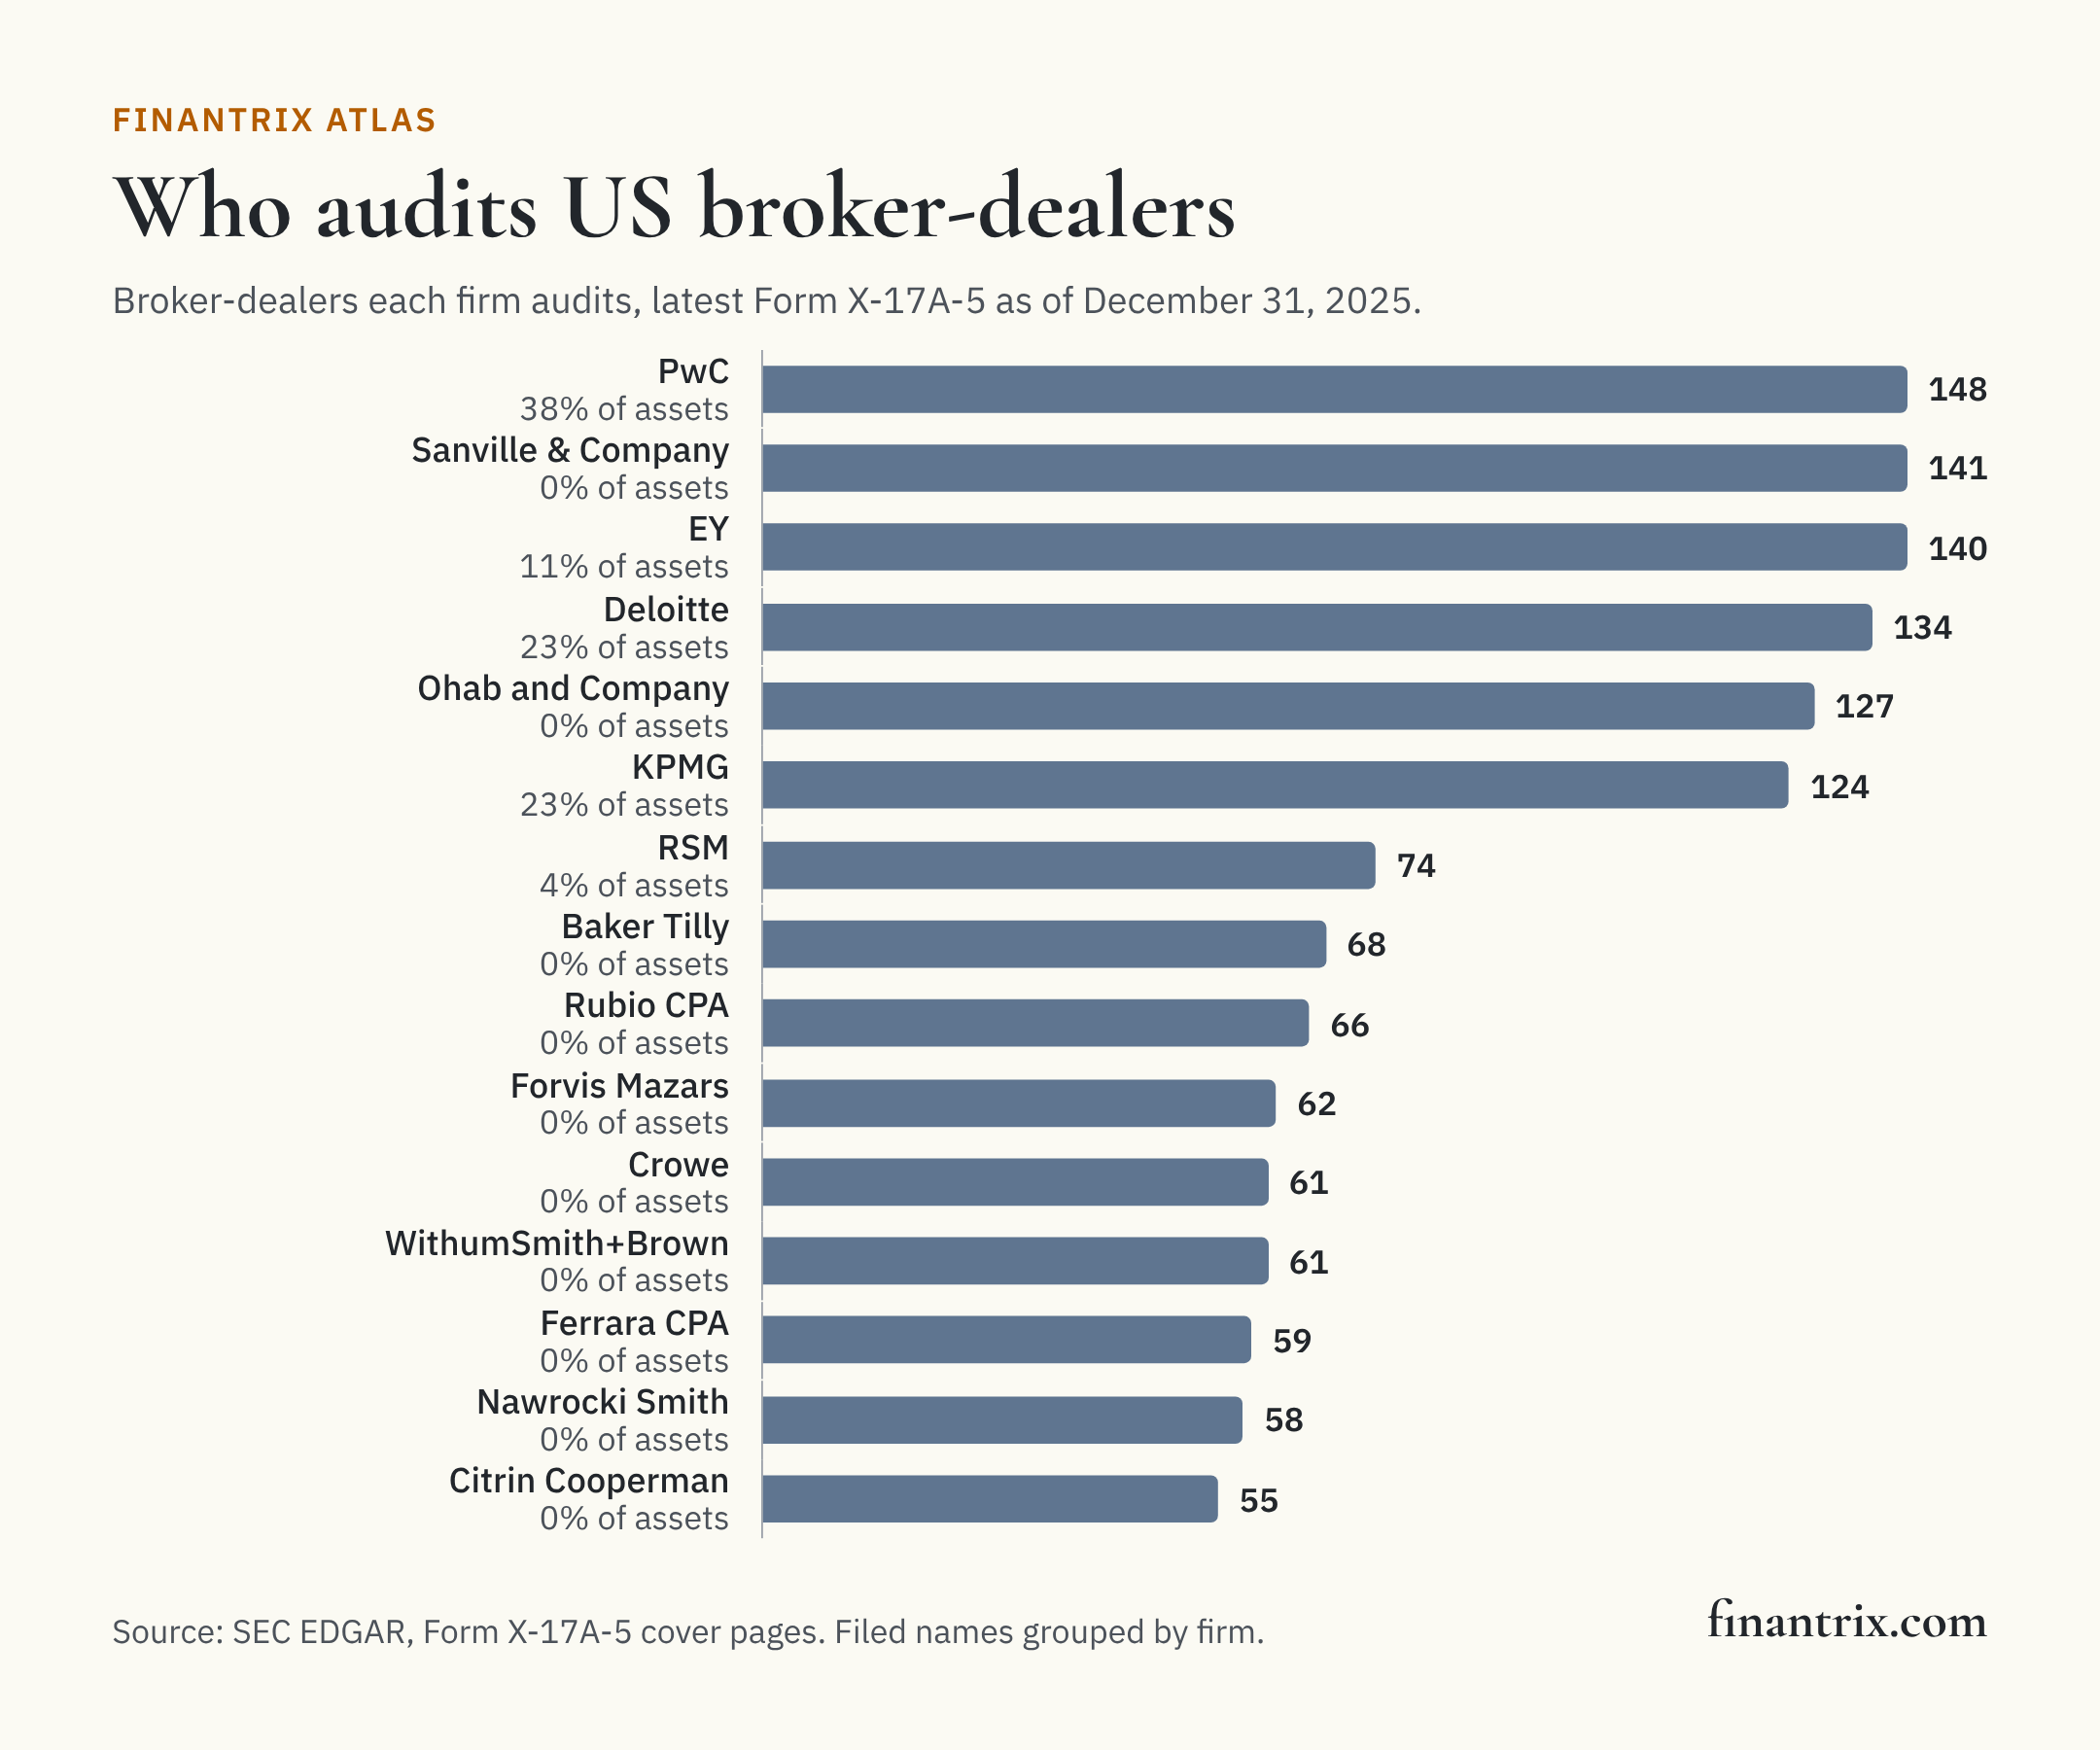
The 25 firms that audit the most broker-dealers
Ranked by the number of registered broker-dealers whose latest Form X-17A-5 names each firm as auditor, as of December 31, 2025. Entities and spellings of one firm are grouped. Assets are the total assets on the audited statements, counted only where the statement balances; the largest broker-dealer each firm audits is shown beside it.
| Rank | Audit firm | Broker-dealers audited | Share of broker-dealers | Total assets of those audited | Share of assets | Largest broker-dealer it audits |
|---|---|---|---|---|---|---|
| 1 | PwC | 148 | 4.8% | $3.33 trillion | 38.4% | J.P. Morgan Securities LLC |
| 2 | Sanville & Company | 141 | 4.6% | $403 million | 0.0% | WR Securities, LLC |
| 3 | EY | 140 | 4.6% | $923 billion | 10.6% | Nomura Securities International, Inc. |
| 4 | Deloitte | 134 | 4.4% | $1.98 trillion | 22.9% | Morgan Stanley & Co. International plc |
| 5 | Ohab and Company | 127 | 4.1% | $85 million | 0.0% | Capitol Securities Management, Inc. |
| 6 | KPMG | 124 | 4.1% | $1.99 trillion | 23.0% | Citigroup Global Markets Ltd |
| 7 | RSM | 74 | 2.4% | $314 billion | 3.6% | Wolverine Trading, LLC |
| 8 | Baker Tilly | 68 | 2.2% | $2.8 billion | 0.0% | MBX Clearing LLC |
| 9 | Rubio CPA | 66 | 2.2% | $372 million | 0.0% | Register Financial Associates, Inc. |
| 10 | Forvis Mazars | 62 | 2.0% | $11.3 billion | 0.1% | Tradeup Securities, Inc. |
| 11 | Crowe | 61 | 2.0% | $3.4 billion | 0.0% | D.A. Davidson & Co. |
| 12 | WithumSmith+Brown | 61 | 2.0% | $2.5 billion | 0.0% | HEG Securities, LLC |
| 13 | Ferrara CPA | 59 | 1.9% | $79 million | 0.0% | Adelphi Stock Brokers Inc. |
| 14 | Nawrocki Smith | 58 | 1.9% | $355 million | 0.0% | Northland Securities, Inc. |
| 15 | Citrin Cooperman | 55 | 1.8% | $1.6 billion | 0.0% | Beech Hill Securities, Inc. |
| 16 | DCPA | 55 | 1.8% | $152 million | 0.0% | Lifesci Capital, LLC |
| 17 | LMHS | 54 | 1.8% | $96 million | 0.0% | Moors & Cabot, Inc. |
| 18 | Cropper Accountancy | 49 | 1.6% | $135 million | 0.0% | Mischler Financial Group, Inc. |
| 19 | YSL & Associates | 47 | 1.5% | $80 million | 0.0% | Haitong International Securities (USA) Inc. |
| 20 | Ryan & Juraska | 45 | 1.5% | $2.4 billion | 0.0% | Phillip Capital Inc. |
| 21 | Mercurius & Associates | 36 | 1.2% | $17 million | 0.0% | Brant Street Capital Inc. |
| 22 | Cherry Bekaert | 35 | 1.1% | $322 million | 0.0% | First Citizens Investor Services, Inc. |
| 23 | Assurance Dimensions | 35 | 1.1% | $177 million | 0.0% | T3 Trading Group, LLC |
| 24 | Michael Coglianese CPA P C | 34 | 1.1% | $385 million | 0.0% | Erudite Trading LLC |
| 25 | NTT & Company | 33 | 1.1% | $8 million | 0.0% | J.H. Darbie & Co., Inc. |
Download this table (CSV), free. The full dataset, every broker-dealer with its auditor as filed and grouped, its total assets where read and its filing, is one email away.
Firms and assets
The broker-dealers in the reports hold $8.67 trillion in total assets where the statement could be checked, 2,824 of 3,061 reports. PwC audits the most of it, $3.33 trillion, 38%. The large dealers are audited by the large firms, and the thousands of small broker-dealers by smaller ones, so a firm's count and its assets tell different stories.
What this means for technology buyers
A broker-dealer's annual reports include a financial report and a compliance or exemption report, each examined or reviewed by its accountant, and the records behind them come from its books and regulatory reporting systems. These guides compare the options side by side:
- Clearing and settlement platforms: the books and records behind the reserve calculation.
- Regulatory reporting platforms for investment banks: FOCUS reports and net capital.
- Audit management systems: preparing for and tracking an audit.
More from Finantrix Atlas
- The largest US broker-dealers
- Who audits US funds
- Who audits private funds
- Which brokers US funds pay the most commissions
How this was counted
The reports are each registered broker-dealer's latest Form X-17A-5 on EDGAR in the quarterly indexes for 2026Q4, 2026Q3, 2026Q2, 2026Q1, 2025Q4, the same reports as our ranking of the largest US broker-dealers. The auditor is the accountant named in the report's structured cover data. Total assets come from the statement of financial condition, taken only where total assets equal total liabilities and equity on the same statement.
Limits
- Counts of broker-dealers. A firm that audits one large dealer counts once; assets are shown so the difference is visible.
- Assets read where they balance. 2,824 of 3,061 reports have checked figures; the rest count for the firm count only.
- Grouping is a judgment. The filed names under each firm are in the free table.
- Latest reports. Each broker-dealer's fiscal year differs; the data is as of December 31, 2025.
Cite this
Free to quote, cite and republish, including the chart, with credit to Finantrix Atlas and a link to this page.
PwC audits 148 US broker-dealers, the most of any accounting firm, according to a Finantrix Atlas analysis of SEC Form X-17A-5 filings.
Suggested citation: Finantrix Atlas, "Who Audits US Broker-Dealers?", reports as of December 31, 2025, from SEC Form X-17A-5 filings. https://www.finantrix.com/articles/broker-dealer-auditors
Embed the chart:
<a href="https://www.finantrix.com/articles/broker-dealer-auditors"><img src="https://www.finantrix.com/atlas/broker-dealer-auditors.png?v=2025-12-31" alt="Who audits US broker-dealers, from Finantrix Atlas"></a>
<p>Chart: <a href="https://www.finantrix.com/articles/broker-dealer-auditors">Finantrix Atlas</a>, from SEC Form X-17A-5 data.</p>
Frequently asked questions
Q: Which firm audits the most broker-dealers? A: PwC, named on the latest Form X-17A-5 of 148 US broker-dealers, according to SEC filings.
Q: Do the Big Four audit most broker-dealers? A: No by count, yes by assets: they audit 18% of broker-dealers, and those broker-dealers hold 95% of the assets read.
Download the data
Two CSV files, free: the 25 rows on this page, and the full dataset of all 3,061 rows, as of December 31, 2025.
Frequently Asked Questions
Which firm audits the most broker-dealers?
PwC, named on the latest Form X-17A-5 of 148 US broker-dealers, according to SEC filings.
Do the Big Four audit most broker-dealers?
No by count, yes by assets: they audit 18% of broker-dealers, and those broker-dealers hold 95% of the assets read.