
Key Takeaways
- KKR added the most private equity fund assets over the year to October 31, 2026, $98.2 billion, and Andreessen Horowitz the most venture capital fund assets, $36.2 billion, according to Form ADV filings.
- Among the managers that can be compared, private equity fund assets rose 15% and venture capital fund assets 24%, according to SEC data.
- Each manager's latest filing is compared with its own filing a year earlier, fund by fund, so a fund that moved between two advisers of one firm is not counted as new.
- Gross assets include uncalled commitments and, for hedge funds, borrowing, so a rise can mean money raised, money borrowed or higher valuations.
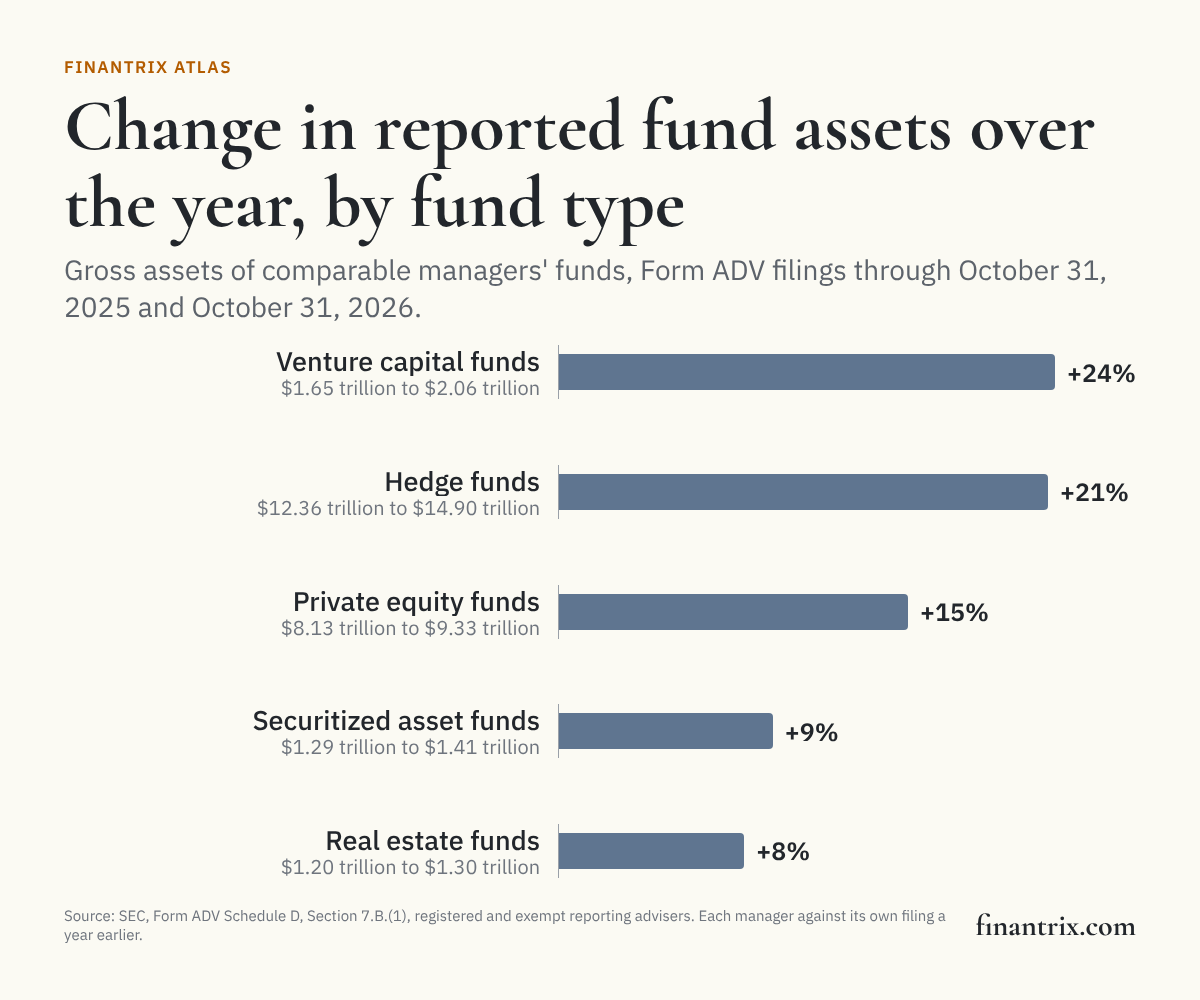
KKR added the most private equity fund assets over the year to October 31, 2026, $98.2 billion, and Andreessen Horowitz the most venture capital fund assets, $36.2 billion, according to Form ADV filings. Among the managers that can be compared, private equity fund assets rose 15%, venture capital 24%, hedge funds 21%, securitized asset funds 9% and real estate 8%, according to SEC data.
Every adviser files a list of its private funds with the SEC on Schedule D of Form ADV, with each fund's type and gross assets. This page compares each manager's latest filing up to October 31, 2026 with its own latest filing up to October 31, 2025, fund by fund, and ranks the managers in each fund type by how much those gross assets changed. Registered and exempt reporting advisers are both included, and each fund type is ranked the way its own ranking groups firms, so a manager reads the same here as on that page.
What a change in gross assets measures
A rise in gross assets is not the same as money raised. Form ADV asks for each private fund's gross assets on the basis used for regulatory assets under management: the fair value of what the fund holds, without deducting its debt, plus any uncalled capital commitments, according to the SEC's instructions. So the change over a year combines three things the filing cannot separate:
- Money committed. A fund raised during the year counts at its full commitments, before its capital is called.
- Valuations. A portfolio worth more at the second filing reports more, with no new money at all.
- Borrowing. A fund that finances more of its positions reports larger gross assets. That matters most for hedge funds, whose gross assets can be far larger than their investors' capital.
Each table splits the change into the funds a manager reported at both dates and the funds that are new to its filings. A fund new to the filings may have been launched in the year or taken over from another manager: of the funds new to the ten private equity leaders' filings, 5 of 357 were on another manager's filing a year earlier, according to SEC data.
Private equity
Ranked by the change in gross assets of private equity funds, from each manager's filing a year earlier to its latest. The private equity funds of the comparable managers grew from $8.13 trillion to $9.33 trillion, according to SEC data.
| Rank | Manager | A year earlier | Now | Change | Change (%) | Funds new to its filings | Funds no longer reported | Source |
|---|---|---|---|---|---|---|---|---|
| 1 | KKR (3 advisers) | $282 billion | $380 billion | +$98.2 billion | +35% | 83 ($53.8 billion) | 31 | SEC |
| 2 | Goldman Sachs | $46.4 billion | $124 billion | +$77.7 billion | +167% | 110 ($74.8 billion) | none | SEC |
| 3 | MGX | $2.4 billion | $39.1 billion | +$36.6 billion | +1511% | none | 2 | SEC |
| 4 | Valor Management | $25.6 billion | $57.2 billion | +$31.6 billion | +124% | 10 ($8.2 billion) | 3 | SEC |
| 5 | Thoma Bravo | $146 billion | $177 billion | +$30.9 billion | +21% | 20 ($37.0 billion) | 2 | SEC |
| 6 | Blackstone (17 advisers) | $262 billion | $290 billion | +$27.4 billion | +10% | 47 ($25.3 billion) | 7 | SEC |
| 7 | Bain Capital (5 advisers) | $76.1 billion | $102 billion | +$26.0 billion | +34% | 12 ($23.0 billion) | 2 | SEC |
| 8 | Brookfield (3 advisers) | $159 billion | $183 billion | +$24.1 billion | +15% | 43 ($7.7 billion) | 11 | SEC |
| 9 | TPG (2 advisers) | $122 billion | $146 billion | +$23.8 billion | +19% | 22 ($17.7 billion) | 13 | SEC |
| 10 | EQT (2 advisers) | $91.5 billion | $112 billion | +$20.2 billion | +22% | 10 ($2.5 billion) | 1 | SEC |
Venture capital
Ranked by the change in gross assets of venture capital funds, as Form ADV defines them. The comparable managers' venture capital funds grew from $1.65 trillion to $2.06 trillion, according to SEC data.
| Rank | Manager | A year earlier | Now | Change | Change (%) | Funds new to its filings | Funds no longer reported | Source |
|---|---|---|---|---|---|---|---|---|
| 1 | Andreessen Horowitz | $56.4 billion | $92.5 billion | +$36.2 billion | +64% | 14 ($13.3 billion) | none | SEC |
| 2 | Founders Fund | $27.7 billion | $58.9 billion | +$31.2 billion | +113% | 9 ($12.0 billion) | none | SEC |
| 3 | Thrive Capital Management | $22.8 billion | $49.2 billion | +$26.4 billion | +116% | 13 ($13.4 billion) | none | SEC |
| 4 | Lightspeed | $31.2 billion | $50.0 billion | +$18.8 billion | +60% | 8 ($3.1 billion) | none | SEC |
| 5 | Sequoia Capital (2 advisers) | $38.4 billion | $52.3 billion | +$13.9 billion | +36% | 1 ($81 million) | 3 | SEC |
| 6 | General Catalyst | $31.8 billion | $42.5 billion | +$10.7 billion | +34% | 5 ($1.7 billion) | none | SEC |
| 7 | Accel (3 advisers) | $38.9 billion | $46.8 billion | +$8.0 billion | +20% | 3 ($4.2 billion) | none | SEC |
| 8 | DFJ Growth Management | $8.4 billion | $16.3 billion | +$7.9 billion | +94% | 2 ($64 million) | none | SEC |
| 9 | Khosla Ventures | $14.2 billion | $21.7 billion | +$7.5 billion | +53% | 5 ($5.0 billion) | none | SEC |
| 10 | NEA | $27.1 billion | $34.6 billion | +$7.4 billion | +27% | 7 ($628 million) | 1 | SEC |
Real estate
Ranked by the change in gross assets of real estate funds. The comparable managers' real estate funds grew from $1.20 trillion to $1.30 trillion, according to SEC data. A manager whose table entry shows nothing a year earlier filed no real estate funds then.
| Rank | Manager | A year earlier | Now | Change | Change (%) | Funds new to its filings | Funds no longer reported | Source |
|---|---|---|---|---|---|---|---|---|
| 1 | Affinius Capital | $14.9 billion | $24.6 billion | +$9.6 billion | +65% | 59 ($9.5 billion) | 1 | SEC |
| 2 | Goldman Sachs | none | $8.0 billion | +$8.0 billion | new | 40 ($8.0 billion) | none | SEC |
| 3 | BGO (2 advisers) | $11.7 billion | $19.5 billion | +$7.8 billion | +67% | 43 ($2.5 billion) | none | SEC |
| 4 | LaSalle Investment Management (3 advisers) | $5.7 billion | $12.7 billion | +$7.0 billion | +122% | 1 ($230 million) | none | SEC |
| 5 | Greystar | $16.8 billion | $23.5 billion | +$6.7 billion | +40% | 10 ($3.0 billion) | 1 | SEC |
| 6 | EQT (3 advisers) | $26.8 billion | $32.8 billion | +$6.0 billion | +22% | 3 ($1.3 billion) | none | SEC |
| 7 | Columbia Capital | none | $4.7 billion | +$4.7 billion | new | 4 ($4.7 billion) | none | SEC |
| 8 | PCCP | $7.9 billion | $11.6 billion | +$3.7 billion | +47% | 15 ($3.9 billion) | none | SEC |
| 9 | Starwood Capital | $37.4 billion | $41.1 billion | +$3.7 billion | +10% | 6 ($518 million) | 5 | SEC |
| 10 | Aermont Capital (2 advisers) | $14.5 billion | $17.8 billion | +$3.3 billion | +23% | none | none | SEC |
Hedge funds
Ranked by the change in gross assets of hedge funds, which count borrowing, so a change can reflect more financing as much as more investor money. The comparable managers' hedge funds grew from $12.36 trillion to $14.90 trillion, according to SEC data.
| Rank | Manager | A year earlier | Now | Change | Change (%) | Funds new to its filings | Funds no longer reported | Source |
|---|---|---|---|---|---|---|---|---|
| 1 | Qube Research & Technologies | $426 billion | $580 billion | +$155 billion | +36% | 3 ($224 million) | none | SEC |
| 2 | Millennium Management | $567 billion | $713 billion | +$146 billion | +26% | 3 ($3.7 billion) | none | SEC |
| 3 | LMR Partners (2 advisers) | $231 billion | $374 billion | +$143 billion | +62% | 1 ($34 million) | 1 | SEC |
| 4 | Two Sigma | $123 billion | $259 billion | +$136 billion | +110% | 15 ($90.8 billion) | 3 | SEC |
| 5 | Citadel | $437 billion | $563 billion | +$126 billion | +29% | 2 ($9.2 billion) | none | SEC |
| 6 | OQ Funds Management | $7.9 billion | $130 billion | +$122 billion | +1540% | 1 ($130 billion) | 1 | SEC |
| 7 | Garda Capital Partners | $107 billion | $207 billion | +$100 billion | +94% | none | none | SEC |
| 8 | Symmetry Investments | $297 billion | $395 billion | +$98.1 billion | +33% | none | none | SEC |
| 9 | Capula Investment Management | $450 billion | $546 billion | +$96.0 billion | +21% | 1 ($2 million) | none | SEC |
| 10 | Taula Capital Management (Jersey) | $74.9 billion | $161 billion | +$86.5 billion | +116% | 1 ($12 million) | none | SEC |
Securitized asset funds
Ranked by the change in gross assets of securitized asset funds, most of them collateralized loan obligations, each a separate fund. Most of the change for the managers below comes from funds new to their filings: a manager that issues a CLO reports it as a new fund. The comparable managers' securitized asset funds grew from $1.29 trillion to $1.41 trillion, according to SEC data.
| Rank | Manager | A year earlier | Now | Change | Change (%) | Funds new to its filings | Funds no longer reported | Source |
|---|---|---|---|---|---|---|---|---|
| 1 | Arini | $1.8 billion | $9.2 billion | +$7.5 billion | +423% | 15 ($7.2 billion) | none | SEC |
| 2 | Redding Ridge (2 advisers) | $38.4 billion | $45.3 billion | +$6.9 billion | +18% | 23 ($8.9 billion) | 5 | SEC |
| 3 | AGL Credit Management | $16.9 billion | $23.5 billion | +$6.6 billion | +39% | 9 ($5.0 billion) | none | SEC |
| 4 | HPS Investment Partners | $10.6 billion | $17.0 billion | +$6.5 billion | +61% | 16 ($7.3 billion) | 3 | SEC |
| 5 | Onex | $20.5 billion | $26.7 billion | +$6.2 billion | +30% | 12 ($6.1 billion) | 2 | SEC |
| 6 | GC Opal Advisors | $36.1 billion | $41.9 billion | +$5.9 billion | +16% | 21 ($8.9 billion) | 11 | SEC |
| 7 | CVC (2 advisers) | $25.7 billion | $31.3 billion | +$5.6 billion | +22% | 14 ($5.8 billion) | none | SEC |
| 8 | Blackstone (5 advisers) | $46.4 billion | $51.7 billion | +$5.2 billion | +11% | 22 ($11.0 billion) | 5 | SEC |
| 9 | Silver Point Capital | $3.9 billion | $9.2 billion | +$5.2 billion | +133% | 9 ($4.6 billion) | none | SEC |
| 10 | Barings (2 advisers) | $21.8 billion | $25.4 billion | +$3.6 billion | +16% | 10 ($4.8 billion) | 8 | SEC |
Download these tables (CSV), free. The full dataset, every manager in each fund type with both years' gross assets, the change in its continuing funds and its new and closed funds, is one email away.
What this means for technology buyers
A firm that grows by launching funds takes on each new vehicle's investor onboarding, capital calls and reporting at once, before the assets arrive. These guides compare the systems involved:
- Subscription and capital call management: onboarding investors and calling capital fund by fund.
- Investor relations and reporting platforms: what investors in each new fund receive.
- NAV calculation and waterfall distribution: carried interest and distributions for private equity and venture funds.
Mapping the firm before choosing systems? The Private Equity Value Stream Catalog shows how a private equity firm's work runs, stage by stage, from fundraising to exit.
More from Finantrix Atlas
- Largest private equity firms by fund assets
- Largest venture capital firms by fund assets
- Top hedge fund managers by hedge fund assets
- Largest real estate fund managers
- Largest CLO and securitized asset fund managers
How this was counted
The universe is every adviser on the SEC's lists of registered and exempt reporting advisers for November 2, 2026 that reports private funds on Schedule D, Section 7.B.(1) of Form ADV: 11,920 advisers. For 11,915 of them, the count of private funds and their gross assets in this data match the SEC's own lists to within 1%, according to SEC data. Each adviser's latest filing up to October 31, 2026 is compared with its own latest filing up to October 31, 2025, read from the SEC's filing data in the same pass; 10,685 of the advisers had a filing by the earlier date, and the other 1,235 are new to the data.
A manager is compared only when it filed again during the year with figures that changed. Advisers update the private fund section in their annual amendment, and a later amendment in the year usually repeats those figures, so the filing dates need not be twelve months apart. Measured on this data, in every fund type the median change in a continuing fund's gross assets differs by no more than one percentage point between filings about a year apart and filings further apart or closer together. Managers left out:
- New to the data: no filing by October 31, 2025. Private equity 413, venture capital 335, real estate 42, hedge funds 221, securitized asset funds 4.
- Figures not updated: three or more continuing funds reporting exactly the gross assets they reported a year earlier. Private equity 81, venture capital 139, real estate 21, hedge funds 13, securitized asset funds 4.
- The same filing at both dates: 73 advisers had not filed since the earlier date.
Funds are matched by the identification number Form ADV gives each private fund, within each manager, so a fund that moved between two advisers of the same firm counts as continuing. A fund filed under a different fund type a year earlier, or that became or stopped being a feeder fund or a fund of funds, is left out of both years rather than counted as a gain in one type and a loss in another: private equity 689, venture capital 1,170, real estate 119, hedge funds 419, securitized asset funds 19. Feeder funds and funds of funds are left out so that no money is counted twice, funds reporting no gross assets are left out, and a fund reported by two managers counts once in each total.
Limits
- Today's managers, not last year's market. The SEC has not kept its monthly adviser lists for the earlier date on sec.gov, so that date cannot be reconciled the way the current one is. The comparison covers managers on the SEC's lists today, and the totals above are those managers' funds at both dates, not the whole market as it stood a year ago.
- As of each manager's filings. Figures are as the adviser reported them on each filing, which can be months older than the cutoff dates above.
- A new fund may not be new money. A fund new to a manager's filings may be a launch, a fund taken over from another manager, or a fund the manager advised before but had not reported.
- Grouping is by name. A manager whose advisers file under unrelated names appears once per adviser.
Cite this
Free to quote, cite and republish, including the chart, with credit to Finantrix Atlas and a link to this page.
KKR added the most private equity fund assets over the year to October 31, 2026, $98.2 billion, according to a Finantrix Atlas analysis of SEC Form ADV filings.
Private equity fund assets at the managers that can be compared rose 15% over the year to October 31, 2026, according to a Finantrix Atlas analysis of SEC Form ADV data.
Suggested citation: Finantrix Atlas, "Fastest-Growing Private Fund Managers by Fund Type," filings through October 31, 2026, from SEC Form ADV Schedule D. https://www.finantrix.com/articles/fastest-growing-private-fund-managers
Embed the chart:
<a href="https://www.finantrix.com/articles/fastest-growing-private-fund-managers"><img src="https://www.finantrix.com/atlas/fastest-growing-private-fund-managers.png" alt="Change in private fund assets by fund type, from Finantrix Atlas"></a>
<p>Chart: <a href="https://www.finantrix.com/articles/fastest-growing-private-fund-managers">Finantrix Atlas</a>, from SEC Form ADV data.</p>
Frequently asked questions
Q: Which private equity firm grew the most? A: By the change in the private equity fund assets its advisers report to the SEC, KKR, which added $98.2 billion over the year to October 31, 2026, followed by Goldman Sachs and MGX, according to Form ADV filings.
Q: Which venture capital firm grew the most? A: Andreessen Horowitz, whose venture capital fund assets rose $36.2 billion over the year to October 31, 2026, followed by Founders Fund and Thrive Capital Management, according to Form ADV filings.
Q: Does a rise in gross assets mean a firm raised that much money? A: No. Form ADV's gross assets include uncalled commitments and are reported before borrowing is subtracted, so a rise combines money committed to new funds, higher valuations and, for hedge funds especially, more financing.
Q: How is the change measured? A: Each manager's latest Form ADV filing up to October 31, 2026 is compared with its own latest filing up to October 31, 2025, fund by fund. Managers that did not file again with updated figures are left out, and so is any fund whose type changed between the two filings.
Download the data
Two CSV files, free: the 50 rows on this page, and the full dataset of all 11,385 rows, as of October 31, 2026.
Frequently Asked Questions
Which private equity firm grew the most?
By the change in the private equity fund assets its advisers report to the SEC, KKR, which added $98.2 billion over the year to October 31, 2026, followed by Goldman Sachs and MGX, according to Form ADV filings.
Which venture capital firm grew the most?
Andreessen Horowitz, whose venture capital fund assets rose $36.2 billion over the year to October 31, 2026, followed by Founders Fund and Thrive Capital Management, according to Form ADV filings.
Does a rise in gross assets mean a firm raised that much money?
No. Form ADV's gross assets include uncalled commitments and are reported before borrowing is subtracted, so a rise combines money committed to new funds, higher valuations and, for hedge funds especially, more financing.
How is the change measured?
Each manager's latest Form ADV filing up to October 31, 2026 is compared with its own latest filing up to October 31, 2025, fund by fund. Managers that did not file again with updated figures are left out, and so is any fund whose type changed between the two filings.