
Key Takeaways
- US lenders made 953,349 cash-out refinances in 2025, up 24% from 2024, according to HMDA data: 48% of all refinances.
- California had the most cash-out refinances, 104,368, followed by Florida and Texas, according to HMDA data.
- Cash-out loans were more than half of refinances in 16 states in 2025; the share was highest in Idaho, 57.9%, and lowest in Mississippi, 32.5%.
- Rocket Mortgage made the most cash-out refinances in every state but one, Idaho, where Idaho Central Credit Union did, according to HMDA filings.
US lenders made 953,349 cash-out refinances in 2025, up 24% from 2024, according to HMDA data, and they were 48% of all 1,995,427 mortgage refinances. California had the most, 104,368, followed by Florida and Texas; the five states with the most made 33% of the national total.
A cash-out refinance replaces a mortgage with a larger one and pays the borrower the difference, so it is one of the ways homeowners borrow against their equity. HMDA records it as its own loan purpose, as the lender classified the loan. Cash-out loans were more than half of refinances in 16 states, and the share ran from 57.9% in Idaho to 32.5% in Mississippi.
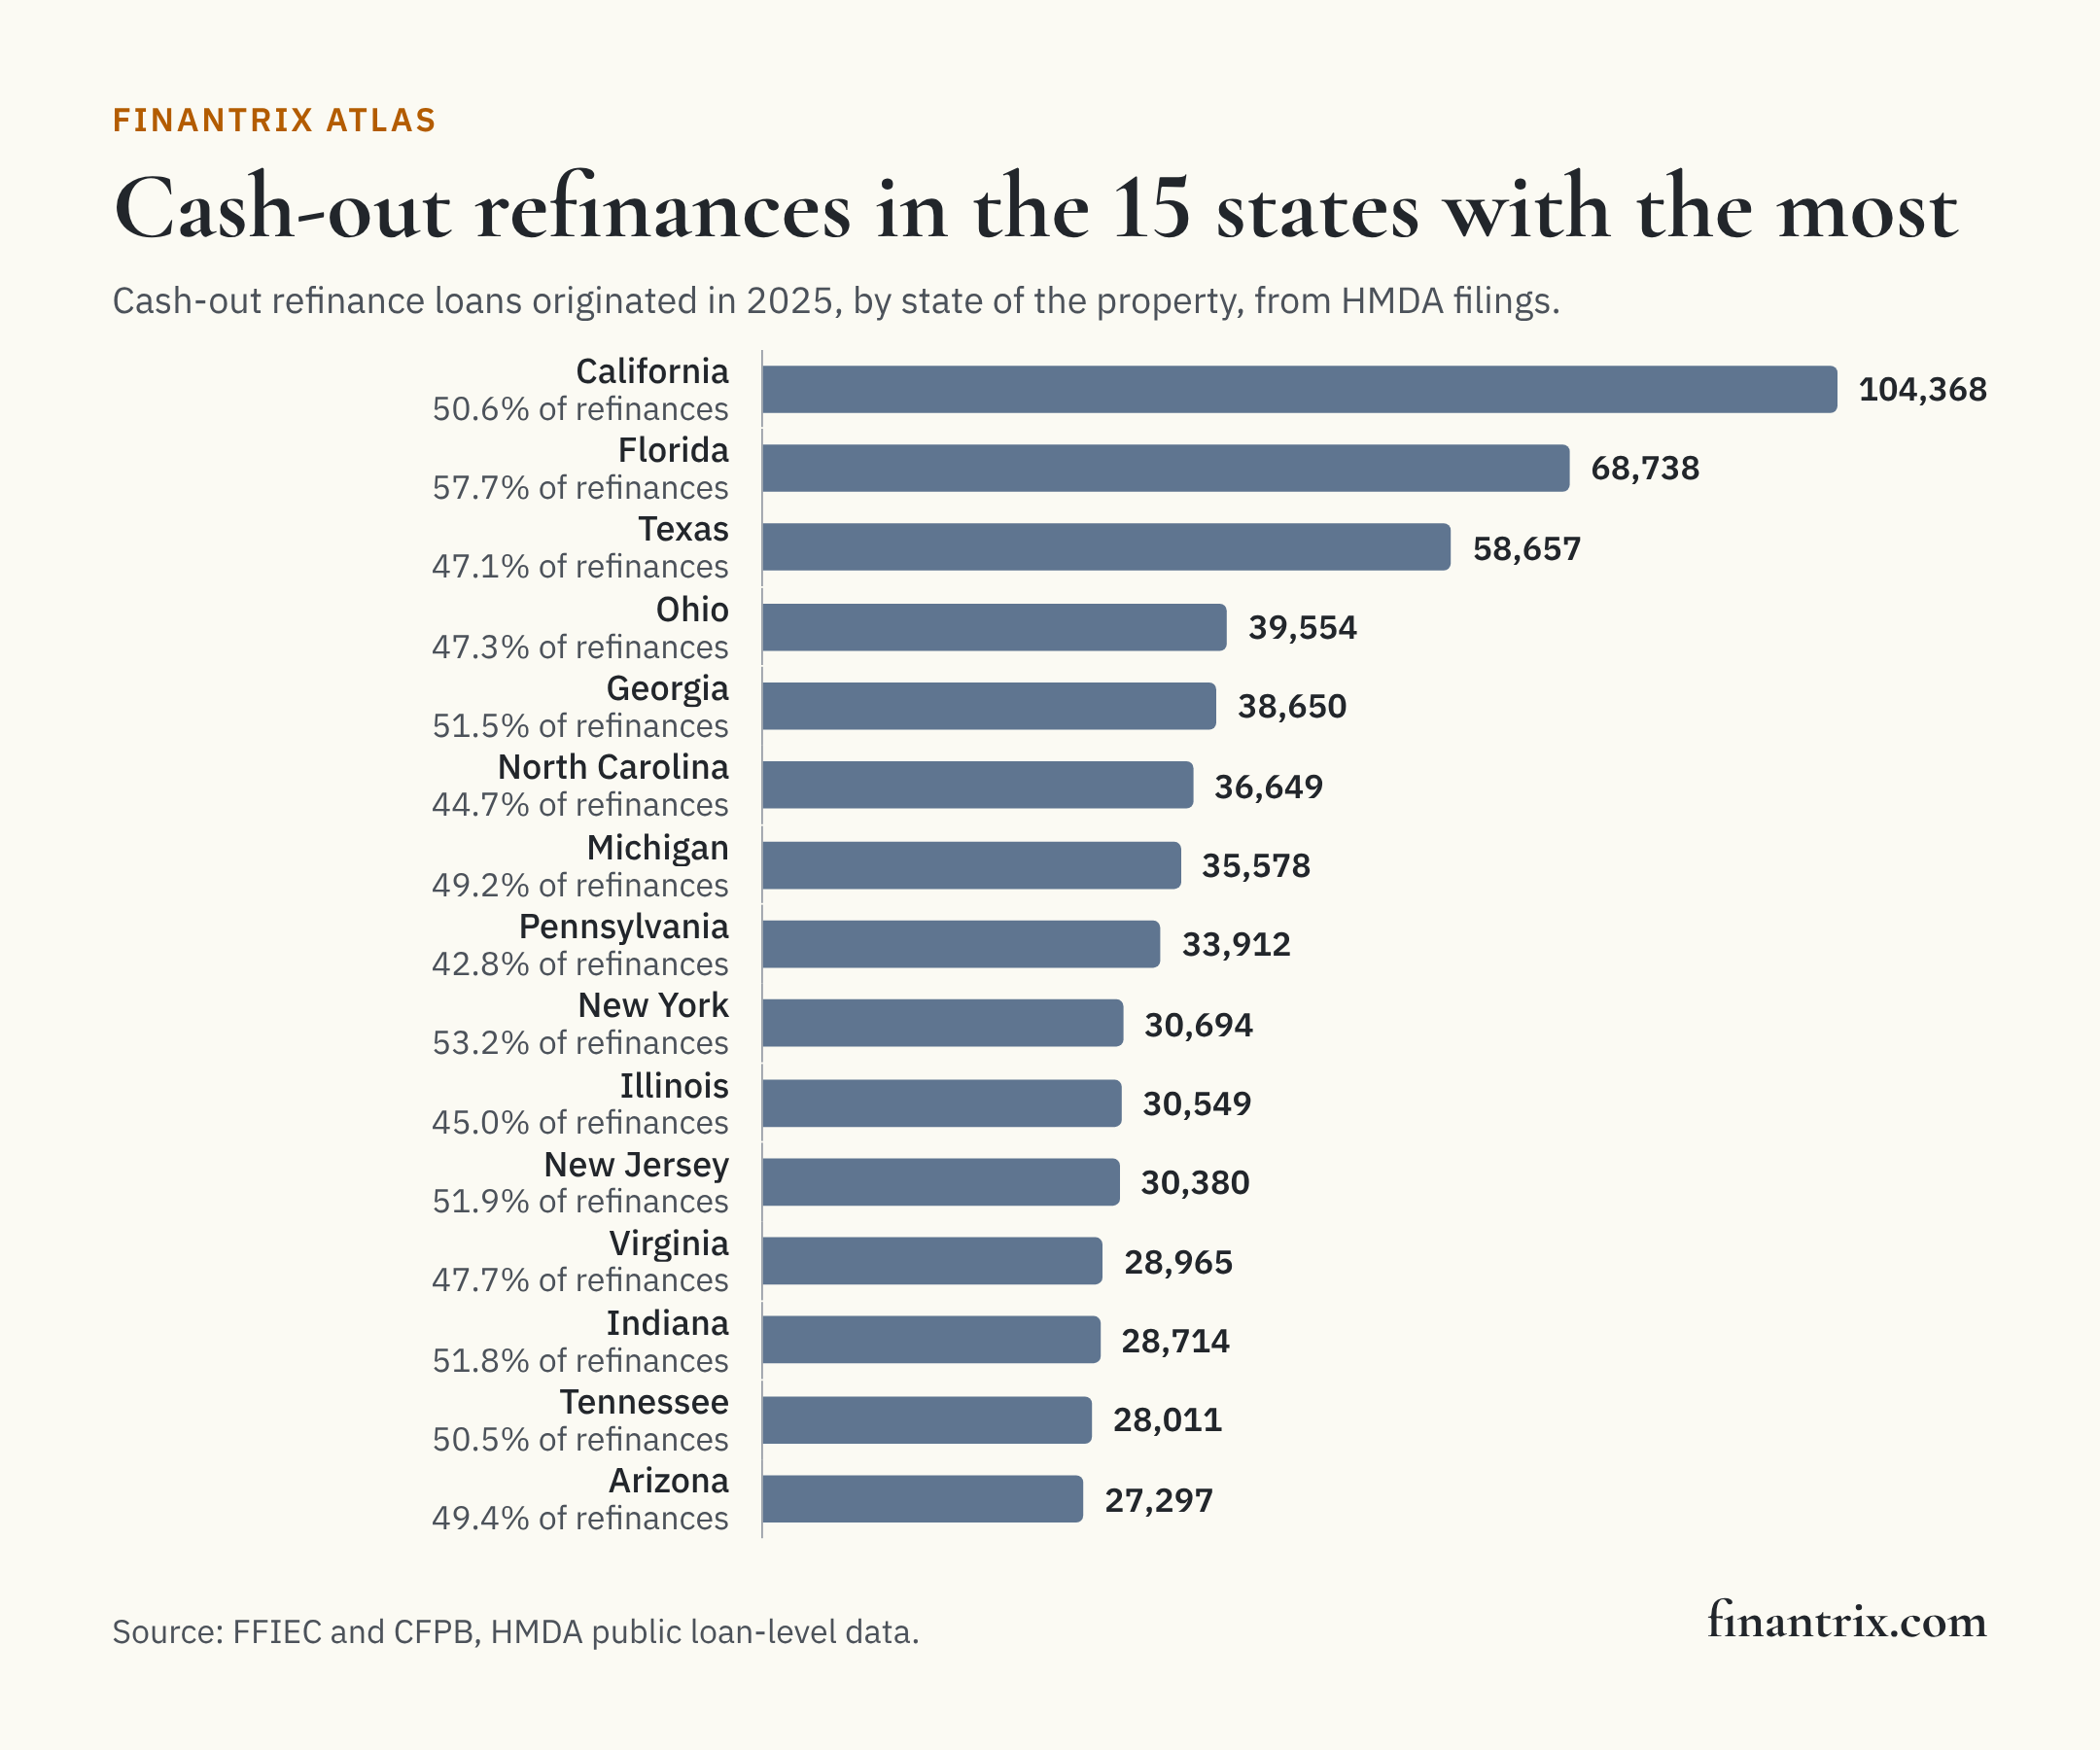
Cash-out refinances in every state
Ranked by cash-out refinance loans originated in 2025, by the state of the property, for the 51 states and the District of Columbia. "Share of the state's refinances" is cash-out loans as a share of all refinances there. The largest cash-out lender is the one that made the most of them in the state, with its share of the state's cash-out loans.
| Rank | State | Cash-out refinances | Share of the state's refinances | Amount | Change from a year earlier | Lenders | Largest cash-out lender | Its share | Source |
|---|---|---|---|---|---|---|---|---|---|
| 1 | California | 104,368 | 50.6% | $45.4 billion | +28% | 618 | Rocket Mortgage | 17% | FFIEC |
| 2 | Florida | 68,738 | 57.7% | $20.1 billion | +10% | 742 | Rocket Mortgage | 21% | FFIEC |
| 3 | Texas | 58,657 | 47.1% | $14.3 billion | +19% | 700 | Rocket Mortgage | 19% | FFIEC |
| 4 | Ohio | 39,554 | 47.3% | $8.1 billion | +22% | 509 | Rocket Mortgage | 20% | FFIEC |
| 5 | Georgia | 38,650 | 51.5% | $9.7 billion | +13% | 531 | Rocket Mortgage | 26% | FFIEC |
| 6 | North Carolina | 36,649 | 44.7% | $9.3 billion | +26% | 511 | Rocket Mortgage | 24% | FFIEC |
| 7 | Michigan | 35,578 | 49.2% | $7.6 billion | +25% | 474 | Rocket Mortgage | 28% | FFIEC |
| 8 | Pennsylvania | 33,912 | 42.8% | $7.0 billion | +23% | 539 | Rocket Mortgage | 21% | FFIEC |
| 9 | New York | 30,694 | 53.2% | $14.4 billion | +28% | 376 | Rocket Mortgage | 25% | FFIEC |
| 10 | Illinois | 30,549 | 45.0% | $7.8 billion | +34% | 570 | Rocket Mortgage | 17% | FFIEC |
| 11 | New Jersey | 30,380 | 51.9% | $9.9 billion | +34% | 444 | Rocket Mortgage | 21% | FFIEC |
| 12 | Virginia | 28,965 | 47.7% | $7.5 billion | +29% | 449 | Rocket Mortgage | 25% | FFIEC |
| 13 | Indiana | 28,714 | 51.8% | $5.0 billion | +22% | 467 | Rocket Mortgage | 16% | FFIEC |
| 14 | Tennessee | 28,011 | 50.5% | $6.8 billion | +18% | 516 | Rocket Mortgage | 22% | FFIEC |
| 15 | Arizona | 27,297 | 49.4% | $7.7 billion | +21% | 465 | Rocket Mortgage | 23% | FFIEC |
| 16 | Washington | 23,431 | 43.3% | $7.9 billion | +35% | 413 | Rocket Mortgage | 22% | FFIEC |
| 17 | Wisconsin | 22,205 | 43.6% | $4.4 billion | +23% | 440 | Rocket Mortgage | 13% | FFIEC |
| 18 | Colorado | 21,559 | 44.9% | $6.6 billion | +24% | 439 | Rocket Mortgage | 17% | FFIEC |
| 19 | Maryland | 20,125 | 50.4% | $5.0 billion | +26% | 388 | Rocket Mortgage | 23% | FFIEC |
| 20 | South Carolina | 18,989 | 50.9% | $4.9 billion | +21% | 441 | Rocket Mortgage | 25% | FFIEC |
| 21 | Missouri | 18,826 | 43.1% | $3.8 billion | +25% | 433 | Rocket Mortgage | 20% | FFIEC |
| 22 | Massachusetts | 16,765 | 39.2% | $6.0 billion | +28% | 438 | Rocket Mortgage | 21% | FFIEC |
| 23 | Alabama | 15,370 | 46.4% | $3.2 billion | +25% | 394 | Rocket Mortgage | 22% | FFIEC |
| 24 | Kentucky | 13,189 | 44.1% | $2.6 billion | +25% | 349 | Rocket Mortgage | 22% | FFIEC |
| 25 | Minnesota | 12,751 | 42.8% | $3.1 billion | +30% | 376 | Rocket Mortgage | 19% | FFIEC |
| 26 | Oregon | 11,940 | 48.2% | $3.6 billion | +39% | 342 | Rocket Mortgage | 20% | FFIEC |
| 27 | Utah | 11,745 | 38.0% | $3.8 billion | +28% | 264 | Rocket Mortgage | 18% | FFIEC |
| 28 | Connecticut | 11,040 | 50.2% | $3.7 billion | +34% | 356 | Rocket Mortgage | 22% | FFIEC |
| 29 | Nevada | 10,899 | 54.6% | $3.0 billion | +28% | 293 | Rocket Mortgage | 27% | FFIEC |
| 30 | Oklahoma | 9,345 | 45.9% | $1.7 billion | +28% | 318 | Rocket Mortgage | 22% | FFIEC |
| 31 | Idaho | 9,283 | 57.9% | $2.3 billion | +29% | 268 | Idaho Central Credit Union | 22% | FFIEC |
| 32 | Louisiana | 7,449 | 37.8% | $1.4 billion | +22% | 290 | Rocket Mortgage | 21% | FFIEC |
| 33 | Kansas | 7,421 | 43.0% | $1.4 billion | +20% | 317 | Rocket Mortgage | 23% | FFIEC |
| 34 | Arkansas | 7,356 | 41.8% | $1.5 billion | +29% | 275 | Rocket Mortgage | 26% | FFIEC |
| 35 | Iowa | 7,136 | 36.4% | $1.3 billion | +25% | 276 | Rocket Mortgage | 18% | FFIEC |
| 36 | New Mexico | 5,930 | 54.0% | $1.3 billion | +25% | 236 | Rocket Mortgage | 25% | FFIEC |
| 37 | New Hampshire | 5,403 | 46.4% | $1.5 billion | +32% | 251 | Rocket Mortgage | 24% | FFIEC |
| 38 | Mississippi | 5,343 | 32.5% | $989 million | +19% | 231 | Rocket Mortgage | 28% | FFIEC |
| 39 | Maine | 5,231 | 49.5% | $1.2 billion | +23% | 228 | Rocket Mortgage | 19% | FFIEC |
| 40 | Nebraska | 5,048 | 40.8% | $1.0 billion | +30% | 217 | Rocket Mortgage | 26% | FFIEC |
| 41 | West Virginia | 4,042 | 52.0% | $689 million | +22% | 195 | Rocket Mortgage | 29% | FFIEC |
| 42 | Delaware | 3,778 | 47.8% | $845 million | +26% | 228 | Rocket Mortgage | 27% | FFIEC |
| 43 | Rhode Island | 3,735 | 41.4% | $1.2 billion | +26% | 206 | Rocket Mortgage | 17% | FFIEC |
| 44 | Montana | 3,399 | 47.2% | $1.0 billion | +32% | 200 | Rocket Mortgage | 24% | FFIEC |
| 45 | South Dakota | 2,211 | 45.2% | $478 million | +22% | 123 | Rocket Mortgage | 20% | FFIEC |
| 46 | Hawaii | 2,143 | 34.7% | $1.1 billion | +25% | 160 | Rocket Mortgage | 20% | FFIEC |
| 47 | Wyoming | 2,066 | 52.1% | $503 million | +28% | 157 | Rocket Mortgage | 28% | FFIEC |
| 48 | Alaska | 1,606 | 57.2% | $388 million | +38% | 106 | Rocket Mortgage | 26% | FFIEC |
| 49 | Vermont | 1,463 | 40.2% | $348 million | +33% | 121 | Rocket Mortgage | 29% | FFIEC |
| 50 | North Dakota | 1,273 | 38.6% | $287 million | +21% | 118 | Rocket Mortgage | 19% | FFIEC |
| 51 | District of Columbia | 1,093 | 42.5% | $678 million | +23% | 163 | Rocket Mortgage | 20% | FFIEC |
Download this table (CSV), free. The full dataset, every state with its refinances, cash-out loans, amounts, prior-year counts and leading lender's identifier, is one email away.
Who makes cash-out refinances
Rocket Mortgage made the most cash-out refinances in every state but one, Idaho, where Idaho Central Credit Union did, according to HMDA filings. Cash-out refinances rose from 2024 in every state. Nationally the loans totaled $266 billion, an average of about $279,000 each.
What this means for technology buyers
A cash-out refinance is a new mortgage written against a home's equity, so a lender needs an origination system that prices and underwrites it and, for an existing borrower, the data to know when one would make sense. These guides compare the options side by side:
- Loan origination systems for mortgage banks: taking, underwriting and closing a refinance.
- Credit decision engines for consumer lending: the rules behind an approval and a loan amount.
- CRM for financial services: reaching existing borrowers.
Mapping the business? The Banking and Payments Capability Matrix covers retail lending, where mortgage origination sits, alongside the rest of a bank.
More from Finantrix Atlas
- Largest mortgage refinance lenders
- Largest HELOC lenders
- Largest mortgage lenders in the US
- Largest mortgage lender in each state
How this list was built
The universe is every loan originated in the FFIEC's public HMDA loan-level file for 2025 and 2024, the same file as our ranking of the largest mortgage lenders, placed in the state of the property. A loan is a cash-out refinance when its loan purpose is cash-out refinancing; the state's refinances are those with either refinance purpose. Records in the territories or with no state reported are in the national totals and not in the table.
The file's total originations match the FFIEC Data Browser's national count for both years, each lender's record count matches the FFIEC's filer list, and every state's refinance and cash-out counts match the Data Browser's own counts for that state, to the loan.
Limits
- Lenders below HMDA's thresholds are missing. Small lenders that do not report under HMDA are not counted, so state totals understate the market slightly.
- The lender's classification. Whether a refinance is cash-out is how the lender classified it in processing the application, so two lenders may draw the line differently.
- A count, not a rate. States with more homes and more mortgages have more refinances; the share of refinances is the comparable figure.
- Amounts are rounded. The FFIEC's public file rounds each loan amount to the midpoint of a $10,000 band. The data are for 2025.
Cite this
Free to quote, cite and republish, including the chart, with credit to Finantrix Atlas and a link to this page.
US lenders made 953,349 cash-out refinances in 2025, 48% of all mortgage refinances, according to a Finantrix Atlas analysis of HMDA data.
Suggested citation: Finantrix Atlas, "Cash-Out Refinances by State," 2025, from FFIEC and CFPB HMDA data. https://www.finantrix.com/articles/cash-out-refinance-by-state
Embed the chart:
<a href="https://www.finantrix.com/articles/cash-out-refinance-by-state"><img src="https://www.finantrix.com/atlas/cash-out-refinance-by-state.png?v=2025-12-31" alt="Cash-out refinances by US state, from Finantrix Atlas"></a>
<p>Chart: <a href="https://www.finantrix.com/articles/cash-out-refinance-by-state">Finantrix Atlas</a>, from HMDA data.</p>
Frequently asked questions
Q: How many cash-out refinances were there in 2025? A: 953,349, according to HMDA filings, up 24% from 2024.
Q: Which state has the most cash-out refinances? A: California, with 104,368 in 2025, according to HMDA data.
Q: What share of refinances are cash-out? A: 48% nationally in 2025, according to HMDA data, from 32.5% in Mississippi to 57.9% in Idaho.
Download the data
Two CSV files, free: the 51 rows on this page, and the full dataset of all 51 rows, as of December 31, 2025.
Frequently Asked Questions
How many cash-out refinances were there in 2025?
953,349, according to HMDA filings, up 24% from 2024.
Which state has the most cash-out refinances?
California, with 104,368 in 2025, according to HMDA data.
What share of refinances are cash-out?
48% nationally in 2025, according to HMDA data, from 32.5% in Mississippi to 57.9% in Idaho.