
Key Takeaways
- Citizens Bank opened more home equity lines of credit than any other US lender in 2025, 57,404 lines with $12.0 billion of credit, according to HMDA data.
- According to HMDA data, reporting lenders opened 1,200,733 HELOCs in 2025, up 12% from 2024; the ten largest opened 28% of them.
- Banks and credit unions opened 88.8% of HELOCs in 2025, according to HMDA filings; independent mortgage companies opened 11.2%.
- Lenders that opened fewer than 200 lines in either of the two prior years do not report them under HMDA, so the total understates the market.
Citizens Bank opened more home equity lines of credit than any other US lender in 2025: 57,404 lines with $12.0 billion of credit, according to HMDA data. Bank of America and PNC Bank follow. Reporting lenders opened 1,200,733 HELOCs that year, up 12% from 2024, and banks and credit unions opened 88.8% of them, according to HMDA filings.
Every number is from the loan-level data lenders file under the Home Mortgage Disclosure Act, as published by the FFIEC and the CFPB for 2025. A HELOC here is an open-end line of credit secured by a home, reverse mortgages excluded, which is how the CFPB counts them.
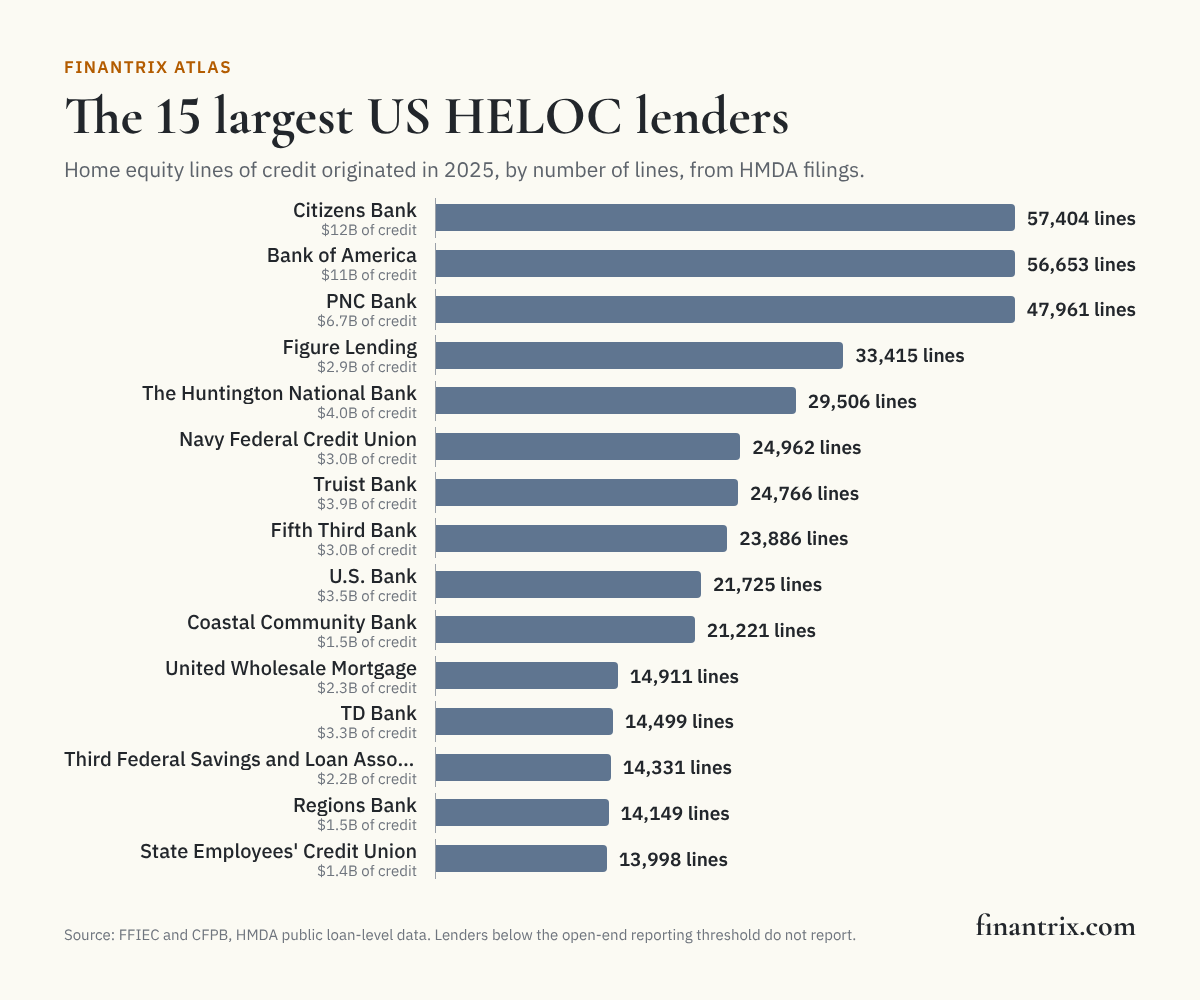
The 50 largest US HELOC lenders
Lenders are ranked by the number of home equity lines they opened. The credit extended is the total of the lines' credit limits, which is the amount HMDA records for an open-end line, not what borrowers drew. The first-lien column shows how many of a lender's lines are the only lien on the home rather than a second one behind a mortgage.
| Rank | Lender | Type | HELOCs originated | Credit extended | Average line | Share of reported HELOCs | First-lien share | Change from a year earlier | Source |
|---|---|---|---|---|---|---|---|---|---|
| 1 | Citizens Bank | Bank | 57,404 | $12.0 billion | $210,000 | 4.8% | 28% | +30% | FFIEC |
| 2 | Bank of America | Bank | 56,653 | $10.6 billion | $187,000 | 4.7% | 28% | +3% | FFIEC |
| 3 | PNC Bank | Bank | 47,961 | $6.7 billion | $140,000 | 4.0% | 28% | +10% | FFIEC |
| 4 | Figure Lending | Independent mortgage company | 33,415 | $2.9 billion | $88,000 | 2.8% | 10% | −2% | FFIEC |
| 5 | The Huntington National Bank | Bank | 29,506 | $4.0 billion | $136,000 | 2.5% | 34% | −1% | FFIEC |
| 6 | Navy Federal Credit Union | Credit union | 24,962 | $3.0 billion | $122,000 | 2.1% | 9% | +21% | FFIEC |
| 7 | Truist Bank | Bank | 24,766 | $3.9 billion | $158,000 | 2.1% | 35% | +25% | FFIEC |
| 8 | Fifth Third Bank | Bank | 23,886 | $3.0 billion | $125,000 | 2.0% | 29% | +55% | FFIEC |
| 9 | U.S. Bank | Bank | 21,725 | $3.5 billion | $160,000 | 1.8% | 22% | +4% | FFIEC |
| 10 | Coastal Community Bank | Bank | 21,221 | $1.5 billion | $71,000 | 1.8% | 13% | +41% | FFIEC |
| 11 | United Wholesale Mortgage | Independent mortgage company | 14,911 | $2.3 billion | $152,000 | 1.2% | 0% | +10% | FFIEC |
| 12 | TD Bank | Bank | 14,499 | $3.3 billion | $224,000 | 1.2% | 31% | +3% | FFIEC |
| 13 | Third Federal Savings and Loan Association of Cleveland | Bank | 14,331 | $2.2 billion | $150,000 | 1.2% | 14% | −9% | FFIEC |
| 14 | Regions Bank | Bank | 14,149 | $1.5 billion | $103,000 | 1.2% | 35% | +12% | FFIEC |
| 15 | State Employees' Credit Union | Credit union | 13,998 | $1.4 billion | $98,000 | 1.2% | 20% | −13% | FFIEC |
| 16 | Manufacturers and Traders Trust | Bank | 13,235 | $1.9 billion | $142,000 | 1.1% | 38% | +14% | FFIEC |
| 17 | Homebridge Financial Services | Independent mortgage company | 12,387 | $1.8 billion | $147,000 | 1.0% | 14% | +77% | FFIEC |
| 18 | Spring EQ | Independent mortgage company | 11,764 | $1.4 billion | $120,000 | 1.0% | 6% | −15% | FFIEC |
| 19 | BMO Bank | Bank | 11,533 | $2.1 billion | $183,000 | 1.0% | 39% | +5% | FFIEC |
| 20 | Boeing Employees Credit Union | Credit union | 11,120 | $1.8 billion | $158,000 | 0.9% | 14% | +10% | FFIEC |
| 21 | Lendage | Independent mortgage company | 10,890 | $794 million | $73,000 | 0.9% | 5% | +31% | FFIEC |
| 22 | Desert Financial Credit Union | Credit union | 9,892 | $1.3 billion | $127,000 | 0.8% | 15% | +15% | FFIEC |
| 23 | America First Federal Credit Union | Credit union | 8,994 | $1.3 billion | $144,000 | 0.7% | 11% | +1% | FFIEC |
| 24 | SchoolsFirst Federal Credit Union | Credit union | 8,299 | $1.6 billion | $187,000 | 0.7% | 13% | +29% | FFIEC |
| 25 | Summit Credit Union | Credit union | 8,003 | $846 million | $106,000 | 0.7% | 12% | +13% | FFIEC |
| 26 | Pentagon Federal Credit Union | Credit union | 7,368 | $1.2 billion | $165,000 | 0.6% | 12% | +10% | FFIEC |
| 27 | First-Citizens Bank & Trust | Bank | 7,071 | $1.5 billion | $211,000 | 0.6% | 30% | −13% | FFIEC |
| 28 | The Loan Store | Independent mortgage company | 6,869 | $780 million | $114,000 | 0.6% | 13% | +33% | FFIEC |
| 29 | loanDepot.com | Independent mortgage company | 6,484 | $627 million | $97,000 | 0.5% | 4% | −25% | FFIEC |
| 30 | ENT Credit Union | Credit union | 6,337 | $827 million | $130,000 | 0.5% | 17% | +5% | FFIEC |
| 31 | Bethpage Federal Credit Union | Credit union | 6,198 | $1.3 billion | $202,000 | 0.5% | 13% | −20% | FFIEC |
| 32 | JPMorgan Chase Bank | Bank | 6,175 | $1.7 billion | $277,000 | 0.5% | 19% | +1074% | FFIEC |
| 33 | Suncoast Credit Union | Credit union | 6,175 | $564 million | $91,000 | 0.5% | 20% | +12% | FFIEC |
| 34 | Zions Bancorporation | Bank | 6,038 | $1.8 billion | $294,000 | 0.5% | 33% | −5% | FFIEC |
| 35 | Idaho Central Credit Union | Credit union | 5,984 | $926 million | $155,000 | 0.5% | 21% | +17% | FFIEC |
| 36 | University of Wisconsin Credit Union | Credit union | 5,932 | $617 million | $104,000 | 0.5% | 12% | +3% | FFIEC |
| 37 | Alliant Credit Union | Credit union | 5,886 | $1.1 billion | $182,000 | 0.5% | 10% | +21% | FFIEC |
| 38 | Onpoint Community Credit Union | Credit union | 5,698 | $630 million | $111,000 | 0.5% | 14% | +11% | FFIEC |
| 39 | First National Bank of Pennsylvania | Bank | 5,198 | $993 million | $191,000 | 0.4% | 33% | +24% | FFIEC |
| 40 | Mountain America Federal Credit Union | Credit union | 4,697 | $691 million | $147,000 | 0.4% | 14% | +7% | FFIEC |
| 41 | Members 1st | Credit union | 4,666 | $554 million | $119,000 | 0.4% | 21% | +6% | FFIEC |
| 42 | Arvest Bank | Bank | 4,628 | $597 million | $129,000 | 0.4% | 26% | +9% | FFIEC |
| 43 | Cadence Bank | Bank | 4,623 | $687 million | $149,000 | 0.4% | 35% | −3% | FFIEC |
| 44 | CrossCountry Mortgage | Independent mortgage company | 4,619 | $474 million | $103,000 | 0.4% | 9% | n/a | FFIEC |
| 45 | CMG Mortgage | Independent mortgage company | 4,612 | $1.8 billion | $387,000 | 0.4% | 57% | +42% | FFIEC |
| 46 | Lake Michigan Credit Union | Credit union | 4,571 | $545 million | $119,000 | 0.4% | 17% | +29% | FFIEC |
| 47 | Broadview Federal Credit Union | Credit union | 4,561 | $461 million | $101,000 | 0.4% | 21% | +21% | FFIEC |
| 48 | Landmark Credit Union | Credit union | 4,530 | $473 million | $104,000 | 0.4% | 21% | +19% | FFIEC |
| 49 | Quorum Federal Credit Union | Credit union | 4,527 | $903 million | $200,000 | 0.4% | 12% | +55% | FFIEC |
| 50 | United Community Bank | Bank | 4,506 | $849 million | $188,000 | 0.4% | 37% | +29% | FFIEC |
Download this table (CSV), free. The full dataset, every lender that reported a HELOC, with applications, denials and year-earlier volume, is one email away.
Who makes HELOCs
- Banks opened 50.3% of reported HELOCs in 2025 and credit unions 38.4%, according to HMDA filings. Independent mortgage companies opened 11.2%, according to the same filings.
- The ten largest lenders opened 28% of reported HELOCs, and the 50 in the table 55%, according to HMDA data. The smallest of them opened 4,506 lines.
- Citizens Bank also extended the most credit.
- The average line carried a credit limit of about $153,000, according to HMDA data.
- 1,143 lenders reported opening a HELOC in 2025, according to HMDA filings.
What this means for technology buyers
According to HMDA data, banks and credit unions open most home equity lines, so the systems that take, decide and service a line are bought mostly by depositories rather than mortgage companies. These guides compare the options:
- Credit decision engines for consumer lending: the rules and models behind an approval and a credit limit.
- Loan origination systems for mortgage banks: taking and documenting a lien on the home.
- Mobile banking apps for regional banks: where a borrower draws on and repays a line.
Mapping the business? The Retail Bank Business Capability Model covers home equity lending alongside the rest of a bank.
More from Finantrix Atlas
How this list was built
The universe is every institution in the FFIEC's public HMDA loan-level file for 2025 that reported an open-end line of credit, the same file as our ranking of the largest mortgage lenders. Each lender's originated open-end lines, reverse mortgages excluded, were counted and their credit limits summed. Each lender's type comes from the FDIC's and NCUA's records first and the FFIEC's own lender codes after them, as on our page on banks and nonbanks in mortgage lending.
The file's total originations match the FFIEC Data Browser's national count, and each lender's record count matches the FFIEC's filer list. The Data Browser cannot filter open-end lines, so the open-end count was checked against the CFPB's own: read the same way, the HMDA files for 2022 and 2023 reproduce the HELOC totals and counts of reporting institutions the CFPB published for those years, and its list of the largest open-end lenders.
Limits
- Lenders below the reporting threshold are missing. Under the CFPB's HMDA rule, Regulation C, an institution reports open-end lines only if it originated at least 200 of them in each of the two preceding years (500 from 2018 to 2021). Every lender in the table opened far more than that, so the ranking is complete at the top, but the national total understates the market. A lender that grew past the threshold within the year would also be missing until it reports.
- Some small lenders do not flag open-end lines. A partially exempt lender may report the open-end flag as exempt. The most loans any lender reported that way was 1,188, fewer than the smallest lender in the table opened, so none could change the ranking.
- Credit limits, not balances. The dollar amount is what lenders made available, not what borrowers borrowed, and the FFIEC's public file rounds each amount to the midpoint of a $10,000 band.
- Lines, not closed-end home equity loans. A fixed home equity loan is closed-end and is not counted here.
- Lenders, not groups. A bank and its subsidiaries file separately and are ranked separately.
- The data are for 2025.
Cite this
Free to quote, cite and republish, including the chart, with credit to Finantrix Atlas and a link to this page.
Citizens Bank opened 57,404 home equity lines of credit in 2025, the most of any US lender, according to a Finantrix Atlas analysis of HMDA data.
Banks and credit unions opened 88.8% of reported US HELOCs in 2025, according to Finantrix Atlas.
Suggested citation: Finantrix Atlas, "Largest HELOC Lenders in the US," 2025, from FFIEC and CFPB HMDA data. https://www.finantrix.com/articles/largest-heloc-lenders
Embed the chart:
<a href="https://www.finantrix.com/articles/largest-heloc-lenders"><img src="https://www.finantrix.com/atlas/largest-heloc-lenders.png" alt="The largest US HELOC lenders, from Finantrix Atlas"></a>
<p>Chart: <a href="https://www.finantrix.com/articles/largest-heloc-lenders">Finantrix Atlas</a>, from HMDA data.</p>
Frequently asked questions
Q: Who is the largest HELOC lender in the US? A: Citizens Bank, which opened 57,404 home equity lines of credit in 2025, according to HMDA data.
Q: How many HELOCs were opened in 2025? A: According to HMDA filings, 1,200,733 by lenders that report them, up 12% from 2024. Lenders below HMDA's open-end reporting threshold are not counted.
Q: Do banks or nonbanks make most HELOCs? A: Banks and credit unions opened 88.8% of reported HELOCs in 2025, according to HMDA data, and independent mortgage companies 11.2%.
Q: Which lenders have to report HELOCs under HMDA? A: Institutions that originated at least 200 open-end lines of credit in each of the two preceding years, along with HMDA's other coverage tests. Smaller lenders do not report them.
Download the data
The 50 rows on this page (CSV), free. The full dataset has all 1,143 rows, as of December 31, 2025; we email you a link.
Frequently Asked Questions
Who is the largest HELOC lender in the US?
Citizens Bank, which opened 57,404 home equity lines of credit in 2025, according to HMDA data.
How many HELOCs were opened in 2025?
According to HMDA filings, 1,200,733 by lenders that report them, up 12% from 2024. Lenders below HMDA's open-end reporting threshold are not counted.
Do banks or nonbanks make most HELOCs?
Banks and credit unions opened 88.8% of reported HELOCs in 2025, according to HMDA data, and independent mortgage companies 11.2%.
Which lenders have to report HELOCs under HMDA?
Institutions that originated at least 200 open-end lines of credit in each of the two preceding years, along with HMDA's other coverage tests. Smaller lenders do not report them.