
Key Takeaways
- Independent mortgage companies made 64.1% of US closed-end home loans in 2025, according to HMDA data, against 51.8% in 2018.
- By dollar volume, independent mortgage companies made 63.0% of home loans in 2025, according to HMDA data; banks made 26.4% and credit unions 7.1%.
- Banks and savings institutions made 22.5% of home loans by count in 2025 and credit unions 9.7%, according to HMDA filings.
- 773 independent mortgage companies reported home loans in 2025, against 2,376 banks and 1,491 credit unions, according to HMDA filings.
Independent mortgage companies made 64.1% of US home loans in 2025, the highest share of any year since 2018, according to HMDA data, up from 51.8% in 2018. Banks and savings institutions made 22.5%, credit unions 9.7%, and mortgage companies owned by or affiliated with a bank or credit union 3.7%. By dollar volume, the independent share was 63.0%, according to HMDA data.
Every figure is from the loan-level data lenders file under the Home Mortgage Disclosure Act, as published by the FFIEC and the CFPB, for each year from 2018 to 2025. A home loan here is a closed-end loan on a one-to-four family dwelling, reverse mortgages excluded.
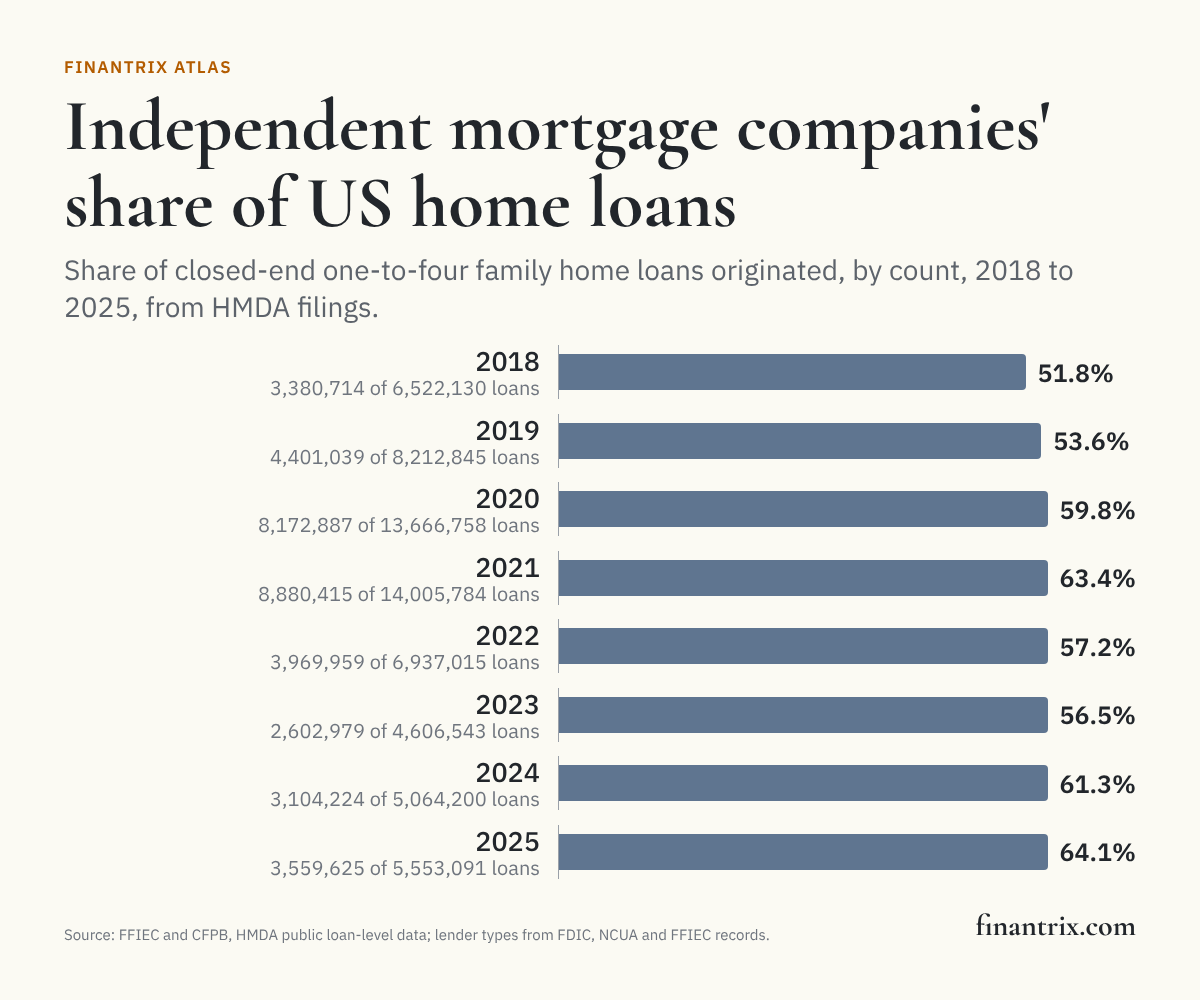
Who made US home loans, by count
Each row is one year. The shares add to the year's closed-end home loans, counted by the type of lender that originated them.
| Year | Home loans | Independent mortgage companies | Banks and savings institutions | Credit unions | Bank- and credit union-affiliated mortgage companies | Source |
|---|---|---|---|---|---|---|
| 2018 | 6,522,130 | 51.8% | 34.8% | 10.2% | 3.2% | FFIEC |
| 2019 | 8,212,845 | 53.6% | 32.7% | 9.4% | 4.2% | FFIEC |
| 2020 | 13,666,758 | 59.8% | 27.9% | 8.0% | 4.3% | FFIEC |
| 2021 | 14,005,784 | 63.4% | 26.3% | 7.4% | 2.9% | FFIEC |
| 2022 | 6,937,015 | 57.2% | 28.6% | 10.4% | 3.7% | FFIEC |
| 2023 | 4,606,543 | 56.5% | 27.6% | 11.4% | 4.5% | FFIEC |
| 2024 | 5,064,200 | 61.3% | 24.3% | 10.1% | 4.3% | FFIEC |
| 2025 | 5,553,091 | 64.1% | 22.5% | 9.7% | 3.7% | FFIEC |
Who made US home loans, by dollar volume
| Year | Dollar volume | Independent mortgage companies | Banks and savings institutions | Credit unions | Bank- and credit union-affiliated mortgage companies | Source |
|---|---|---|---|---|---|---|
| 2018 | $1.62 trillion | 50.6% | 39.1% | 7.1% | 3.2% | FFIEC |
| 2019 | $2.28 trillion | 52.2% | 37.2% | 6.7% | 3.9% | FFIEC |
| 2020 | $4.02 trillion | 59.0% | 30.8% | 6.2% | 4.1% | FFIEC |
| 2021 | $4.35 trillion | 62.0% | 29.7% | 5.6% | 2.8% | FFIEC |
| 2022 | $2.30 trillion | 54.9% | 34.1% | 7.3% | 3.7% | FFIEC |
| 2023 | $1.45 trillion | 57.1% | 31.0% | 7.3% | 4.6% | FFIEC |
| 2024 | $1.68 trillion | 62.0% | 27.1% | 6.7% | 4.2% | FFIEC |
| 2025 | $1.95 trillion | 63.0% | 26.4% | 7.1% | 3.5% | FFIEC |
Download this table (CSV), free. The full dataset, every reporting lender in every year with its type and the rule that decided it, is one email away.
How the split has moved
- According to HMDA data, the independent share of home loans was higher in 2025 than in any other year since 2018, and lowest at 51.8% in 2018. It was 61.3% in 2024, according to HMDA filings.
- Independent mortgage companies made more home loans than any other type of lender in every year shown, according to HMDA filings.
- Counting the mortgage companies that banks and credit unions own, nondepository lenders made 67.8% of home loans in 2025, according to HMDA data.
- The bank share was 34.8% in 2018 and 22.5% in 2025; the credit union share was 10.2% and 9.7%, according to HMDA filings.
The largest lender of each type
By dollar volume of closed-end home loans in 2025, with the number of lenders of each type that reported one.
| Type | Largest lender of the type | Home loans originated | Loans | Lenders of this type | Source |
|---|---|---|---|---|---|
| Independent mortgage company | United Wholesale Mortgage | $162 billion | 407,209 | 773 | FFIEC |
| Bank or savings institution | JPMorgan Chase Bank | $46.3 billion | 84,175 | 2,376 | FFIEC |
| Credit union | Navy Federal Credit Union | $15.5 billion | 55,584 | 1,491 | FFIEC |
| Mortgage company owned by or affiliated with a bank or credit union | DHI Mortgage Company | $23.4 billion | 69,159 | 77 | FFIEC |
What this means for technology buyers
Most home loans are made by lenders that do nothing but mortgages, and that shapes what the software market builds for: origination platforms tuned for volume, fast decisioning, and the reporting every loan carries under HMDA. A bank or credit union buying the same systems is buying in a market set largely by nonbank lenders. These guides compare the options:
- Loan origination systems for mortgage banks: the system of record from application to closing.
- Credit decision engines for consumer lending: the rules and models behind an approval.
- CRM for financial services: keeping refinance and repeat borrowers.
Mapping where lending sits in a bank? The Retail Bank Business Capability Model covers it alongside the rest of the business.
More from Finantrix Atlas
- Largest mortgage lenders in the US
- Largest banks in the US
- Largest credit unions
- Largest community banks
How this list was built
The universe is every institution in the FFIEC's public HMDA loan-level file for each year from 2018, the first year of data collected under the CFPB's revised HMDA rule, to 2025. Each year is read from the newest edition the FFIEC has published for it, the one its Data Browser serves, and its total originations match the Data Browser's national count. For 2024 and 2025 these are the same files as our ranking of the largest mortgage lenders.
HMDA does not say whether a filer is a bank, so each filer was given one of four types, in this order of evidence:
- Bank or savings institution: the FDIC's records carry the filer's LEI or its Federal Reserve RSSD number, or exactly one FDIC-insured institution has its name in its state.
- Credit union: the NCUA's records carry the filer's RSSD number or exactly its name in its state.
- Otherwise, the FFIEC's own lender code from its Reporter Panel: a depository, a subsidiary or affiliate of one, or an independent mortgage company. The panel was discontinued after its last edition, so a later filer takes its most recent panel record.
- Otherwise, the agency it files with. A filer that reports to a bank or credit union regulator but is not itself insured is counted as affiliated; one that reports to HUD or the CFPB as independent. This rule covers a small share of loans, and a check fails the build if it grows.
A bank's mortgage subsidiary is therefore counted as an affiliated mortgage company, not as a bank, which is how the CFPB counts it. As a check on the typing, the CFPB's own lender-type shares for 2023 were reproduced within 1.5 percentage points: it reported that independent mortgage companies made 56.1% of closed-end originations, and the same count here gives 56.2%.
Limits
- Small lenders are missing. Institutions below HMDA's reporting thresholds do not file. According to the CFPB, the threshold for closed-end loans was higher for some years than for others, so the number of reporting lenders, and the smallest lenders' share, are not comparable across every year.
- Types are as of each filing, not as of today. A lender that was bought or sold changes column in the year its records change, and the FFIEC's own lender code changes from one year to the next for a few filers. As a test, the independent share in the FFIEC data was recomputed with every lender held at its most recent type: the trend described here holds, and no year moves by more than 1.9 percentage points.
- Brokers are invisible. A loan is credited to the lender that made the credit decision. A loan a broker brought in is reported by that lender; brokers do not file.
- Open-end lines are left out. Home equity lines of credit are a different product, which the CFPB reports are made mostly by banks and credit unions; they are counted on their own page.
- Rounded amounts. The FFIEC's public file rounds each loan amount to the midpoint of a $10,000 band, so dollar shares are close to, not exactly, what each type lent.
- The data are annual, from 2018 through 2025.
Cite this
Free to quote, cite and republish, including the chart, with credit to Finantrix Atlas and a link to this page.
Independent mortgage companies made 64.1% of US closed-end home loans in 2025, according to a Finantrix Atlas analysis of HMDA data.
Banks made 22.5% of US home loans in 2025 and credit unions 9.7%, according to Finantrix Atlas.
Suggested citation: Finantrix Atlas, "Banks vs Nonbanks in US Mortgage Lending," 2018 to 2025, from FFIEC and CFPB HMDA data. https://www.finantrix.com/articles/bank-vs-nonbank-mortgage-share
Embed the chart:
<a href="https://www.finantrix.com/articles/bank-vs-nonbank-mortgage-share"><img src="https://www.finantrix.com/atlas/bank-vs-nonbank-mortgage-share.png" alt="Independent mortgage companies' share of US home loans, from Finantrix Atlas"></a>
<p>Chart: <a href="https://www.finantrix.com/articles/bank-vs-nonbank-mortgage-share">Finantrix Atlas</a>, from HMDA data.</p>
Frequently asked questions
Q: What share of US mortgages do nonbanks make? A: Independent mortgage companies made 64.1% of US closed-end home loans in 2025, according to HMDA data. Counting mortgage companies owned by banks and credit unions, nondepository lenders made 67.8%, according to HMDA data.
Q: What is an independent mortgage company? A: A lender that is not a bank, savings institution or credit union and is not owned by one. It takes no deposits, and according to the CFPB's annual mortgage market report, such lenders sell most of the loans they make. The CFPB's report uses the same category.
Q: What share of mortgages do banks make? A: Banks and savings institutions made 22.5% of US closed-end home loans in 2025 by count and 26.4% by dollar volume, according to HMDA data.
Q: Has the nonbank share of mortgage lending grown? A: According to HMDA data, independent mortgage companies made 51.8% of home loans in 2018 and 64.1% in 2025, the highest of the 8 years. Their share fell from 63.4% in 2021 to 56.5% in 2023 before rising again, according to HMDA data.
Q: Who is the largest nonbank mortgage lender? A: United Wholesale Mortgage, which originated $162 billion in closed-end home loans in 2025, according to HMDA data.
Download the data
The 8 rows on this page (CSV), free. The full dataset has all 38,939 rows, as of December 31, 2025; we email you a link.
Frequently Asked Questions
What share of US mortgages do nonbanks make?
Independent mortgage companies made 64.1% of US closed-end home loans in 2025, according to HMDA data. Counting mortgage companies owned by banks and credit unions, nondepository lenders made 67.8%, according to HMDA data.
What is an independent mortgage company?
A lender that is not a bank, savings institution or credit union and is not owned by one. It takes no deposits, and according to the CFPB's annual mortgage market report, such lenders sell most of the loans they make. The CFPB's report uses the same category.
What share of mortgages do banks make?
Banks and savings institutions made 22.5% of US closed-end home loans in 2025 by count and 26.4% by dollar volume, according to HMDA data.
Has the nonbank share of mortgage lending grown?
According to HMDA data, independent mortgage companies made 51.8% of home loans in 2018 and 64.1% in 2025, the highest of the 8 years. Their share fell from 63.4% in 2021 to 56.5% in 2023 before rising again, according to HMDA data.
Who is the largest nonbank mortgage lender?
United Wholesale Mortgage, which originated $162 billion in closed-end home loans in 2025, according to HMDA data.