
Key Takeaways
- United Wholesale Mortgage originated the most US home loans in 2025, $164 billion across 422,120 loans, according to HMDA data.
- According to HMDA data, lenders originated $2.14 trillion in home loans in 2025, up 17% from 2024; the largest ten took 26% of it.
- Refinancing was 32% of dollar volume and home purchase 60%, according to HMDA filings.
- 4,733 lenders reported originating home loans in 2025.
United Wholesale Mortgage originated more US home loans than any other lender in 2025: $164 billion across 422,120 loans, according to HMDA data. Rocket Mortgage and CrossCountry Mortgage follow. Lenders originated $2.14 trillion in home loans that year, up 17% from 2024, and the largest ten took 26% of it.
Every figure is from the loan-level data lenders file under the Home Mortgage Disclosure Act, as published by the FFIEC and the CFPB for 2025.
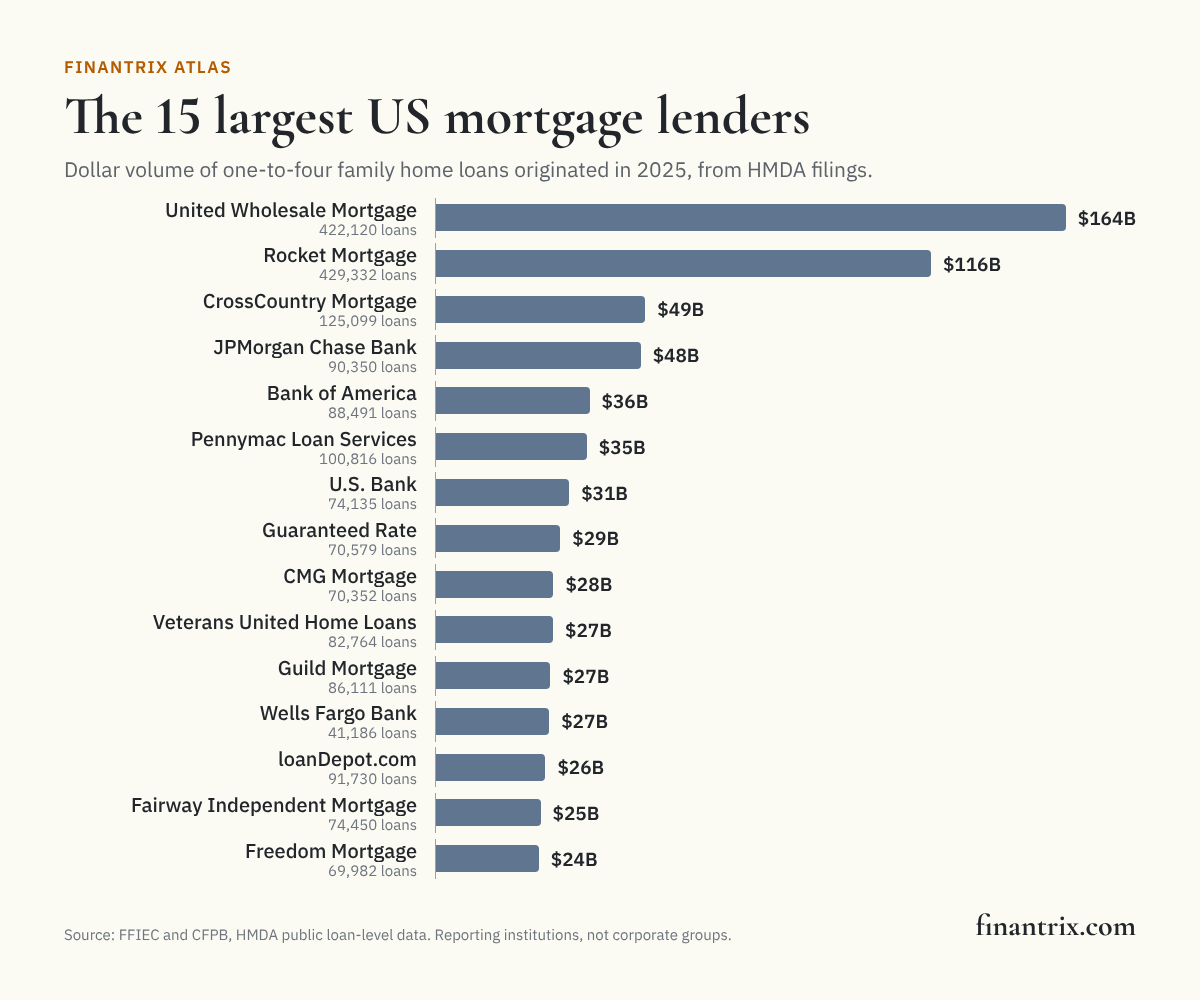
The 50 largest US mortgage lenders
Lenders are ranked by the dollar volume of loans they originated on one-to-four family homes, including manufactured homes. Loans a lender bought from another are not originations and are not counted. The mix columns show where each lender's business comes from, and the change column compares each lender with its own HMDA filing a year earlier.
| Rank | Lender | Home loans originated | Loans | Market share | Purchase share of its loans | Refinance share | FHA, VA and USDA share | Change from a year earlier | Source |
|---|---|---|---|---|---|---|---|---|---|
| 1 | United Wholesale Mortgage (United Shore Financial Services) | $164 billion | 422,120 | 7.7% | 57% | 43% | 38% | +18% | FFIEC |
| 2 | Rocket Mortgage, LLC | $116 billion | 429,332 | 5.4% | 44% | 54% | 23% | +19% | FFIEC |
| 3 | CrossCountry Mortgage, Inc. | $49.1 billion | 125,099 | 2.3% | 78% | 20% | 32% | +25% | FFIEC |
| 4 | JPMorgan Chase Bank, National Association | $48.1 billion | 90,350 | 2.2% | 56% | 37% | 3% | +26% | FFIEC |
| 5 | Bank of America, National Association | $36.0 billion | 88,491 | 1.7% | 49% | 29% | 1% | +22% | FFIEC |
| 6 | Pennymac Loan Services, LLC | $35.4 billion | 100,816 | 1.7% | 50% | 46% | 40% | +56% | FFIEC |
| 7 | U.S. Bank National Association | $31.3 billion | 74,135 | 1.5% | 56% | 34% | 4% | +7% | FFIEC |
| 8 | Guaranteed Rate, Inc. | $29.2 billion | 70,579 | 1.4% | 76% | 22% | 25% | +18% | FFIEC |
| 9 | CMG Mortgage, Inc. | $27.6 billion | 70,352 | 1.3% | 79% | 21% | 37% | +27% | FFIEC |
| 10 | Veterans United Home Loans (Mortgage Research Center) | $27.5 billion | 82,764 | 1.3% | 82% | 18% | 95% | +18% | FFIEC |
| 11 | Guild Mortgage Company | $26.9 billion | 86,111 | 1.3% | 82% | 17% | 34% | +16% | FFIEC |
| 12 | Wells Fargo Bank, National Association | $26.6 billion | 41,186 | 1.2% | 45% | 53% | 5% | +30% | FFIEC |
| 13 | loanDepot.com, LLC | $25.7 billion | 91,730 | 1.2% | 57% | 35% | 34% | +8% | FFIEC |
| 14 | Fairway Independent Mortgage Corporation | $24.5 billion | 74,450 | 1.1% | 85% | 14% | 32% | +4% | FFIEC |
| 15 | Freedom Mortgage Corporation | $24.1 billion | 69,982 | 1.1% | 18% | 82% | 89% | +24% | FFIEC |
| 16 | DHI Mortgage Company, Ltd. | $23.4 billion | 69,159 | 1.1% | 100% | 0% | 65% | −2% | FFIEC |
| 17 | Newrez LLC | $22.0 billion | 66,567 | 1.0% | 49% | 51% | 37% | +37% | FFIEC |
| 18 | Citizens Bank, National Association | $20.1 billion | 68,680 | 0.9% | 34% | 36% | 1% | +37% | FFIEC |
| 19 | Lennar Mortgage, LLC | $19.9 billion | 56,951 | 0.9% | 100% | 0% | 45% | 0% | FFIEC |
| 20 | Movement Mortgage, LLC | $19.9 billion | 57,781 | 0.9% | 80% | 19% | 32% | −4% | FFIEC |
| 21 | Navy Federal Credit Union | $18.5 billion | 80,546 | 0.9% | 61% | 18% | 24% | +5% | FFIEC |
| 22 | New American Funding (Broker Solutions) | $16.5 billion | 57,460 | 0.8% | 73% | 23% | 41% | +21% | FFIEC |
| 23 | Citibank, National Association | $15.6 billion | 15,681 | 0.7% | 63% | 30% | 0% | +16% | FFIEC |
| 24 | The Loan Store, Inc. | $14.3 billion | 40,008 | 0.7% | 72% | 22% | 10% | +77% | FFIEC |
| 25 | PNC Bank, National Association | $12.6 billion | 61,074 | 0.6% | 38% | 41% | 1% | −1% | FFIEC |
| 26 | Morgan Stanley Private Bank, National Association | $11.8 billion | 10,735 | 0.6% | 67% | 9% | 0% | +5% | FFIEC |
| 27 | Truist Bank | $11.7 billion | 41,011 | 0.5% | 56% | 26% | 3% | +21% | FFIEC |
| 28 | Union Home Mortgage Corp. | $11.4 billion | 37,767 | 0.5% | 76% | 23% | 32% | +49% | FFIEC |
| 29 | Kind Lending, LLC | $11.2 billion | 29,401 | 0.5% | 78% | 19% | 37% | +53% | FFIEC |
| 30 | The Huntington National Bank | $10.9 billion | 51,160 | 0.5% | 49% | 31% | 5% | +6% | FFIEC |
| 31 | Nationstar Mortgage LLC | $10.0 billion | 52,217 | 0.5% | 20% | 60% | 17% | +21% | FFIEC |
| 32 | Paramount Residential Mortgage Group, Inc. | $9.2 billion | 23,410 | 0.4% | 81% | 18% | 42% | +26% | FFIEC |
| 33 | American Pacific Mortgage Corporation | $8.7 billion | 24,783 | 0.4% | 84% | 16% | 39% | +18% | FFIEC |
| 34 | TD Bank, National Association | $8.5 billion | 23,350 | 0.4% | 46% | 31% | 0% | +8% | FFIEC |
| 35 | PrimeLending, A PlainsCapital Company | $8.2 billion | 24,706 | 0.4% | 88% | 11% | 30% | +2% | FFIEC |
| 36 | Pulte Mortgage LLC | $8.1 billion | 18,825 | 0.4% | 100% | 0% | 27% | −2% | FFIEC |
| 37 | Prosperity Home Mortgage, LLC | $8.0 billion | 20,869 | 0.4% | 84% | 15% | 28% | +13% | FFIEC |
| 38 | Fifth Third Bank, National Association | $7.9 billion | 39,511 | 0.4% | 47% | 30% | 3% | +27% | FFIEC |
| 39 | Mutual of Omaha Mortgage, Inc. | $7.8 billion | 24,192 | 0.4% | 39% | 54% | 55% | +29% | FFIEC |
| 40 | Kiavi Funding, Inc. | $7.8 billion | 25,518 | 0.4% | 81% | 19% | 0% | +20% | FFIEC |
| 41 | NFM, Inc. | $7.3 billion | 18,920 | 0.3% | 87% | 11% | 34% | +10% | FFIEC |
| 42 | Guaranteed Rate Affinity, LLC | $7.0 billion | 15,936 | 0.3% | 84% | 15% | 18% | +20% | FFIEC |
| 43 | Manufacturers and Traders Trust Company | $6.8 billion | 23,356 | 0.3% | 54% | 28% | 10% | +28% | FFIEC |
| 44 | OCMBC, Inc. | $6.8 billion | 16,280 | 0.3% | 63% | 37% | 21% | +27% | FFIEC |
| 45 | BMO Bank National Association | $6.4 billion | 16,514 | 0.3% | 52% | 30% | 2% | −25% | FFIEC |
| 46 | Charles Schwab Bank, SSB | $6.2 billion | 6,065 | 0.3% | 64% | 28% | 0% | +63% | FFIEC |
| 47 | NVR Mortgage Finance, Inc. | $6.0 billion | 16,403 | 0.3% | 100% | 0% | 44% | −4% | FFIEC |
| 48 | Regions Bank | $5.8 billion | 30,110 | 0.3% | 44% | 39% | 6% | +7% | FFIEC |
| 49 | A&D Mortgage LLC | $5.8 billion | 14,585 | 0.3% | 66% | 34% | 5% | +97% | FFIEC |
| 50 | Lower, LLC | $5.8 billion | 17,905 | 0.3% | 75% | 25% | 37% | +7% | FFIEC |
Download this table (CSV), free. The full dataset, every reporting lender with its originations, mix and year-earlier volume, is one email away.
How concentrated mortgage lending is
- The largest ten lenders took 26% of home loan dollar volume in 2025, and the 50 in the table 51%, according to HMDA data. The smallest of them originated $5.8 billion.
- 4,733 lenders reported originating 6,784,665 home loans in all.
- Volume was up 17% from $1.83 trillion in 2024.
- Refinancing was 32% of dollar volume and home purchase lending 60%, according to HMDA filings.
What this means for technology buyers
A lender at this volume runs origination, decisioning and customer systems built to move loans to closing quickly and to report every one under HMDA. These guides compare the options:
- Loan origination systems for mortgage banks: the system of record from application to closing.
- CRM for financial services: keeping refinance and repeat borrowers.
Mapping the business? The Retail Bank Business Capability Model covers lending alongside the rest of a bank, and the Retail Banking Business Architecture Toolkit puts it to work.
More from Finantrix Atlas
How this list was built
The universe is every institution in the FFIEC's public HMDA loan-level file for 2025. Every bank, credit union and nonbank lender above HMDA's reporting thresholds files it. Each lender's originated loans on one-to-four family dwellings were summed by dollar amount and count, with multifamily lending left out. The totals were checked against two figures the FFIEC publishes separately: the national count of originations in its HMDA Data Browser, and each lender's number of records filed.
Limits
- Rounded amounts. The public file rounds each loan amount to the midpoint of a $10,000 band, so a lender's dollar volume is close to, not exactly, what it lent.
- Lenders, not groups. A bank and its mortgage subsidiary file separately and are ranked separately.
- Who originates, not who funds. A loan is credited to the lender that made the credit decision. Brokers do not file, and a wholesale lender reports loans that brokers brought it.
- Small lenders are missing. Institutions below HMDA's reporting thresholds do not file, so the totals slightly understate the market.
- Mix columns include multifamily. The purchase, refinance and government-backed shares cover all of a lender's originations.
Cite this
Free to quote, cite and republish, including the chart, with credit to Finantrix Atlas and a link to this page.
United Wholesale Mortgage originated $164 billion in US home loans in 2025, the most of any lender, according to a Finantrix Atlas analysis of HMDA data.
The ten largest mortgage lenders made 26% of US home loan dollar volume in 2025, according to Finantrix Atlas.
Suggested citation: Finantrix Atlas, "Largest US Mortgage Lenders by Originations," 2025, from FFIEC and CFPB HMDA data. https://www.finantrix.com/articles/largest-mortgage-lenders
Embed the chart:
<a href="https://www.finantrix.com/articles/largest-mortgage-lenders"><img src="https://www.finantrix.com/atlas/largest-mortgage-lenders.png" alt="The largest US mortgage lenders by originations, from Finantrix Atlas"></a>
<p>Chart: <a href="https://www.finantrix.com/articles/largest-mortgage-lenders">Finantrix Atlas</a>, from HMDA data.</p>
Frequently asked questions
Q: Who is the largest mortgage lender in the US? A: United Wholesale Mortgage, which originated $164 billion in home loans in 2025, according to HMDA data.
Q: How much did US lenders originate in home loans? A: According to HMDA filings, $2.14 trillion across 6,784,665 loans in 2025, up 17% from 2024.
Q: What is HMDA data? A: Loan-level data that most US mortgage lenders must report each year under the Home Mortgage Disclosure Act. The FFIEC and the CFPB publish it with details that could identify a borrower removed.
Download the data
The 50 rows on this page (CSV), free. The full dataset has all 4,733 rows, as of December 31, 2025; we email you a link.
Frequently Asked Questions
Who is the largest mortgage lender in the US?
United Wholesale Mortgage, which originated $164 billion in home loans in 2025, according to HMDA data.
How much did US lenders originate in home loans?
According to HMDA filings, $2.14 trillion across 6,784,665 loans in 2025, up 17% from 2024.
What is HMDA data?
Loan-level data that most US mortgage lenders must report each year under the Home Mortgage Disclosure Act. The FFIEC and the CFPB publish it with details that could identify a borrower removed.