
Key Takeaways
- According to FDIC data, 140 US banks have $10 billion to $250 billion in assets on June 30, 2026; together they hold 22.9% of insured bank assets, against 27.8% a year earlier.
- Five banks grew past $250 billion in the year, according to FDIC data: The Huntington National Bank, Fifth Third Bank, Morgan Stanley Bank, Morgan Stanley Private Bank and Charles Schwab Bank, SSB; The Huntington National Bank and Fifth Third Bank absorbed another bank's charter on the way.
- The largest bank in the band is First-Citizens Bank & Trust Company, with $236 billion, according to the FDIC; the ten largest hold 31.6% of the band's assets and the median bank holds $24.6 billion.
- Texas and Utah are headquarters to more of the band's banks than any other state, 12 each, according to FDIC data.
The 140 US banks with $10 billion to $250 billion in assets hold 22.9% of the assets of every FDIC-insured bank, down from 27.8% a year earlier, according to FDIC data. The fall is banks leaving at the top. Five banks grew past $250 billion in the year, according to FDIC data: The Huntington National Bank, Fifth Third Bank, Morgan Stanley Bank, Morgan Stanley Private Bank and Charles Schwab Bank, SSB; The Huntington National Bank and Fifth Third Bank absorbed another bank's charter on the way. Four more were absorbed by banks that are now above $250 billion, according to the FDIC: Comerica Bank (into Fifth Third Bank), Cadence Bank (into The Huntington National Bank), FirstBank (into PNC Bank) and Veritex Community Bank (into The Huntington National Bank). A year earlier those banks held 5.2% of insured bank assets, according to the FDIC.
According to the FDIC, the largest bank in the band is First-Citizens Bank & Trust Company of Raleigh, NC, with $236 billion, followed by Citizens Bank and Manufacturers and Traders Trust Company. The band is the one the FDIC uses for one of the five asset-size groups in its Quarterly Banking Profile, and its count and share match that publication for both dates.
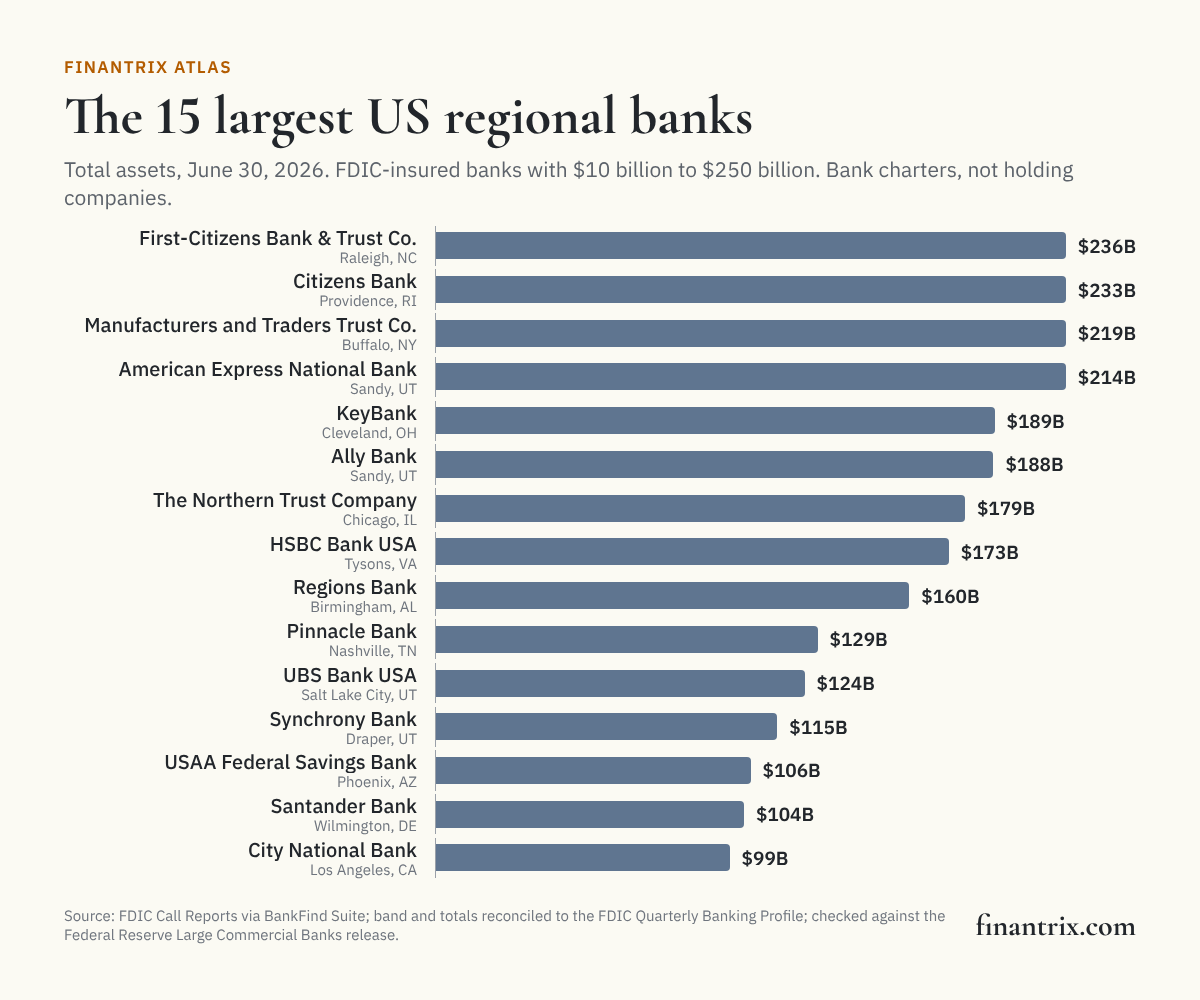 regional banks, FDIC-insured banks with $10 billion to $250 billion in total assets, June 30, 2026, from FDIC data, led by First-Citizens Bank & Trust Company at $236 billion">
Every US bank with $10 billion to $250 billion in assets
Ranked by total assets on June 30, 2026. Each row is one bank charter. "Change in a year" compares the bank's total assets with its own Call Report for June 30, 2025. The FDIC specialization is the FDIC's own classification of each bank by where its assets are concentrated.
| Rank | Bank | Headquarters | Total assets | Change in a year | Deposits | US offices | FDIC specialization | Source |
|---|---|---|---|---|---|---|---|---|
| 1 | First-Citizens Bank & Trust Company | Raleigh, NC | $236 billion | +3.0% | $174 billion | 518 | Commercial lending | FDIC |
| 2 | Citizens Bank | Providence, RI | $233 billion | +6.7% | $189 billion | 977 | All other | FDIC |
| 3 | Manufacturers and Traders Trust Company | Buffalo, NY | $219 billion | +3.7% | $172 billion | 960 | Commercial lending | FDIC |
| 4 | American Express National Bank | Sandy, UT | $214 billion | +1.1% | $172 billion | 1 | Credit card | FDIC |
| 5 | KeyBank | Cleveland, OH | $189 billion | +3.3% | $158 billion | 952 | Commercial lending | FDIC |
| 6 | Ally Bank | Sandy, UT | $188 billion | +5.7% | $157 billion | 1 | Consumer lending | FDIC |
| 7 | The Northern Trust Company | Chicago, IL | $179 billion | +4.2% | $148 billion | 65 | International | FDIC |
| 8 | HSBC Bank USA | Tysons, VA | $173 billion | +2.0% | $141 billion | 22 | All other | FDIC |
| 9 | Regions Bank | Birmingham, AL | $160 billion | +1.3% | $132 billion | 1,256 | Commercial lending | FDIC |
| 10 | Pinnacle Bank ◊ | Nashville, TN | $129 billion | +135.5% | $102 billion | 429 | Commercial lending | FDIC |
| 11 | UBS Bank USA | Salt Lake City, UT | $124 billion | +8.9% | $109 billion | 1 | All other | FDIC |
| 12 | Synchrony Bank | Draper, UT | $115 billion | +1.2% | $86.0 billion | 1 | Credit card | FDIC |
| 13 | USAA Federal Savings Bank | Phoenix, AZ | $106 billion | −0.3% | $92.0 billion | 2 | All other | FDIC |
| 14 | Santander Bank | Wilmington, DE | $104 billion | +0.6% | $84.4 billion | 368 | All other | FDIC |
| 15 | City National Bank | Los Angeles, CA | $99.1 billion | +5.2% | $81.5 billion | 71 | Commercial lending | FDIC |
| 16 | Western Alliance Bank | Phoenix, AZ | $98.6 billion | +13.8% | $82.3 billion | 38 | Commercial lending | FDIC |
| 17 | Zions Bancorporation | Salt Lake City, UT | $89.0 billion | +0.2% | $76.6 billion | 413 | Commercial lending | FDIC |
| 18 | Flagstar Bank | Hicksville, NY | $87.7 billion | −4.8% | $67.5 billion | 345 | Commercial lending | FDIC |
| 19 | Webster Bank ‡ | Stamford, CT | $85.9 billion | +5.0% | $70.7 billion | 194 | Commercial lending | FDIC |
| 20 | East West Bank | Pasadena, CA | $84.3 billion | +8.6% | $70.3 billion | 97 | Commercial lending | FDIC |
| 21 | First Horizon Bank | Memphis, TN | $84.1 billion | +2.9% | $68.8 billion | 416 | Commercial lending | FDIC |
| 22 | Old National Bank | Evansville, IN | $73.9 billion | +4.5% | $57.0 billion | 361 | Commercial lending | FDIC |
| 23 | UMB Bank | Kansas City, MO | $71.9 billion | +0.6% | $60.2 billion | 207 | Commercial lending | FDIC |
| 24 | SouthState Bank | Winter Haven, FL | $68.8 billion | +4.4% | $56.4 billion | 374 | Commercial lending | FDIC |
| 25 | CIBC Bank USA | Chicago, IL | $66.5 billion | +10.2% | $51.5 billion | 13 | Commercial lending | FDIC |
| 26 | Valley National Bank | Passaic, NJ | $66.2 billion | +5.7% | $54.3 billion | 232 | Commercial lending | FDIC |
| 27 | Columbia Bank ◊ | Roseburg, OR | $65.4 billion | +26.0% | $52.2 billion | 369 | Commercial lending | FDIC |
| 28 | Banco Popular de Puerto Rico | San Juan, PR | $63.3 billion | +4.2% | $58.7 billion | 1 | All other | FDIC |
| 29 | SoFi Bank | Cottonwood Heigh, UT | $56.8 billion | +56.6% | $46.8 billion | 4 | Consumer lending | FDIC |
| 30 | Frost Bank | San Antonio, TX | $54.0 billion | +4.8% | $43.7 billion | 222 | Commercial lending | FDIC |
| 31 | BOKF | Tulsa, OK | $53.0 billion | +4.1% | $40.0 billion | 115 | Commercial lending | FDIC |
| 32 | Associated Bank ◊ | Green Bay, WI | $51.8 billion | +17.8% | $40.1 billion | 218 | Commercial lending | FDIC |
| 33 | First National Bank of Pennsylvania | Greenville, PA | $50.8 billion | +2.6% | $39.1 billion | 361 | Commercial lending | FDIC |
| 34 | EverBank | Jacksonville, FL | $46.7 billion | +5.0% | $37.8 billion | 43 | All other | FDIC |
| 35 | Raymond James Bank | Saint Petersburg, FL | $45.6 billion | +7.8% | $41.4 billion | 1 | All other | FDIC |
| 36 | Prosperity Bank ◊ | El Campo, TX | $43.9 billion | +14.2% | $32.9 billion | 354 | Commercial lending | FDIC |
| 37 | Barclays Bank Delaware | Wilmington, DE | $43.5 billion | −1.3% | $35.3 billion | 1 | Credit card | FDIC |
| 38 | MidFirst Bank | Oklahoma City, OK | $42.8 billion | +5.9% | $25.3 billion | 93 | Commercial lending | FDIC |
| 39 | Bank OZK | Little Rock, AR | $41.7 billion | +0.6% | $34.0 billion | 272 | Commercial lending | FDIC |
| 40 | Deutsche Bank Trust Company Americas | New York, NY | $40.5 billion | −5.5% | $28.1 billion | 1 | All other | FDIC |
| 41 | Atlantic Union Bank | Richmond City, VA | $38.0 billion | +2.2% | $30.6 billion | 184 | Commercial lending | FDIC |
| 42 | Hancock Whitney Bank | Gulfport, MS | $36.3 billion | +3.2% | $29.9 billion | 186 | Commercial lending | FDIC |
| 43 | Commerce Bank ◊ | Kansas City, MO | $35.0 billion | +9.1% | $28.1 billion | 154 | Commercial lending | FDIC |
| 44 | Banc of California | Los Angeles, CA | $34.9 billion | +2.2% | $28.2 billion | 87 | Commercial lending | FDIC |
| 45 | BankUnited | Miami Lakes, FL | $34.9 billion | −1.6% | $29.1 billion | 58 | Commercial lending | FDIC |
| 46 | First National Bank of Omaha ◊ | Omaha, NE | $34.2 billion | +8.4% | $27.8 billion | 139 | All other | FDIC |
| 47 | United Bank | Fairfax, VA | $33.6 billion | +2.9% | $27.3 billion | 237 | Commercial lending | FDIC |
| 48 | Texas Capital Bank | Dallas, TX | $33.6 billion | +6.3% | $29.4 billion | 10 | Commercial lending | FDIC |
| 49 | Fulton Bank | Lancaster, PA | $32.6 billion | +2.1% | $27.4 billion | 208 | Commercial lending | FDIC |
| 50 | TD Bank USA | Wilmington, DE | $32.1 billion | −6.9% | $27.2 billion | 1 | All other | FDIC |
| 51 | Glacier Bank ◊ | Kalispell, MT | $31.6 billion | +8.9% | $24.9 billion | 261 | Commercial lending | FDIC |
| 52 | Eastern Bank ◊ | Boston, MA | $31.1 billion | +22.3% | $26.1 billion | 134 | Commercial lending | FDIC |
| 53 | BNY Mellon | Pittsburgh, PA | $30.6 billion | +3.5% | $26.0 billion | 29 | All other | FDIC |
| 54 | City National Bank of Florida | Miami, FL | $29.1 billion | +7.6% | $22.1 billion | 30 | Commercial lending | FDIC |
| 55 | United Community Bank | Greenville, SC | $29.0 billion | +3.4% | $24.1 billion | 190 | Commercial lending | FDIC |
| 56 | Axos Bank | San Diego, CA | $28.9 billion | +20.8% | $24.8 billion | 3 | Commercial lending | FDIC |
| 57 | Sallie Mae Bank | Salt Lake City, UT | $28.5 billion | −3.4% | $20.3 billion | 1 | Consumer lending | FDIC |
| 58 | Ameris Bank | Atlanta, GA | $28.4 billion | +6.8% | $22.7 billion | 177 | Commercial lending | FDIC |
| 59 | Arvest Bank | Fayetteville, AR | $28.1 billion | +2.6% | $24.6 billion | 228 | Commercial lending | FDIC |
| 60 | WesBanco Bank, Inc. | Wheeling, WV | $27.7 billion | +1.0% | $21.8 billion | 218 | Commercial lending | FDIC |
| 61 | WaFd Bank | Seattle, WA | $27.6 billion | +3.2% | $21.1 billion | 214 | Commercial lending | FDIC |
| 62 | Renasant Bank | Tupelo, MS | $27.0 billion | +1.4% | $22.2 billion | 266 | Commercial lending | FDIC |
| 63 | Charles Schwab Premier Bank, SSB | Westlake, TX | $26.6 billion | +8.8% | $24.5 billion | 1 | All other | FDIC |
| 64 | Customers Bank | Malvern, PA | $26.5 billion | +17.6% | $21.9 billion | 7 | Commercial lending | FDIC |
| 65 | First Interstate Bank | Billings, MT | $25.8 billion | −6.2% | $21.7 billion | 274 | Commercial lending | FDIC |
| 66 | Provident Bank | Jersey City, NJ | $25.7 billion | +4.5% | $19.6 billion | 139 | Commercial lending | FDIC |
| 67 | Ameriprise Bank, FSB | Minneapolis, MN | $25.5 billion | +6.1% | $23.9 billion | 2 | Mortgage lending | FDIC |
| 68 | Rockland Trust Company ◊ | Rockland, MA | $25.0 billion | +24.5% | $20.5 billion | 151 | Commercial lending | FDIC |
| 69 | Simmons Bank | Pine Bluff, AR | $24.7 billion | −7.1% | $19.9 billion | 230 | Commercial lending | FDIC |
| 70 | Cathay Bank | Los Angeles, CA | $24.6 billion | +3.9% | $21.1 billion | 65 | Commercial lending | FDIC |
| 71 | Centennial Bank ◊ | Conway, AR | $24.6 billion | +8.0% | $19.6 billion | 243 | Commercial lending | FDIC |
| 72 | TriState Capital Bank | Pittsburgh, PA | $24.3 billion | +14.6% | $22.3 billion | 2 | All other | FDIC |
| 73 | Bank of Hawaii | Honolulu, HI | $23.8 billion | +0.6% | $21.0 billion | 48 | Mortgage lending | FDIC |
| 74 | First Hawaiian Bank | Honolulu, HI | $23.6 billion | −0.8% | $20.2 billion | 45 | Commercial lending | FDIC |
| 75 | OceanFirst Bank ◊ | Toms River, NJ | $23.2 billion | +75.1% | $18.0 billion | 72 | Commercial lending | FDIC |
| 76 | TowneBank ◊ | Portsmouth, VA | $22.6 billion | +23.8% | $18.8 billion | 81 | Commercial lending | FDIC |
| 77 | Wilmington Savings Fund Society, FSB | Wilmington, DE | $22.6 billion | +9.1% | $19.3 billion | 95 | Commercial lending | FDIC |
| 78 | First Financial Bank ◊ | Cincinnati, OH | $22.4 billion | +20.6% | $17.8 billion | 165 | Commercial lending | FDIC |
| 79 | Beacon Bank and Trust ◊ | Brookline, MA | $22.2 billion | +260.3% | $18.6 billion | 151 | Commercial lending | FDIC |
| 80 | Optum Bank, Inc. | Draper, UT | $21.4 billion | +9.5% | $16.5 billion | 1 | Commercial lending | FDIC |
| 81 | Seacoast National Bank ◊ | Stuart, FL | $21.3 billion | +33.9% | $16.8 billion | 118 | Commercial lending | FDIC |
| 82 | First Merchants Bank ◊ | Muncie, IN | $21.3 billion | +14.7% | $16.8 billion | 135 | Commercial lending | FDIC |
| 83 | Mechanics Bank ◊ | Walnut Creek, CA | $21.2 billion | +28.2% | $18.1 billion | 169 | Commercial lending | FDIC |
| 84 | Citizens Business Bank ◊ | Ontario, CA | $21.2 billion | +37.4% | $16.4 billion | 87 | Commercial lending | FDIC |
| 85 | Merchants Bank of Indiana | Carmel, IN | $21.2 billion | +10.9% | $14.3 billion | 8 | Commercial lending | FDIC |
| 86 | The Central Trust Bank | Jefferson City, MO | $20.3 billion | +6.5% | $16.4 billion | 177 | Commercial lending | FDIC |
| 87 | Apple Bank | New York, NY | $19.9 billion | +8.4% | $16.1 billion | 79 | Commercial lending | FDIC |
| 88 | Stifel Bank and Trust | Saint Louis, MO | $19.6 billion | +6.2% | $17.5 billion | 2 | All other | FDIC |
| 89 | FirstBank Puerto Rico | Santurce, PR | $19.2 billion | +1.7% | $16.9 billion | 11 | Commercial lending | FDIC |
| 90 | Trustmark Bank | Jackson, MS | $19.2 billion | +3.1% | $16.2 billion | 181 | Commercial lending | FDIC |
| 91 | Bank of Hope | Los Angeles, CA | $19.0 billion | +2.4% | $15.9 billion | 78 | Commercial lending | FDIC |
| 92 | ServisFirst Bank | Birmingham, AL | $18.3 billion | +5.6% | $14.6 billion | 33 | Commercial lending | FDIC |
| 93 | Busey Bank | Champaign, IL | $18.1 billion | −3.8% | $15.2 billion | 81 | Commercial lending | FDIC |
| 94 | Third Federal Savings and Loan Association of Cleveland | Cleveland, OH | $18.1 billion | +4.0% | $10.2 billion | 35 | Mortgage lending | FDIC |
| 95 | Community Bank ◊ | Canton, NY | $17.4 billion | +6.4% | $14.9 billion | 214 | Commercial lending | FDIC |
| 96 | Enterprise Bank & Trust | Clayton, MO | $17.4 billion | +8.2% | $14.7 billion | 57 | Commercial lending | FDIC |
| 97 | Northwest Bank ◊ | Warren, PA | $17.2 billion | +18.7% | $14.4 billion | 163 | Commercial lending | FDIC |
| 98 | Toyota Financial Savings Bank | Henderson, NV | $16.8 billion | +42.7% | $14.3 billion | 1 | All other | FDIC |
| 99 | FirstBank ◊ | Nashville, TN | $16.8 billion | +25.8% | $14.4 billion | 132 | Commercial lending | FDIC |
| 100 | First United Bank and Trust Company | Durant, OK | $16.6 billion | +1.0% | $13.3 billion | 85 | Commercial lending | FDIC |
| 101 | Banner Bank | Walla Walla, WA | $16.6 billion | +0.9% | $13.9 billion | 147 | Commercial lending | FDIC |
| 102 | NBT Bank | Norwich, NY | $16.1 billion | +1.2% | $13.7 billion | 175 | Commercial lending | FDIC |
| 103 | Live Oak Banking Company | Wilmington, NC | $16.0 billion | +16.1% | $14.7 billion | 1 | Commercial lending | FDIC |
| 104 | Safra National Bank of New York | New York, NY | $15.7 billion | +45.3% | $13.9 billion | 6 | All other | FDIC |
| 105 | Sunflower Bank ◊ | Dallas, TX | $15.7 billion | +85.8% | $13.5 billion | 103 | Commercial lending | FDIC |
| 106 | Nicolet National Bank ◊ | Green Bay, WI | $15.4 billion | +72.6% | $13.0 billion | 119 | Commercial lending | FDIC |
| 107 | First Financial Bank | Abilene, TX | $15.2 billion | +6.4% | $13.3 billion | 83 | Commercial lending | FDIC |
| 108 | Bell Bank | Fargo, ND | $15.2 billion | +7.9% | $12.4 billion | 33 | Commercial lending | FDIC |
| 109 | Dime Commercial Bank | Hauppauge, NY | $15.0 billion | +5.9% | $12.7 billion | 64 | Commercial lending | FDIC |
| 110 | Popular Bank | New York, NY | $15.0 billion | +1.1% | $11.9 billion | 36 | Commercial lending | FDIC |
| 111 | Bank of America California | San Francisco, CA | $14.8 billion | −1.1% | $12.3 billion | 1 | Mortgage lending | FDIC |
| 112 | Stifel Bank | Saint Louis, MO | $14.6 billion | +26.8% | $13.7 billion | 1 | All other | FDIC |
| 113 | ConnectOne Bank | Englewood Cliffs, NJ | $14.4 billion | +3.6% | $11.8 billion | 57 | Commercial lending | FDIC |
| 114 | Israel Discount Bank of New York | New York, NY | $14.4 billion | +5.5% | $12.3 billion | 7 | Commercial lending | FDIC |
| 115 | NexBank | Dallas, TX | $14.2 billion | −0.2% | $11.0 billion | 2 | Mortgage lending | FDIC |
| 116 | Comenity Capital Bank | Draper, UT | $13.9 billion | +7.4% | $11.0 billion | 1 | Credit card | FDIC |
| 117 | BMW Bank of North America | Salt Lake City, UT | $13.8 billion | +12.3% | $9.5 billion | 1 | Consumer lending | FDIC |
| 118 | First Bank | Southern Pines, NC | $13.0 billion | +3.4% | $11.1 billion | 116 | Commercial lending | FDIC |
| 119 | BancFirst ◊ | Oklahoma City, OK | $12.8 billion | +8.0% | $11.2 billion | 123 | Commercial lending | FDIC |
| 120 | Dollar Bank, Federal Savings Bank | Pittsburgh, PA | $12.7 billion | +6.3% | $10.0 billion | 91 | Commercial lending | FDIC |
| 121 | PlainsCapital Bank | University Park, TX | $12.7 billion | +2.2% | $10.7 billion | 57 | Commercial lending | FDIC |
| 122 | The Park National Bank ◊ | Newark, OH | $12.6 billion | +27.5% | $10.8 billion | 114 | Commercial lending | FDIC |
| 123 | NBH Bank ◊ | Greenwood Villag, CO | $12.5 billion | +25.9% | $10.6 billion | 97 | Commercial lending | FDIC |
| 124 | Happen Bank | Lehi, UT | $12.5 billion | +17.0% | $10.9 billion | 3 | Consumer lending | FDIC |
| 125 | First Commonwealth Bank | Indiana, PA | $12.2 billion | −0.2% | $10.3 billion | 129 | Commercial lending | FDIC |
| 126 | Columbia Bank | Fair Lawn, NJ | $12.2 billion | +13.3% | $9.6 billion | 69 | Commercial lending | FDIC |
| 127 | Oriental Bank | San Juan, PR | $12.0 billion | −0.5% | $10.0 billion | 1 | All other | FDIC |
| 128 | Farmers and Merchants Bank of Long Beach | Long Beach, CA | $11.8 billion | +3.3% | $8.8 billion | 27 | Commercial lending | FDIC |
| 129 | Beal Bank USA | Las Vegas, NV | $11.0 billion | −35.0% | $1.7 billion | 10 | Commercial lending | FDIC |
| 130 | Burke & Herbert Bank & Trust Company ◊ | Alexandria, VA | $11.0 billion | +36.7% | $9.0 billion | 106 | Commercial lending | FDIC |
| 131 | WEX Bank | Sandy, UT | $10.7 billion | +20.7% | $7.9 billion | 1 | Commercial lending | FDIC |
| 132 | Washington Trust Bank | Spokane, WA | $10.5 billion | −1.3% | $8.8 billion | 45 | Commercial lending | FDIC |
| 133 | Charles Schwab Trust Bank | Westlake, TX | $10.5 billion | +8.7% | $9.7 billion | 1 | Mortgage lending | FDIC |
| 134 | Centier Bank | Whiting, IN | $10.4 billion | +5.9% | $8.8 billion | 63 | Commercial lending | FDIC |
| 135 | Stellar Bank ‡ | Houston, TX | $10.4 billion | −0.8% | $8.7 billion | 51 | Commercial lending | FDIC |
| 136 | Amarillo National Bank | Amarillo, TX | $10.4 billion | +5.8% | $9.1 billion | 35 | Commercial lending | FDIC |
| 137 | Stock Yards Bank & Trust Company ◊ | Louisville, KY | $10.4 billion | +12.6% | $8.5 billion | 85 | Commercial lending | FDIC |
| 138 | Amerant Bank | Coral Gables, FL | $10.3 billion | −0.4% | $8.4 billion | 24 | Commercial lending | FDIC |
| 139 | International Bank of Commerce | Laredo, TX | $10.2 billion | +4.8% | $6.6 billion | 80 | Commercial lending | FDIC |
| 140 | Origin Bank | Choudrant, LA | $10.2 billion | +6.2% | $8.7 billion | 59 | Commercial lending | FDIC |
Download this table (CSV), free. The full dataset, every bank in the band with its assets a year earlier, specialization, holding company and identifiers, is one email away.
‡ Closed after June 30, 2026: Webster Bank on August 20, 2026; Stellar Bank on July 1, 2026. Each is ranked on the figures it filed for June 30, 2026.
◊ Absorbed another bank's charter in the year, according to the FDIC's structure-change history, so the one-year change includes the bank it took in: Pinnacle Bank (Synovus Bank); Columbia Bank (Pacific Premier Bank); Associated Bank (American National Bank); Prosperity Bank (American Bank, Texas Partners Bank); Commerce Bank (FineMark National Bank & Trust); First National Bank of Omaha (Country Club Bank); Glacier Bank (Guaranty Bank & Trust); Eastern Bank (HarborOne Bank); Rockland Trust Company (Enterprise Bank and Trust Company); Centennial Bank (Mountain Commerce Bank); OceanFirst Bank (Flushing Bank); TowneBank (The Old Point National Bank of Phoebus, Dogwood State Bank); First Financial Bank (Westfield Bank, FSB, BankFinancial); Beacon Bank and Trust (Bank Rhode Island, Berkshire Bank, PCSB Bank); Seacoast National Bank (Heartland National Bank, Citizens First Bank); First Merchants Bank (First Savings Bank); Mechanics Bank (HomeStreet Bank); Citizens Business Bank (Heritage Bank of Commerce); Community Bank (ClearPoint Federal Bank & Trust); Northwest Bank (Jersey Shore State Bank, The Luzerne Bank); FirstBank (Southern States Bank); Sunflower Bank (First Foundation Bank); Nicolet National Bank (MidWestOne Bank); BancFirst (American Bank of Oklahoma); The Park National Bank (First Citizens National Bank); NBH Bank (Vista Bank); Burke & Herbert Bank & Trust Company (LINKBANK); Stock Yards Bank & Trust Company (Field & Main Bank).
Which banks entered and left the band
According to FDIC data, 141 banks were in the band on June 30, 2025 and 140 are in it on June 30, 2026. In between, 14 left it and 13 entered it. The table accounts for every one of them, from each bank's Call Reports and the FDIC's structure-change history.
| Banks | Which | Source | |
|---|---|---|---|
| In the band on June 30, 2025 | 141 | FDIC QBP | |
| Left: grew past $250 billion | 5 | The Huntington National Bank, Fifth Third Bank, Morgan Stanley Bank, Morgan Stanley Private Bank and Charles Schwab Bank, SSB | FDIC |
| Left: absorbed by another bank | 8 | Synovus Bank (into Pinnacle Bank), Comerica Bank (into Fifth Third Bank), Cadence Bank (into The Huntington National Bank), FirstBank (into PNC Bank), Berkshire Bank (into Beacon Bank and Trust), Pacific Premier Bank (into Columbia Bank), Veritex Community Bank (into The Huntington National Bank) and First Foundation Bank (into Sunflower Bank) | FDIC |
| Left: fell below $10 billion | 1 | EagleBank | FDIC |
| Entered: grew past $10 billion | 13 | Beacon Bank and Trust, Sunflower Bank, Nicolet National Bank, The Park National Bank, NBH Bank, Burke & Herbert Bank & Trust Company, WEX Bank, Charles Schwab Trust Bank, Centier Bank, Amarillo National Bank, Stock Yards Bank & Trust Company, International Bank of Commerce and Origin Bank | FDIC |
| In the band on June 30, 2026 | 140 | FDIC QBP |
Because the band's bounds are fixed amounts, its membership changes even in a year without a merger: a bank that grows moves up into it or out of it.
Where the band's banks are headquartered
Texas and Utah are headquarters to more of the band's banks than any other state, 12 each, according to FDIC data. The banks in the band are headquartered in 39 states and territories. Those headquartered in Utah hold the most assets, $888 billion across 12 banks, according to the FDIC; 9 of those are not commercial lending specialists in the FDIC's classification.
| Headquarters state | Banks in the band | Share of the band's banks | Their total assets | Source |
|---|---|---|---|---|
| Texas | 12 | 9% | $257 billion | FDIC |
| Utah | 12 | 9% | $888 billion | FDIC |
| California | 10 | 7% | $360 billion | FDIC |
| New York | 10 | 7% | $461 billion | FDIC |
| Pennsylvania | 8 | 6% | $207 billion | FDIC |
| Florida | 7 | 5% | $257 billion | FDIC |
| Missouri | 6 | 4% | $179 billion | FDIC |
| New Jersey | 5 | 4% | $142 billion | FDIC |
| Virginia | 5 | 4% | $278 billion | FDIC |
| Arkansas | 4 | 3% | $119 billion | FDIC |
A headquarters state is where a bank's main office is chartered, not where it lends or takes deposits.
A size band is not a business model
According to the FDIC's classification, 105 of the 140 banks in the band are commercial lending specialists. Ten are specialists the FDIC classes as credit card, consumer lending or international banks: American Express National Bank, Ally Bank, The Northern Trust Company, Synchrony Bank, SoFi Bank, Barclays Bank Delaware, Sallie Mae Bank, Comenity Capital Bank, BMW Bank of North America and Happen Bank. They are ranked here because they are this size; whether they count as regional banks depends on what the reader means by the word.
The band's bounds are the FDIC's. Other sources draw the lines elsewhere, and some apply them to holding companies rather than to bank charters, so a list of "regional banks" from another source can differ from this one.
What this means for technology buyers
Banks in this band often buy systems built for large banks while running smaller technology teams than the largest ones, and a bank that has just absorbed another, as 28 in the table did in the year according to the FDIC, is also running a conversion. These guides compare the options side by side:
- Mobile banking apps for regional banks: digital channel platforms for banks between community and money-center scale.
- CRM for commercial banking teams: relationship management for the commercial lending most banks in the band specialize in.
- Financial BI and dashboarding for bank executives: reporting on the balance sheet, by business line and against peers.
- Cloud-based core banking systems: what a move off a legacy core involves, and who can take it on.
Planning the change before choosing the vendor? The Retail Bank Business Capability Model maps what a bank does, from deposits and lending to the commercial relationships a regional bank is built on.
More from Finantrix Atlas
- Largest banks in the US, ranked by total assets
- Largest US bank holding companies
- US bank mergers of the past year
- Fastest-growing US banks
- Largest US commercial and industrial lenders
How this list was built
The universe is every FDIC-insured commercial bank and savings institution that filed a Call Report for June 30, 2026, read from the FDIC's BankFind Suite, including banks whose charter has ended since. A bank is in the band if its total assets on that date are at least $10 billion and less than $250 billion, and no bank's assets sit exactly on either bound. Uninsured filers and insured US branches of foreign banks are left out, as the FDIC's Quarterly Banking Profile leaves them out.
The FDIC's Quarterly Banking Profile prints, for every quarter, the number of institutions in its $10 billion to $250 billion group and their share of industry assets. On June 30, 2026 and on June 30, 2025, the band here has the same number of banks and the same share, to the two decimals the QBP prints, and the whole universe sums to the QBP's total assets and deposits.
The Federal Reserve Board publishes the same quarter's figures for insured commercial banks in its Large Commercial Banks release. Each of the 123 commercial banks in the band appears there with the same consolidated assets, to the million dollars it publishes, and in the same order. The other 17 are savings institutions or banks the FDIC does not insure as commercial banks, which the release does not cover.
Movement in and out of the band compares each bank's Call Report for June 30, 2025 with its report for June 30, 2026. A bank that stopped filing is matched to the FDIC's structure-change history, which name the bank that absorbed it.
Limits
- Banks, not holding companies. A holding company that owns a bank in the band and another above or below it appears once per charter, and its nonbank businesses are not counted.
- A size band, not a definition. The band includes card banks, consumer lenders and a trust bank, marked by their FDIC specialization, and excludes regional banks just under $10 billion.
- Total assets are one measure of size. Deposits and offices are shown beside them. A bank with a large securities or card book can rank above one with a wider branch network.
- A year's change includes mergers. Banks marked ◊ absorbed another charter during the year, so their change is not growth from their own business alone; the fastest-growing banks page separates the two.
- Two quarters. The dates of the data are June 30, 2025 and June 30, 2026. A merger or a quarter's growth can move a bank across a bound between filings.
Cite this
Free to quote, cite and republish, including the chart, with credit to Finantrix Atlas and a link to this page.
The 140 US banks with $10 billion to $250 billion in assets hold 22.9% of FDIC-insured bank assets, down from 27.8% a year earlier, according to a Finantrix Atlas analysis of June 30, 2026 FDIC data.
First-Citizens Bank & Trust Company is the largest US bank with $10 billion to $250 billion in assets, with $236 billion, according to Finantrix Atlas, from FDIC Call Reports.
Suggested citation: Finantrix Atlas, "Largest US Regional Banks," data as of June 30, 2026, from FDIC Call Reports and the FDIC Quarterly Banking Profile. https://www.finantrix.com/articles/largest-regional-banks
Embed the chart:
<a href="https://www.finantrix.com/articles/largest-regional-banks"><img src="https://www.finantrix.com/atlas/largest-regional-banks.png" alt="The largest US regional banks by total assets, from FDIC data, by Finantrix Atlas"></a>
<p>Chart: <a href="https://www.finantrix.com/articles/largest-regional-banks">Finantrix Atlas</a>, from FDIC Call Reports.</p>
Frequently asked questions
Q: What is the largest regional bank in the US? A: Among FDIC-insured banks with $10 billion to $250 billion in assets, First-Citizens Bank & Trust Company is the largest, with $236 billion on June 30, 2026, according to its Call Report filed with the FDIC.
Q: How many regional banks are there in the US? A: 140 FDIC-insured banks had $10 billion to $250 billion in total assets on June 30, 2026, according to the FDIC, out of 4,238 insured banks.
Q: What counts as a regional bank? A: There is more than one usage. This page uses the band of the FDIC's $10 billion to $250 billion asset-size group, applied to bank charters. Other sources draw different lines or apply them to holding companies.
Q: How much of US banking do regional banks hold? A: Banks with $10 billion to $250 billion in assets hold 22.9% of FDIC-insured bank assets, or $6.07 trillion, according to FDIC data for June 30, 2026.
Q: Why did regional banks' share of bank assets fall? A: Mostly because banks left the band at the top. According to FDIC data, 5 banks grew past $250 billion in the year and 4 were absorbed into banks now above it; a year earlier they held 5.2% of insured bank assets.
Download the data
The 140 rows on this page (CSV), free. The full dataset has all 140 rows, as of June 30, 2026; we email you a link.
Frequently Asked Questions
What is the largest regional bank in the US?
Among FDIC-insured banks with $10 billion to $250 billion in assets, First-Citizens Bank & Trust Company is the largest, with $236 billion on June 30, 2026, according to its Call Report filed with the FDIC.
How many regional banks are there in the US?
140 FDIC-insured banks had $10 billion to $250 billion in total assets on June 30, 2026, according to the FDIC, out of 4,238 insured banks.
What counts as a regional bank?
There is more than one usage. This page uses the band of the FDIC's $10 billion to $250 billion asset-size group, applied to bank charters. Other sources draw different lines or apply them to holding companies.
How much of US banking do regional banks hold?
Banks with $10 billion to $250 billion in assets hold 22.9% of FDIC-insured bank assets, or $6.07 trillion, according to FDIC data for June 30, 2026.
Why did regional banks' share of bank assets fall?
Mostly because banks left the band at the top. According to FDIC data, 5 banks grew past $250 billion in the year and 4 were absorbed into banks now above it; a year earlier they held 5.2% of insured bank assets.