
Key Takeaways
- Cards made up 79.3% of US noncash payments by number in 2024 but 8.2% by value, according to the Federal Reserve Payments Study.
- ACH carried 74.3% of the value of US noncash payments in 2024, $104.06 trillion, according to the Federal Reserve.
- From 2021 to 2024, credit card payments grew by 16.2 billion and debit card payments by 13.8 billion, according to the Federal Reserve.
- Checks fell to 9.2 billion payments in 2024, from 42.6 billion in 2000, according to Federal Reserve Payments Study estimates.
Cards made up 79.3% of US noncash payments by number in 2024 but only 8.2% of their value, according to the Federal Reserve Payments Study. ACH carried 74.3% of the value, $104.06 trillion. In all, consumers, businesses and governments in the US made 236.6 billion noncash payments worth $140.01 trillion in 2024, according to the Federal Reserve. Checks fell to 9.2 billion payments, from 42.6 billion in 2000, according to the Fed's estimates.
Every figure here is the Federal Reserve's own estimate, from the national top-line data of the Federal Reserve Payments Study released in July 2026. Finantrix Atlas computed the shares and the differences between years from the Fed's lines; nothing is estimated or projected beyond what the Fed publishes.
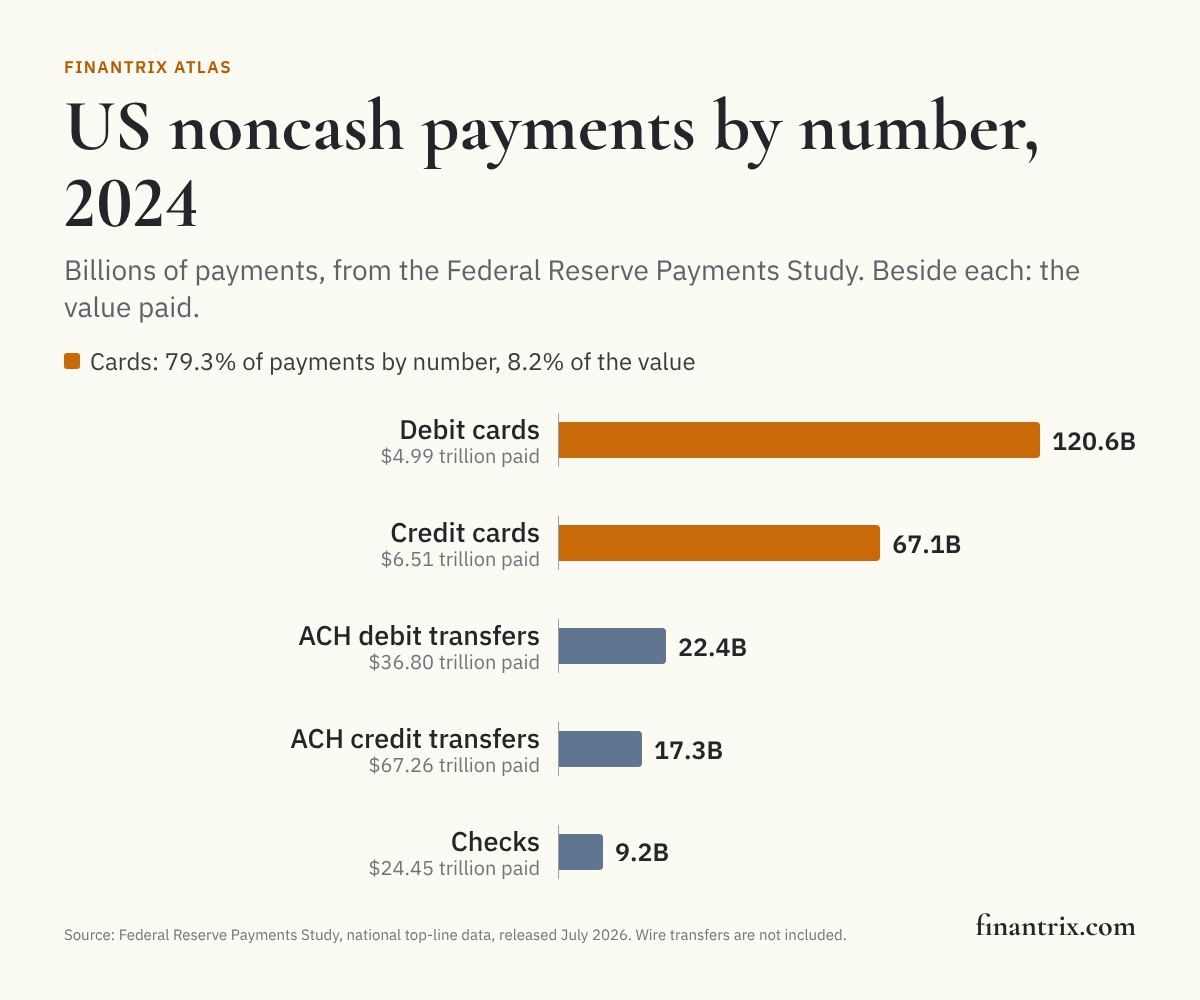 credit cards 67.1 billion, then ACH transfers and checks">
Payments by number
The number of US noncash payments by type in each year the Fed's table covers, in billions, with the Fed's compound annual growth rate from 2021 to 2024.
| Payment type | 2015 (billions) | 2018 (billions) | 2021 (billions) | 2024 (billions) | Growth a year, 2021-24 | Source |
|---|---|---|---|---|---|---|
| All noncash payments | 142.4 | 172.6 | 204.8 | 236.6 | 4.9% | Federal Reserve |
| Cards | 101.5 | 131.2 | 157.7 | 187.7 | 6.0% | Federal Reserve |
| Debit cards | 67.8 | 86.6 | 106.7 | 120.6 | 4.1% | Federal Reserve |
| Credit cards | 33.7 | 44.6 | 51.0 | 67.1 | 9.6% | Federal Reserve |
| ACH | 23.9 | 28.0 | 36.0 | 39.7 | 3.3% | Federal Reserve |
| ACH credit transfers | 10.2 | 12.2 | 16.9 | 17.3 | 0.7% | Federal Reserve |
| ACH debit transfers | 13.7 | 15.8 | 19.1 | 22.4 | 5.4% | Federal Reserve |
| Checks | 17.0 | 13.5 | 11.0 | 9.2 | -5.9% | Federal Reserve |
| ATM cash withdrawals (not a noncash payment) | 5.2 | 4.7 | 3.8 | 3.4 | -3.2% | Federal Reserve |
Payments by value
The value of the same payments in trillions of dollars, with the average payment in 2024, all according to the Federal Reserve.
| Payment type | 2015 ($ trillions) | 2018 ($ trillions) | 2021 ($ trillions) | 2024 ($ trillions) | Average payment, 2024 | Growth a year, 2021-24 | Source |
|---|---|---|---|---|---|---|---|
| All noncash payments | 83.99 | 96.26 | 129.63 | 140.01 | $592 | 2.6% | Federal Reserve |
| Cards | 5.52 | 7.07 | 9.43 | 11.50 | $61 | 6.8% | Federal Reserve |
| Debit cards | 2.47 | 3.10 | 4.56 | 4.99 | $41 | 3.1% | Federal Reserve |
| Credit cards | 3.05 | 3.97 | 4.87 | 6.51 | $97 | 10.1% | Federal Reserve |
| ACH | 52.42 | 64.17 | 93.83 | 104.06 | $2,622 | 3.5% | Federal Reserve |
| ACH credit transfers | 33.13 | 42.04 | 62.56 | 67.26 | $3,881 | 2.4% | Federal Reserve |
| ACH debit transfers | 19.29 | 22.13 | 31.28 | 36.80 | $1,647 | 5.6% | Federal Reserve |
| Checks | 26.05 | 25.02 | 26.37 | 24.45 | $2,653 | -2.5% | Federal Reserve |
| ATM cash withdrawals (not a noncash payment) | 0.70 | 0.72 | 0.76 | 0.72 | $210 | -2.0% | Federal Reserve |
Download this table (CSV), free: every line of the Fed's table, including prepaid, private-label and on-us payments, for each year. The full dataset, which adds the Fed's trend series by year back to 2000, is one email away.
Where the number and the value part ways
A card payment is small and an ACH transfer is large, so the two measures tell different stories. According to the Federal Reserve, the average card payment in 2024 was $61, the average ACH payment $2,622 and the average check $2,653. By number, cards went from 71.3% of noncash payments in 2015 to 79.3% in 2024, according to Fed data; by value, ACH went from 72.4% in 2021 to 74.3%.
| Payment type | Share by number, 2015 | Share by number, 2024 | Share by value, 2015 | Share by value, 2024 | Source |
|---|---|---|---|---|---|
| Cards | 71.3% | 79.3% | 6.6% | 8.2% | Federal Reserve |
| ACH | 16.8% | 16.8% | 62.4% | 74.3% | Federal Reserve |
| Checks | 11.9% | 3.9% | 31.0% | 17.5% | Federal Reserve |
Credit, debit and checks
According to the Federal Reserve, debit cards were the most used payment type, with 120.6 billion payments in 2024, 64.2% of card payments. But credit card payments grew more from 2021 to 2024: by 16.2 billion, against 13.8 billion for debit cards, according to the Fed. In every earlier three-year period since 2006 for which the Fed publishes both, debit cards grew by more.
Checks have fallen at every measurement since 2000, according to the Federal Reserve, to 9.2 billion in 2024, 3.9% of noncash payments by number but 17.5% by value. The average check rose from $1,533 in 2015 to $2,653 in 2024, according to the Fed. ATM cash withdrawals, which are not noncash payments, fell from 5.2 billion in 2015 to 3.4 billion in 2024, according to the Federal Reserve, which reports them alongside.
The longer series
The Fed's trend figures, by number of payments in billions, for every year the Fed estimated. The Fed estimates noncash payments every three years, and card payments in some years between; a year the Fed did not estimate is "not published" here, not a value drawn between two others.
| Year | Checks (billions) | ACH debit transfers (billions) | ACH credit transfers (billions) | Credit cards (billions) | Non-prepaid debit cards (billions) | Prepaid debit cards (billions) | Source |
|---|---|---|---|---|---|---|---|
| 2000 | 42.6 | 2.1 | 3.9 | 15.6 | 8.3 | not published | Federal Reserve |
| 2003 | 38.6 | 4.2 | 4.6 | 19.0 | 15.6 | not published | Federal Reserve |
| 2006 | 32.2 | 8.7 | 6.0 | 21.7 | 25.0 | 3.3 | Federal Reserve |
| 2009 | 25.8 | 11.4 | 7.7 | 21.6 | 37.9 | 6.0 | Federal Reserve |
| 2012 | 19.7 | 12.1 | 8.6 | 26.8 | 47.3 | 9.3 | Federal Reserve |
| 2015 | 17.0 | 13.7 | 10.2 | 33.7 | 56.6 | 11.2 | Federal Reserve |
| 2016 | not published | not published | not published | 37.2 | 60.4 | 11.8 | Federal Reserve |
| 2017 | not published | not published | not published | 40.7 | 66.8 | 13.1 | Federal Reserve |
| 2018 | 13.5 | 15.8 | 12.2 | 44.6 | 72.7 | 13.9 | Federal Reserve |
| 2019 | not published | not published | not published | 46.9 | 76.8 | 14.3 | Federal Reserve |
| 2020 | not published | not published | not published | 42.2 | 76.2 | 16.6 | Federal Reserve |
| 2021 | 11.0 | 19.1 | 16.9 | 51.0 | 87.8 | 18.9 | Federal Reserve |
| 2022 | not published | not published | not published | 58.6 | 89.1 | 18.0 | Federal Reserve |
| 2024 | 9.2 | 22.4 | 17.3 | 67.1 | 99.3 | 21.3 | Federal Reserve |
What this means for technology buyers
The split between number and value is the split between two kinds of system. Card and consumer payment volume is high-count and low-value, where cost per transaction and fraud screening at scale decide the economics; ACH and checks carry the value, where exception handling, reconciliation and the move to faster settlement matter more. These guides compare the options side by side:
- Real-time payments platforms: the instant rails a bank connects to alongside ACH.
- Payment gateway solutions for banks: card and account payment acceptance.
- SWIFT messaging migration tools: the move to the new payment messaging standard.
- AML transaction monitoring for banks and fintechs: screening payment flows as they move faster.
Mapping the business? The Payments Industry Capability Model maps what a payments business does, from acceptance and clearing to settlement.
More from Finantrix Atlas
- FedNow participants
- Largest card-issuing banks
- CFPB complaints about digital payments
- Digital payments adoption around the world
How this list was built
Every figure is read from the Excel data tables of the Federal Reserve Payments Study's newest national top-line release, found from the study's own page: the main table for 2015, 2018, 2021 and 2024, and the two trend figures for the longer series.
The table was checked against itself and against the Fed's other copies. Every total equals the sum of its parts in every year, by number and by value, within the rounding the Fed's own note allows; every average equals value divided by number; every growth rate the Fed prints was reproduced. The trend figures carry the table's figures for the same years, and the table printed on the release page matches the workbook at the precision it prints. The shares this page leads with round to the whole percents the Fed states in its key findings.
Limits
- No instant payments and no wires. The Fed's top-line release covers cards, ACH and checks. According to the release, wire transfers are excluded, and the table has no line for instant payment services, so this page cannot say how fast they are growing. FedNow's participants are on their own page.
- Estimates, every three years. The FRPS estimates national totals from surveys of depository institutions, networks, processors and issuers, as the Fed describes it, and it measures noncash payments every three years. Card payments are also estimated in some years between.
- Payments, not people. These are counts and values of payments, not of payers: they say nothing about who pays which way, or about cash, which the Fed measures only through ATM withdrawals here.
- A first release. The Fed calls this an initial data release and says more detail on 2024 will follow in future releases.
- Data date. Calendar year 2024, from the release of July 2026.
Cite this
Free to quote, cite and republish, including the chart, with credit to Finantrix Atlas and a link to this page.
Cards made up 79.3% of US noncash payments by number in 2024 but 8.2% by value, while ACH carried 74.3% of the value, according to a Finantrix Atlas analysis of the Federal Reserve Payments Study.
US check payments fell to 9.2 billion in 2024, from 42.6 billion in 2000, according to Federal Reserve Payments Study estimates compiled by Finantrix Atlas.
Suggested citation: Finantrix Atlas, "How Americans Pay: Card, ACH and Check," 2024 data, from the Federal Reserve Payments Study, released July 2026. https://www.finantrix.com/articles/us-payments-volumes
Embed the chart:
<a href="https://www.finantrix.com/articles/us-payments-volumes"><img src="https://www.finantrix.com/atlas/us-payments-volumes.png" alt="US noncash payments by number and type, from Federal Reserve data, by Finantrix Atlas"></a>
<p>Chart: <a href="https://www.finantrix.com/articles/us-payments-volumes">Finantrix Atlas</a>, from the Federal Reserve Payments Study.</p>
Frequently asked questions
Q: How do Americans pay most often? A: By debit card. According to the Federal Reserve Payments Study, there were 120.6 billion debit card payments in 2024, more than any other noncash payment type, and cards of all kinds made up 79.3% of noncash payments by number.
Q: Which payment method moves the most money in the US? A: ACH. According to the Federal Reserve, ACH payments were worth $104.06 trillion in 2024, 74.3% of the value of all noncash payments.
Q: How many checks do Americans write? A: The Federal Reserve estimates 9.2 billion check payments in 2024, down from 42.6 billion in 2000, with an average value of $2,653.
Q: Are credit card payments growing faster than debit? A: From 2021 to 2024, yes: credit card payments grew by 16.2 billion and debit card payments by 13.8 billion, according to the Federal Reserve. Debit cards still accounted for 64.2% of card payments, according to the Fed.
Download the data
The 104 rows on this page (CSV), free. The full dataset has all 171 rows, as of December 31, 2024; we email you a link.
Frequently Asked Questions
How do Americans pay most often?
By debit card. According to the Federal Reserve Payments Study, there were 120.6 billion debit card payments in 2024, more than any other noncash payment type, and cards of all kinds made up 79.3% of noncash payments by number.
Which payment method moves the most money in the US?
ACH. According to the Federal Reserve, ACH payments were worth $104.06 trillion in 2024, 74.3% of the value of all noncash payments.
How many checks do Americans write?
The Federal Reserve estimates 9.2 billion check payments in 2024, down from 42.6 billion in 2000, with an average value of $2,653.
Are credit card payments growing faster than debit?
From 2021 to 2024, yes: credit card payments grew by 16.2 billion and debit card payments by 13.8 billion, according to the Federal Reserve. Debit cards still accounted for 64.2% of card payments, according to the Fed.