
Key Takeaways
- In 108 of 136 economies, the three largest commercial banks held more than half of commercial bank assets in 2021, according to the World Bank.
- The United States was among the least concentrated: its three largest commercial banks held 38.4%, and only seven economies had a lower share, in World Bank data.
- The median economy's three largest banks held 67.7% of commercial bank assets in 2021, according to the World Bank's Global Financial Development Database.
- 2021 is the latest year the World Bank has published; the database has not been updated since September 2022, and its successor carries no concentration indicator.
In 108 of the 136 economies with a figure for 2021, the three largest commercial banks held more than half of all commercial bank assets, according to the World Bank's Global Financial Development Database. The United States was among the least concentrated: its three largest commercial banks held 38.4%, and only seven economies had a lower share. In the median economy the three largest held 67.7%, according to the World Bank. 2021 is the latest year the World Bank has published: the database was last updated in September 2022.
These are the World Bank's own figures, computed by the World Bank from bank-by-bank data and published for each economy. Finantrix Atlas ranked the economies and computed the medians, the regional summary and the changes since 2015.
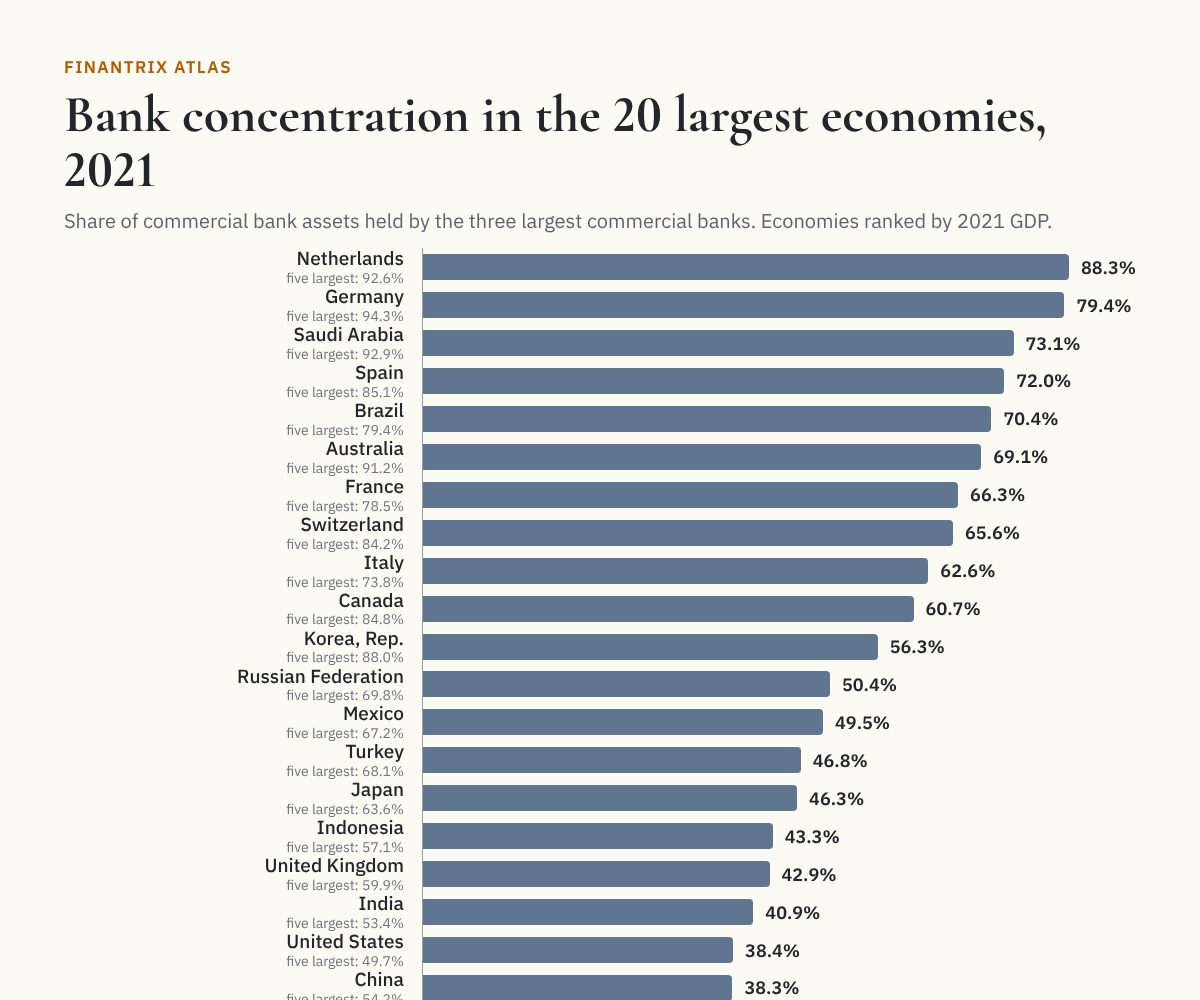
The 20 largest economies
The 20 economies with the largest GDP in 2021, in current US dollars from the World Bank's World Development Indicators, among those with a concentration figure. According to the World Bank, the three largest commercial banks held more than half of commercial bank assets in 12 of them.
| Economy | Three largest banks' share | Five largest banks' share | Change since 2015 (points) | Source |
|---|---|---|---|---|
| Netherlands | 88.3% | 92.6% | +8.6 | World Bank |
| Germany | 79.4% | 94.3% | +2.2 | World Bank |
| Saudi Arabia | 73.1% | 92.9% | +18.3 | World Bank |
| Spain | 72.0% | 85.1% | +13.6 | World Bank |
| Brazil | 70.4% | 79.4% | −3.5 | World Bank |
| Australia | 69.1% | 91.2% | −0.8 | World Bank |
| France | 66.3% | 78.5% | +0.8 | World Bank |
| Switzerland | 65.6% | 84.2% | −12.4 | World Bank |
| Italy | 62.6% | 73.8% | +1.1 | World Bank |
| Canada | 60.7% | 84.8% | −0.4 | World Bank |
| Korea, Rep. | 56.3% | 88.0% | −7.8 | World Bank |
| Russian Federation | 50.4% | 69.8% | −4.5 | World Bank |
| Mexico | 49.5% | 67.2% | −2.7 | World Bank |
| Turkey | 46.8% | 68.1% | +7.8 | World Bank |
| Japan | 46.3% | 63.6% | +1.8 | World Bank |
| Indonesia | 43.3% | 57.1% | +3.5 | World Bank |
| United Kingdom | 42.9% | 59.9% | −15.0 | World Bank |
| India | 40.9% | 53.4% | +11.3 | World Bank |
| United States | 38.4% | 49.7% | −3.9 | World Bank |
| China | 38.3% | 54.2% | −2.3 | World Bank |
Every economy, ranked
The share of commercial bank assets held by the three largest commercial banks in 2021, from the most concentrated to the least, with the World Bank's five-bank figure beside it and the change since 2015 in percentage points.
| Rank | Economy | Region (World Bank) | Three largest banks' share | Five largest banks' share | Change since 2015 (points) | Source |
|---|---|---|---|---|---|---|
| 1 | Barbados § | Latin America & Caribbean | 100.0% | not published | +0.0 | World Bank |
| 2 | Fiji § | East Asia & Pacific | 100.0% | not published | +18.4 | World Bank |
| 3 | Iceland § | Europe & Central Asia | 100.0% | not published | +7.2 | World Bank |
| 4 | Lesotho § | Sub-Saharan Africa | 100.0% | not published | +3.2 | World Bank |
| 5 | Liberia § | Sub-Saharan Africa | 100.0% | not published | +5.5 | World Bank |
| 6 | Malawi § | Sub-Saharan Africa | 100.0% | not published | +28.7 | World Bank |
| 7 | Lebanon § | Middle East & North Africa | 99.7% | not published | +59.4 | World Bank |
| 8 | Namibia § | Sub-Saharan Africa | 98.8% | not published | +14.5 | World Bank |
| 9 | Lithuania § | Europe & Central Asia | 98.7% | not published | +7.4 | World Bank |
| 10 | North Macedonia § | Europe & Central Asia | 97.4% | not published | +33.7 | World Bank |
| 11 | Bermuda | North America | 96.6% | 99.6% | −0.1 | World Bank |
| 12 | Qatar § | Middle East & North Africa | 96.6% | not published | +7.3 | World Bank |
| 13 | Bhutan § | South Asia | 92.9% | not published | −1.6 | World Bank |
| 14 | Finland | Europe & Central Asia | 92.6% | 95.9% | −1.1 | World Bank |
| 15 | Trinidad and Tobago § | Latin America & Caribbean | 92.6% | not published | −7.4 | World Bank |
| 16 | Greece | Europe & Central Asia | 92.4% | 98.1% | −5.8 | World Bank |
| 17 | Estonia | Europe & Central Asia | 91.4% | 99.3% | −0.9 | World Bank |
| 18 | Myanmar | East Asia & Pacific | 91.0% | 100.0% | −5.4 | World Bank |
| 19 | Sweden | Europe & Central Asia | 89.6% | 93.2% | −2.5 | World Bank |
| 20 | Malta | Middle East & North Africa | 89.4% | 97.6% | −1.2 | World Bank |
| 21 | Curaçao | Latin America & Caribbean | 88.4% | 100.0% | −1.3 | World Bank |
| 22 | Netherlands | Europe & Central Asia | 88.3% | 92.6% | +8.6 | World Bank |
| 23 | Tajikistan | Europe & Central Asia | 85.9% | 99.6% | +3.7 | World Bank |
| 24 | Haiti | Latin America & Caribbean | 85.6% | 97.4% | +5.3 | World Bank |
| 25 | Mongolia | East Asia & Pacific | 85.1% | 99.1% | +6.3 | World Bank |
| 26 | Cyprus | Europe & Central Asia | 84.8% | 91.4% | +8.2 | World Bank |
| 27 | Venezuela, RB | Latin America & Caribbean | 84.5% | 92.5% | not published | World Bank |
| 28 | Georgia | Europe & Central Asia | 84.3% | 91.1% | +12.0 | World Bank |
| 29 | Nicaragua | Latin America & Caribbean | 84.0% | 99.6% | −10.7 | World Bank |
| 30 | Jamaica | Latin America & Caribbean | 83.4% | 96.5% | +14.7 | World Bank |
| 31 | Montenegro | Europe & Central Asia | 83.2% | 98.1% | +31.2 | World Bank |
| 32 | Kuwait | Middle East & North Africa | 82.3% | 99.7% | +1.5 | World Bank |
| 33 | Bahrain | Middle East & North Africa | 82.0% | 98.4% | +2.1 | World Bank |
| 34 | Zimbabwe | Sub-Saharan Africa | 81.8% | 100.0% | +25.1 | World Bank |
| 35 | Denmark | Europe & Central Asia | 81.8% | 89.9% | −2.2 | World Bank |
| 36 | Singapore | East Asia & Pacific | 80.8% | 92.2% | −6.4 | World Bank |
| 37 | Tanzania | Sub-Saharan Africa | 80.5% | 91.5% | +32.3 | World Bank |
| 38 | South Africa | Sub-Saharan Africa | 79.4% | 99.3% | +0.8 | World Bank |
| 39 | Germany | Europe & Central Asia | 79.4% | 94.3% | +2.2 | World Bank |
| 40 | Slovak Republic | Europe & Central Asia | 78.9% | 99.1% | +11.3 | World Bank |
| 41 | Mozambique | Sub-Saharan Africa | 78.7% | 92.5% | +1.5 | World Bank |
| 42 | Dominican Republic | Latin America & Caribbean | 78.1% | 88.2% | +4.7 | World Bank |
| 43 | Burundi | Sub-Saharan Africa | 78.0% | 100.0% | −13.9 | World Bank |
| 44 | Macao SAR, China | East Asia & Pacific | 76.5% | 92.2% | −1.9 | World Bank |
| 45 | Botswana | Sub-Saharan Africa | 75.8% | 94.2% | +11.1 | World Bank |
| 46 | Israel | Middle East & North Africa | 75.8% | 94.5% | −6.3 | World Bank |
| 47 | Latvia | Europe & Central Asia | 74.6% | 89.9% | −14.2 | World Bank |
| 48 | Egypt, Arab Rep. | Middle East & North Africa | 74.5% | 84.2% | +18.7 | World Bank |
| 49 | El Salvador | Latin America & Caribbean | 74.4% | 87.3% | −7.7 | World Bank |
| 50 | Albania | Europe & Central Asia | 74.0% | 87.9% | +8.7 | World Bank |
| 51 | Colombia | Latin America & Caribbean | 73.8% | 90.2% | +9.3 | World Bank |
| 52 | Ireland | Europe & Central Asia | 73.8% | 86.1% | +5.7 | World Bank |
| 53 | Cabo Verde | Sub-Saharan Africa | 73.6% | 93.9% | −11.2 | World Bank |
| 54 | United Arab Emirates | Middle East & North Africa | 73.2% | 85.2% | +19.2 | World Bank |
| 55 | Saudi Arabia | Middle East & North Africa | 73.1% | 92.9% | +18.3 | World Bank |
| 56 | Guyana | Latin America & Caribbean | 72.9% | 97.0% | +0.8 | World Bank |
| 57 | Uruguay | Latin America & Caribbean | 72.8% | 89.3% | −0.1 | World Bank |
| 58 | Spain | Europe & Central Asia | 72.0% | 85.1% | +13.6 | World Bank |
| 59 | Moldova | Europe & Central Asia | 70.6% | 90.2% | +1.6 | World Bank |
| 60 | Peru | Latin America & Caribbean | 70.6% | 87.6% | −2.4 | World Bank |
| 61 | Brazil | Latin America & Caribbean | 70.4% | 79.4% | −3.5 | World Bank |
| 62 | Australia | East Asia & Pacific | 69.1% | 91.2% | −0.8 | World Bank |
| 63 | Belarus | Europe & Central Asia | 68.9% | 85.8% | +8.9 | World Bank |
| 64 | Portugal | Europe & Central Asia | 68.9% | 95.1% | +3.1 | World Bank |
| 65 | Angola | Sub-Saharan Africa | 68.4% | 82.3% | +13.5 | World Bank |
| 66 | Côte d'Ivoire | Sub-Saharan Africa | 68.3% | 91.6% | +23.9 | World Bank |
| 67 | Azerbaijan | Europe & Central Asia | 68.2% | 77.7% | +5.4 | World Bank |
| 68 | Belgium | Europe & Central Asia | 68.0% | 88.3% | +7.6 | World Bank |
| 69 | Romania | Europe & Central Asia | 67.4% | 84.0% | +1.7 | World Bank |
| 70 | Uganda | Sub-Saharan Africa | 67.3% | 88.5% | +22.3 | World Bank |
| 71 | Croatia | Europe & Central Asia | 66.8% | 85.9% | +2.5 | World Bank |
| 72 | Morocco | Middle East & North Africa | 66.5% | 84.3% | −1.2 | World Bank |
| 73 | Slovenia | Europe & Central Asia | 66.5% | 82.9% | +12.0 | World Bank |
| 74 | France | Europe & Central Asia | 66.3% | 78.5% | +0.8 | World Bank |
| 75 | Zambia | Sub-Saharan Africa | 65.9% | 91.4% | +19.5 | World Bank |
| 76 | Switzerland | Europe & Central Asia | 65.6% | 84.2% | −12.4 | World Bank |
| 77 | Afghanistan | South Asia | 65.1% | 83.1% | +11.7 | World Bank |
| 78 | Austria | Europe & Central Asia | 64.8% | 81.9% | −4.9 | World Bank |
| 79 | Guatemala | Latin America & Caribbean | 64.7% | 81.0% | −1.9 | World Bank |
| 80 | Bulgaria | Europe & Central Asia | 64.0% | 89.7% | +7.6 | World Bank |
| 81 | Oman | Middle East & North Africa | 63.9% | 84.9% | −5.5 | World Bank |
| 82 | Ukraine | Europe & Central Asia | 63.6% | 78.3% | +23.1 | World Bank |
| 83 | Czech Republic | Europe & Central Asia | 63.2% | 76.0% | +2.0 | World Bank |
| 84 | Jordan | Middle East & North Africa | 63.1% | 75.0% | −4.0 | World Bank |
| 85 | Lao PDR | East Asia & Pacific | 63.1% | 82.9% | −12.8 | World Bank |
| 86 | Italy | Europe & Central Asia | 62.6% | 73.8% | +1.1 | World Bank |
| 87 | Hong Kong SAR, China | East Asia & Pacific | 62.5% | 73.3% | +0.9 | World Bank |
| 88 | Rwanda | Sub-Saharan Africa | 62.2% | 77.3% | +4.2 | World Bank |
| 89 | Honduras | Latin America & Caribbean | 61.7% | 80.8% | +6.9 | World Bank |
| 90 | Hungary | Europe & Central Asia | 60.9% | 80.3% | −25.8 | World Bank |
| 91 | Canada | North America | 60.7% | 84.8% | −0.4 | World Bank |
| 92 | Bahamas, The | Latin America & Caribbean | 60.4% | 80.2% | −5.2 | World Bank |
| 93 | Kazakhstan | Europe & Central Asia | 60.3% | 76.0% | +8.3 | World Bank |
| 94 | Uzbekistan | Europe & Central Asia | 59.5% | 79.7% | +13.7 | World Bank |
| 95 | Nigeria | Sub-Saharan Africa | 59.3% | 74.4% | +21.7 | World Bank |
| 96 | Mauritius | Sub-Saharan Africa | 59.1% | 76.9% | +12.5 | World Bank |
| 97 | Sri Lanka | South Asia | 57.7% | 75.2% | +5.0 | World Bank |
| 98 | New Zealand | East Asia & Pacific | 57.2% | 87.8% | −0.6 | World Bank |
| 99 | Korea, Rep. | East Asia & Pacific | 56.3% | 88.0% | −7.8 | World Bank |
| 100 | Costa Rica | Latin America & Caribbean | 55.9% | 74.7% | −8.8 | World Bank |
| 101 | Ecuador | Latin America & Caribbean | 55.5% | 77.5% | −4.4 | World Bank |
| 102 | Armenia | Europe & Central Asia | 55.2% | 69.8% | +6.4 | World Bank |
| 103 | Malaysia | East Asia & Pacific | 53.0% | 70.1% | +1.5 | World Bank |
| 104 | Philippines | East Asia & Pacific | 52.3% | 67.3% | +6.2 | World Bank |
| 105 | Chile | Latin America & Caribbean | 52.2% | 78.3% | +3.6 | World Bank |
| 106 | Argentina | Latin America & Caribbean | 52.1% | 68.4% | −1.9 | World Bank |
| 107 | Ethiopia | Sub-Saharan Africa | 51.3% | 66.3% | −30.3 | World Bank |
| 108 | Russian Federation | Europe & Central Asia | 50.4% | 69.8% | −4.5 | World Bank |
| 109 | Poland | Europe & Central Asia | 49.9% | 72.7% | +4.5 | World Bank |
| 110 | Kyrgyz Republic | Europe & Central Asia | 49.6% | 68.8% | −3.0 | World Bank |
| 111 | Mexico | Latin America & Caribbean | 49.5% | 67.2% | −2.7 | World Bank |
| 112 | Syrian Arab Republic | Middle East & North Africa | 49.2% | 67.3% | −25.9 | World Bank |
| 113 | Serbia | Europe & Central Asia | 47.7% | 67.5% | −2.9 | World Bank |
| 114 | Turkey | Europe & Central Asia | 46.8% | 68.1% | +7.8 | World Bank |
| 115 | Japan | East Asia & Pacific | 46.3% | 63.6% | +1.8 | World Bank |
| 116 | Thailand | East Asia & Pacific | 44.8% | 68.5% | −0.2 | World Bank |
| 117 | Kenya | Sub-Saharan Africa | 44.8% | 60.0% | +6.4 | World Bank |
| 118 | Tunisia § | Middle East & North Africa | 44.5% | not published | +5.8 | World Bank |
| 119 | Panama | Latin America & Caribbean | 43.8% | 61.0% | +5.2 | World Bank |
| 120 | Cambodia | East Asia & Pacific | 43.5% | 52.7% | +3.0 | World Bank |
| 121 | Bolivia | Latin America & Caribbean | 43.3% | 64.5% | −4.1 | World Bank |
| 122 | Indonesia | East Asia & Pacific | 43.3% | 57.1% | +3.5 | World Bank |
| 123 | Luxembourg | Europe & Central Asia | 43.3% | 57.4% | +5.3 | World Bank |
| 124 | United Kingdom | Europe & Central Asia | 42.9% | 59.9% | −15.0 | World Bank |
| 125 | Bosnia and Herzegovina | Europe & Central Asia | 41.7% | 56.2% | +2.7 | World Bank |
| 126 | Paraguay | Latin America & Caribbean | 41.5% | 60.2% | −9.1 | World Bank |
| 127 | India | South Asia | 40.9% | 53.4% | +11.3 | World Bank |
| 128 | Pakistan | South Asia | 40.6% | 56.0% | −0.6 | World Bank |
| 129 | United States | North America | 38.4% | 49.7% | −3.9 | World Bank |
| 130 | China | East Asia & Pacific | 38.3% | 54.2% | −2.3 | World Bank |
| 131 | Vietnam | East Asia & Pacific | 37.9% | 48.3% | −15.1 | World Bank |
| 132 | Ghana | Sub-Saharan Africa | 32.8% | 50.1% | +3.5 | World Bank |
| 133 | Iraq | Middle East & North Africa | 29.3% | 45.0% | −52.9 | World Bank |
| 134 | Bangladesh | South Asia | 26.8% | 35.2% | −1.8 | World Bank |
| 135 | Taiwan, China | East Asia & Pacific | 25.1% | 38.2% | −4.6 | World Bank |
| 136 | Nepal | South Asia | 17.9% | 27.2% | −1.4 | World Bank |
§ No five-bank figure. The World Bank publishes the five-bank share only when its source covers five or more banks in the economy, so a § row's figure rests on three or four banks. Where such a row shows the three largest at the full share, the source covers no other commercial bank there.
Download this table (CSV), free. The full dataset, every economy with its region, income group, both concentration figures, the 2015 figure and GDP, plus the economies whose latest figure is older than 2021, is one email away.
By region
According to the World Bank's figures, the median three-bank share is highest in Sub-Saharan Africa, at 73.6%, and lowest in South Asia, at 40.9%. Regions are as the World Bank classes each economy in the database.
| Region (World Bank) | Economies with a figure | Median three-bank share | Economies above half | Source |
|---|---|---|---|---|
| Sub-Saharan Africa | 21 | 73.6% | 19 | World Bank |
| Middle East & North Africa | 15 | 73.2% | 12 | World Bank |
| Latin America & Caribbean | 25 | 70.6% | 21 | World Bank |
| Europe & Central Asia | 46 | 68.1% | 39 | World Bank |
| North America | 3 | 60.7% | 2 | World Bank |
| East Asia & Pacific | 19 | 56.3% | 12 | World Bank |
| South Asia | 7 | 40.9% | 3 | World Bank |
What changed since 2015
The World Bank computed these figures from one source, Bureau van Dijk's Orbis, from 2015 on, and from its predecessor, Bankscope, before that, according to the database's own metadata. So change is measured only from 2015, the first year of the same source. Of the 135 economies with a figure in both years, the three-bank share rose in 78 and fell in 56, and was unchanged in one, according to World Bank data; the median change was a rise of 1.8 percentage points. In the United States it went from 42.3% to 38.4%, down 3.9 percentage points, according to the World Bank.
The United States, and the US page
According to the World Bank, the three largest US commercial banks held 38.4% of US commercial bank assets in 2021, and the five largest held 49.7%. Only seven economies had a lower three-bank share: Nepal; Taiwan, China; Bangladesh; Iraq; Ghana; Vietnam; and China.
That figure is not the one on How Concentrated Is US Banking?, and the two should not be compared directly. That page groups every FDIC-insured bank under its holding company and measures each organization's share of all insured bank assets, from FDIC Call Reports. The World Bank's figure counts commercial banks one at a time, unconsolidated, as its source covers them, and divides by the commercial bank assets in that source. Use that page for the US over time; use this one to place the US among other economies on one measure.
What this means for technology buyers
Where three banks hold most of a banking system, a technology vendor selling into that economy meets a handful of large buyers, each with its own procurement; where shares are low, the same product meets many smaller banks with different needs. A bank that works across several of these economies answers to each one's supervisor. These guides compare the options side by side:
- Regulatory reporting platforms for Basel compliance: the reporting stack a bank's supervisor sets the scope of.
- Sanctions screening software for global banks: screening across the many jurisdictions a cross-border bank works in.
- SWIFT messaging migration tools: the move to the new payment messaging standard, for banks that pay across borders.
- Core banking systems for neobanks: the ledger under a new entrant competing with established banks.
Mapping the business? The Retail Bank Business Capability Model maps what a bank does, from taking deposits to moving money.
More from Finantrix Atlas
- How concentrated is US banking?
- Banks supervised by the ECB
- Account ownership around the world
- Digital payments adoption around the world
How this list was built
The universe is every economy with a three-bank concentration figure for 2021 in the World Bank's Global Financial Development Database, read from the workbook the World Bank lists as its latest version (September 2022). No figure is carried forward from an earlier year: an economy without a 2021 figure is not ranked, and its latest figure is in the full dataset with its year.
Every economy-year of both indicators in the workbook was checked against the World Bank's data API, which serves the same series: the two agree on every value, and neither carries a value the other lacks. The 20 largest economies are chosen by GDP in current US dollars for 2021, from World Development Indicators. Taiwan, China has no GDP figure there and is not among them.
The World Bank's GFDD page says the database has evolved into FinData, its updated financial development database. A search of FinData's indicators when this page was built found none for bank concentration, so the September 2022 version remains the World Bank's latest published figure.
Limits
- Old data. 2021 is the newest year, and the database has not been updated since September 2022. Mergers and failures since then are not reflected.
- Commercial banks only, as the source covers them. The share is of commercial bank assets as the World Bank defines the measure, not of all deposit-taking institutions. Where savings banks, cooperative banks or credit unions fall outside that category, a system with many of them can look more concentrated than its whole banking sector.
- Unconsolidated, one bank at a time. Two banks under one owner count as two, so the measure can understate concentration where a group runs several banks.
- A short list behind some figures. According to the World Bank's rule for the five-bank figure, 14 economies have none because its source covers fewer than five banks there, and 6 of them show the three largest at the full share. Both are marked § and kept, because the World Bank publishes them.
- A change of source. The World Bank switched from Bankscope to Orbis in 2015, so change is measured only within the Orbis years.
- What the measure does not show. Concentration is not competition: it says nothing about prices, entry, or how banks in a concentrated system behave.
- Data date. Calendar year 2021, from the September 2022 version of the Global Financial Development Database.
Cite this
Free to quote, cite and republish, including the chart, with credit to Finantrix Atlas and a link to this page.
In 108 of 136 economies, the three largest commercial banks held more than half of commercial bank assets in 2021, according to a Finantrix Atlas analysis of the World Bank's Global Financial Development Database.
The three largest US commercial banks held 38.4% of US commercial bank assets in 2021, one of the lowest shares among 136 economies, according to World Bank data compiled by Finantrix Atlas.
Suggested citation: Finantrix Atlas, "Banking Concentration by Country," 2021 data, from the World Bank, Global Financial Development Database (September 2022 version), licensed under CC BY 4.0. https://www.finantrix.com/articles/bank-concentration-global
Data credit: World Bank, Global Financial Development Database, used under the Creative Commons Attribution 4.0 International license as the World Bank's data licensing terms and its data catalog entry set out; GDP from the World Bank's World Development Indicators. Changes: Finantrix Atlas ranked the economies and computed the medians, regional summary and changes; the shares are as published.
Embed the chart:
<a href="https://www.finantrix.com/articles/bank-concentration-global"><img src="https://www.finantrix.com/atlas/bank-concentration-global.png" alt="Bank concentration in the largest economies, from World Bank data, by Finantrix Atlas"></a>
<p>Chart: <a href="https://www.finantrix.com/articles/bank-concentration-global">Finantrix Atlas</a>, from World Bank Global Financial Development Database data (CC BY 4.0).</p>
Frequently asked questions
Q: Which countries have the most concentrated banking systems? A: In 108 of 136 economies, the three largest commercial banks held more than half of commercial bank assets in 2021, according to the World Bank; the full ranking is in the table above.
Q: How concentrated is US banking compared with other countries? A: Less than almost anywhere else on this measure: the three largest US commercial banks held 38.4% of commercial bank assets in 2021, and only seven economies had a lower share, according to World Bank data.
Q: What does bank concentration measure? A: The share of an economy's commercial bank assets held by its three largest commercial banks, as the World Bank computes it from bank-by-bank data. The World Bank also publishes the share of the five largest, which was 84.2% in the median economy in 2021.
Q: Why is the latest year 2021? A: The World Bank last updated the Global Financial Development Database in September 2022, with data through 2021, and its successor database, FinData, carries no bank concentration indicator.
Download the data
The 136 rows on this page (CSV), free. The full dataset has all 177 rows, as of December 31, 2021; we email you a link.
Frequently Asked Questions
Which countries have the most concentrated banking systems?
In 108 of 136 economies, the three largest commercial banks held more than half of commercial bank assets in 2021, according to the World Bank; the full ranking is in the table above.
How concentrated is US banking compared with other countries?
Less than almost anywhere else on this measure: the three largest US commercial banks held 38.4% of commercial bank assets in 2021, and only seven economies had a lower share, according to World Bank data.
What does bank concentration measure?
The share of an economy's commercial bank assets held by its three largest commercial banks, as the World Bank computes it from bank-by-bank data. The World Bank also publishes the share of the five largest, which was 84.2% in the median economy in 2021.
Why is the latest year 2021?
The World Bank last updated the Global Financial Development Database in September 2022, with data through 2021, and its successor database, FinData, carries no bank concentration indicator.