
Key Takeaways
- According to FDIC and Census Bureau data, North Dakota has the most bank branches per resident, 48.8 full-service branches per 100,000 people, and Nevada the fewest, 11.8.
- Nationally there are 21.5 full-service bank branches per 100,000 residents, down from 23.8 in 2021, according to FDIC and Census Bureau data.
- The number of full-service branches fell in 47 of the 50 states and DC between June 30, 2021 and June 30, 2026, according to the FDIC's Summary of Deposits.
- Branches per resident fell in every state and DC between 2021 and 2026, according to FDIC and Census Bureau data.
North Dakota has 48.8 full-service bank branches for every 100,000 residents, 4.1 times as many per person as Nevada, with 11.8, according to FDIC and Census Bureau data. The five states with the most branches per resident are all in the Census Bureau's Midwest region, and the eight with the fewest are all in the West. Between June 30, 2021 and June 30, 2026, branches per resident fell in every state and DC, according to FDIC and Census Bureau data.
Nationally there are 21.5 full-service branches per 100,000 residents, or one for every 4,662 people, down from 23.8 in 2021, according to FDIC and Census Bureau data. Branches are counted from the FDIC's Summary of Deposits for June 30, 2026, in the state each office is in; residents are the Census Bureau's estimate for July 1, 2025.
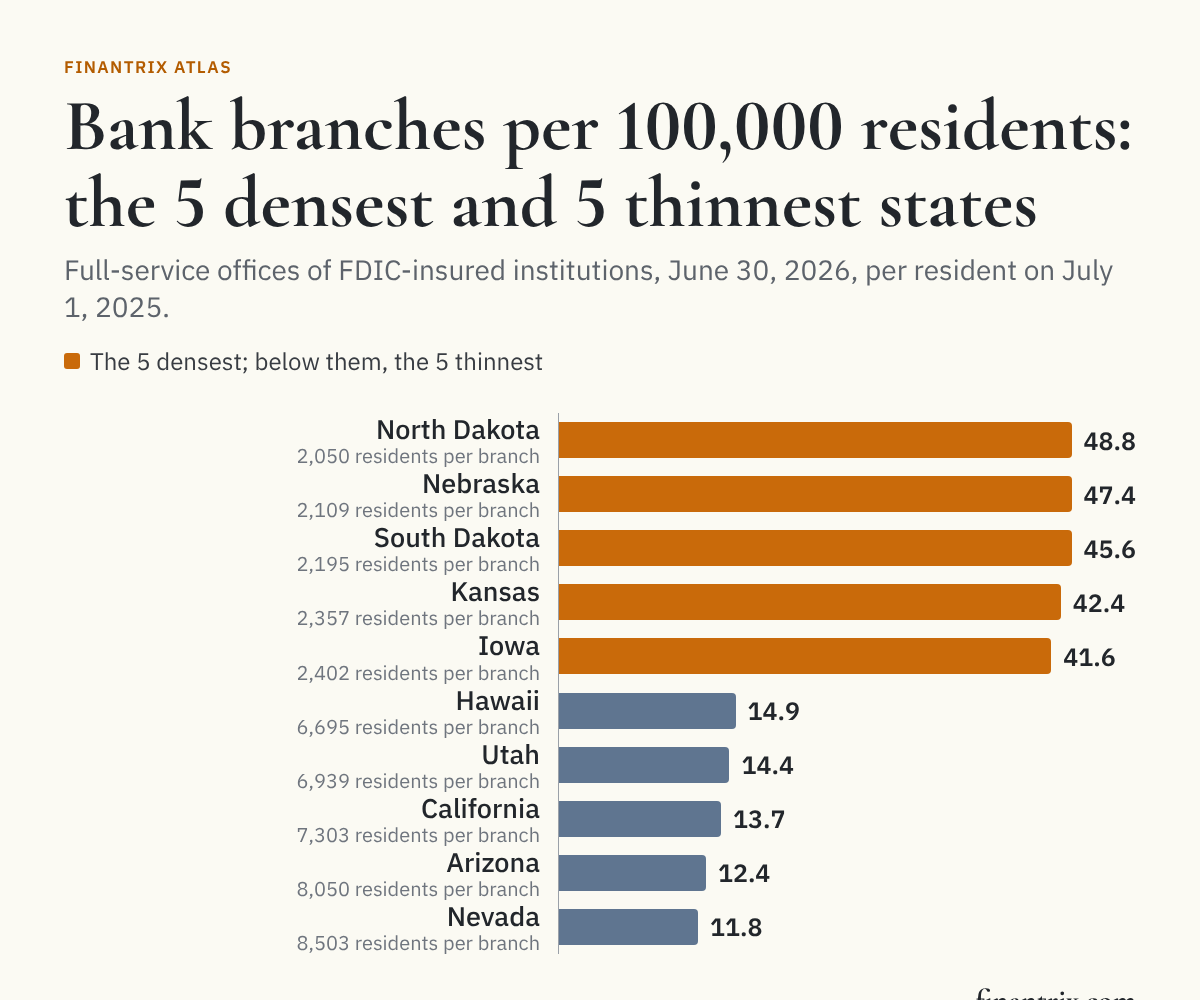
Bank branches per 100,000 residents, by state
Every state and DC, ranked by full-service branches of FDIC-insured institutions per 100,000 residents. A branch is an office a customer can walk into, as the FDIC codes it in the Summary of Deposits for June 30, 2026. The 2021 rate uses the survey for June 30, 2021 and the Census Bureau's estimate for July 1, 2020, from the same vintage.
| Rank | State | Full-service branches | Residents | Branches per 100,000 | Residents per branch | Per 100,000, 2021 | Change in branches since 2021 | Source |
|---|---|---|---|---|---|---|---|---|
| 1 | North Dakota | 390 | 799,358 | 48.8 | 2,050 | 51.1 | −2.0% | FDIC, Census |
| 2 | Nebraska | 957 | 2,018,006 | 47.4 | 2,109 | 48.0 | +1.6% | FDIC, Census |
| 3 | South Dakota | 426 | 935,094 | 45.6 | 2,195 | 49.3 | −2.7% | FDIC, Census |
| 4 | Kansas | 1,263 | 2,977,220 | 42.4 | 2,357 | 44.7 | −3.7% | FDIC, Census |
| 5 | Iowa | 1,348 | 3,238,387 | 41.6 | 2,402 | 43.3 | −2.5% | FDIC, Census |
| 6 | Arkansas | 1,228 | 3,114,791 | 39.4 | 2,536 | 40.3 | +1.0% | FDIC, Census |
| 7 | Wyoming | 202 | 588,753 | 34.3 | 2,915 | 36.5 | −4.3% | FDIC, Census |
| 8 | Mississippi | 992 | 2,954,160 | 33.6 | 2,978 | 34.6 | −3.2% | FDIC, Census |
| 9 | Missouri | 2,014 | 6,270,541 | 32.1 | 3,113 | 33.9 | −3.5% | FDIC, Census |
| 10 | Vermont | 207 | 644,663 | 32.1 | 3,114 | 34.4 | −6.3% | FDIC, Census |
| 11 | Montana | 353 | 1,144,694 | 30.8 | 3,243 | 32.7 | −0.6% | FDIC, Census |
| 12 | Kentucky | 1,404 | 4,606,864 | 30.5 | 3,281 | 33.1 | −6.0% | FDIC, Census |
| 13 | West Virginia | 534 | 1,766,147 | 30.2 | 3,307 | 31.1 | −4.1% | FDIC, Census |
| 14 | Maine | 420 | 1,414,874 | 29.7 | 3,369 | 31.8 | −3.2% | FDIC, Census |
| 15 | Oklahoma | 1,196 | 4,123,288 | 29.0 | 3,448 | 30.5 | −1.2% | FDIC, Census |
| 16 | Louisiana | 1,270 | 4,618,189 | 27.5 | 3,636 | 27.9 | −2.3% | FDIC, Census |
| 17 | Illinois | 3,426 | 12,719,141 | 26.9 | 3,713 | 29.1 | −8.0% | FDIC, Census |
| 18 | Wisconsin | 1,575 | 5,972,787 | 26.4 | 3,792 | 29.1 | −8.3% | FDIC, Census |
| 19 | Minnesota | 1,520 | 5,830,405 | 26.1 | 3,836 | 27.2 | −2.0% | FDIC, Census |
| 20 | New Hampshire | 367 | 1,415,342 | 25.9 | 3,857 | 28.0 | −4.9% | FDIC, Census |
| 21 | Alabama | 1,332 | 5,193,088 | 25.6 | 3,899 | 27.5 | −3.6% | FDIC, Census |
| 22 | Tennessee | 1,871 | 7,315,076 | 25.6 | 3,910 | 27.5 | −1.8% | FDIC, Census |
| 23 | Massachusetts | 1,827 | 7,154,084 | 25.5 | 3,916 | 28.7 | −9.0% | FDIC, Census |
| 24 | District of Columbia | 171 | 693,645 | 24.7 | 4,056 | 30.0 | −14.9% | FDIC, Census |
| 25 | Ohio | 2,932 | 11,900,510 | 24.6 | 4,059 | 27.0 | −8.1% | FDIC, Census |
| 26 | Indiana | 1,710 | 6,973,333 | 24.5 | 4,078 | 26.3 | −4.2% | FDIC, Census |
| 27 | Pennsylvania | 3,168 | 13,059,432 | 24.3 | 4,122 | 27.3 | −10.8% | FDIC, Census |
| 28 | Connecticut | 890 | 3,688,496 | 24.1 | 4,144 | 28.7 | −13.3% | FDIC, Census |
| 29 | New Jersey | 2,207 | 9,548,215 | 23.1 | 4,326 | 27.6 | −13.8% | FDIC, Census |
| 30 | Colorado | 1,334 | 6,012,561 | 22.2 | 4,507 | 23.6 | −2.4% | FDIC, Census |
| 31 | Rhode Island | 236 | 1,114,521 | 21.2 | 4,723 | 21.2 | +1.3% | FDIC, Census |
| 32 | Delaware | 217 | 1,059,952 | 20.5 | 4,885 | 23.0 | −4.8% | FDIC, Census |
| 33 | South Carolina | 1,138 | 5,570,274 | 20.4 | 4,895 | 22.3 | −0.5% | FDIC, Census |
| 34 | Virginia | 1,789 | 8,880,107 | 20.1 | 4,964 | 23.5 | −11.8% | FDIC, Census |
| 35 | New York | 3,894 | 20,002,427 | 19.5 | 5,137 | 21.5 | −10.0% | FDIC, Census |
| 36 | Idaho | 389 | 2,029,733 | 19.2 | 5,218 | 23.6 | −11.0% | FDIC, Census |
| 37 | Texas | 6,064 | 31,709,821 | 19.1 | 5,229 | 20.9 | −0.8% | FDIC, Census |
| 38 | Michigan | 1,841 | 10,127,884 | 18.2 | 5,501 | 21.5 | −14.9% | FDIC, Census |
| 39 | Florida | 4,211 | 23,462,518 | 17.9 | 5,572 | 20.7 | −5.6% | FDIC, Census |
| 40 | New Mexico | 381 | 2,125,498 | 17.9 | 5,579 | 18.9 | −5.0% | FDIC, Census |
| 41 | Georgia | 1,995 | 11,302,748 | 17.7 | 5,666 | 19.7 | −5.7% | FDIC, Census |
| 42 | North Carolina | 1,969 | 11,197,968 | 17.6 | 5,687 | 20.0 | −5.8% | FDIC, Census |
| 43 | Maryland | 1,099 | 6,265,347 | 17.5 | 5,701 | 21.1 | −15.8% | FDIC, Census |
| 44 | Oregon | 703 | 4,273,586 | 16.4 | 6,079 | 18.9 | −12.2% | FDIC, Census |
| 45 | Washington | 1,302 | 8,001,020 | 16.3 | 6,145 | 19.6 | −14.1% | FDIC, Census |
| 46 | Alaska | 112 | 737,270 | 15.2 | 6,583 | 15.7 | −2.6% | FDIC, Census |
| 47 | Hawaii | 214 | 1,432,820 | 14.9 | 6,695 | 16.3 | −9.3% | FDIC, Census |
| 48 | Utah | 510 | 3,538,904 | 14.4 | 6,939 | 15.2 | +2.2% | FDIC, Census |
| 49 | California | 5,389 | 39,355,309 | 13.7 | 7,303 | 15.7 | −12.9% | FDIC, Census |
| 50 | Arizona | 947 | 7,623,818 | 12.4 | 8,050 | 14.6 | −9.7% | FDIC, Census |
| 51 | Nevada | 386 | 3,282,188 | 11.8 | 8,503 | 14.1 | −12.3% | FDIC, Census |
Download this table (CSV), free. The full dataset, with every state's office count, population and rate on both dates, is one email away.
Where branches are densest and thinnest
- Densest: North Dakota, with 48.8 branches per 100,000 residents, according to FDIC and Census Bureau data, or one branch for every 2,050 people. Next are Nebraska (47.4) and South Dakota (45.6).
- Thinnest: Nevada, with 11.8, according to FDIC and Census Bureau data, or one branch for every 8,503 people. Next are Arizona (12.4) and California (13.7).
- By region: in the Census Bureau's own regions, the five densest states are all in the Midwest and the eight thinnest are all in the West.
- DC ranks 24 of the 50 states and DC, with 24.7 branches per 100,000 residents, according to FDIC and Census Bureau data.
A rate per resident measures how many offices there are for the people who live in a state. It does not say how far a resident lives from the nearest one: a large rural state can have many branches per person and long distances between them.
How branch density changed since 2021
The number of full-service branches fell from 78,831 to 73,320 between June 30, 2021 and June 30, 2026, according to the FDIC, a fall of 7.0%. Counts fell in 47 of the 50 states and DC; the steepest fall was in Maryland, where branches went from 1,305 to 1,099, down 15.8%, according to the FDIC.
Branch counts rose in four: Nebraska (+1.6%), Arkansas (+1.0%), Rhode Island (+1.3%) and Utah (+2.2%), according to the FDIC. In each of them the population grew faster, so branches per resident still fell, according to FDIC and Census Bureau data. The smallest fall in the rate was in Rhode Island, 0.07 branches per 100,000 residents.
What this means for technology buyers
Where branches are thinning, more of what a bank does has to work without one: account opening, servicing and advice delivered on a phone or a call, with the branch kept for what still needs a person. Where branches are dense, the branch network and the digital channels have to run as one, and the systems behind both matter as much as the front end. These guides compare the options side by side:
- Mobile banking apps for regional banks: digital channel platforms for banks below money-center scale.
- Deposit management platforms: for banks competing to keep and grow core deposits, in branches and online.
- CRM for financial services: one view of a customer across the branch, the call center and the app.
- Cloud-based core banking systems: what a move off a legacy core involves, and who can take it on.
Redesigning how a bank serves customers across channels? The Bank Value Streams show how the work flows from first contact to a served customer, and the Retail Bank Business Capability Model maps what a bank does.
More from Finantrix Atlas
- US banks with the most branches
- Largest banks in each state by deposits
- Credit unions by state
- The financial sector's share of each state's economy
How this list was built
Branches are every office in the FDIC's Summary of Deposits for June 30, 2026 that the FDIC codes as full service: brick-and-mortar, retail, and the other service types the FDIC marks as full service. They are counted in the state where the office is, not the state of the bank's main office, and every office of every FDIC-insured institution is included. The survey also lists 2,225 limited-service offices in the states and DC, such as drive-through, administrative, loan production and trust offices, which are in the dataset but not in the rate. On each date, every state's office count equals BankFind's own server-side count for that state, and no office is counted twice. The 314 offices in Federated States of Micronesia, Guam, Marshall Islands, Northern Mariana Islands, Palau, Puerto Rico and US Virgin Islands are outside the table.
Residents are the Census Bureau's population estimates for states, vintage 2025: July 1, 2025 for the current rate and July 1, 2020 for the earlier one. The survey is taken each June 30, and the newest estimate is for the July before it, so both dates are read with the same gap, and from the same vintage, because each vintage revises every earlier year. The 50 states and DC sum exactly to the Census Bureau's national estimate for both years. The file was read from the Census Bureau's own dataset download; its data API requires a key that the build does not hold.
Limits
- Offices, not access. A branch count does not show distance, opening hours, ATMs or digital service, and it counts each office once however large it is.
- Banks and savings institutions only. Credit union branches are not in the FDIC's survey and are not counted here.
- Where people live, not where they bank. A branch in one state can serve people who live in another.
- Two dates. Branches are counted on June 30, 2026 and June 30, 2021; residents on July 1, 2025 and July 1, 2020. A state's figure between those dates is not shown.
- The FDIC's service codes. Whether an office is full service is the bank's own report to the FDIC, coded as the FDIC defines it.
Cite this
Free to quote, cite and republish, including the chart, with credit to Finantrix Atlas and a link to this page.
North Dakota has 48.8 full-service bank branches per 100,000 residents and Nevada has 11.8, according to a Finantrix Atlas analysis of FDIC Summary of Deposits data for June 30, 2026 and Census Bureau population estimates.
The US has 21.5 full-service bank branches per 100,000 residents, down from 23.8 in 2021, according to Finantrix Atlas, from FDIC and Census Bureau data.
Suggested citation: Finantrix Atlas, "Bank Branches per Capita by State," data as of June 30, 2026, from the FDIC Summary of Deposits and US Census Bureau population estimates. https://www.finantrix.com/articles/bank-branches-per-capita
Embed the chart:
<a href="https://www.finantrix.com/articles/bank-branches-per-capita"><img src="https://www.finantrix.com/atlas/bank-branches-per-capita.png" alt="Bank branches per 100,000 residents by state, from FDIC and Census Bureau data, by Finantrix Atlas"></a>
<p>Chart: <a href="https://www.finantrix.com/articles/bank-branches-per-capita">Finantrix Atlas</a>, from the FDIC Summary of Deposits and Census Bureau population estimates.</p>
Frequently asked questions
Q: Which state has the most bank branches per person? A: North Dakota, with 48.8 full-service bank branches per 100,000 residents on June 30, 2026, according to FDIC and Census Bureau data.
Q: Which state has the fewest bank branches per person? A: Nevada, with 11.8 full-service bank branches per 100,000 residents, or one for every 8,503 people, according to FDIC and Census Bureau data.
Q: How many bank branches are there per person in the US? A: 21.5 full-service branches per 100,000 residents, or one for every 4,662 people, across the 50 states and DC, according to FDIC and Census Bureau data for June 30, 2026.
Q: Are bank branches declining? A: Yes. Full-service bank branches fell from 78,831 to 73,320 between June 30, 2021 and June 30, 2026, according to the FDIC, and branches per resident fell in every state and DC.
Download the data
The 51 rows on this page (CSV), free. The full dataset has all 51 rows, as of June 30, 2026; we email you a link.
Frequently Asked Questions
Which state has the most bank branches per person?
North Dakota, with 48.8 full-service bank branches per 100,000 residents on June 30, 2026, according to FDIC and Census Bureau data.
Which state has the fewest bank branches per person?
Nevada, with 11.8 full-service bank branches per 100,000 residents, or one for every 8,503 people, according to FDIC and Census Bureau data.
How many bank branches are there per person in the US?
21.5 full-service branches per 100,000 residents, or one for every 4,662 people, across the 50 states and DC, according to FDIC and Census Bureau data for June 30, 2026.
Are bank branches declining?
Yes. Full-service bank branches fell from 78,831 to 73,320 between June 30, 2021 and June 30, 2026, according to the FDIC, and branches per resident fell in every state and DC.