
Key Takeaways
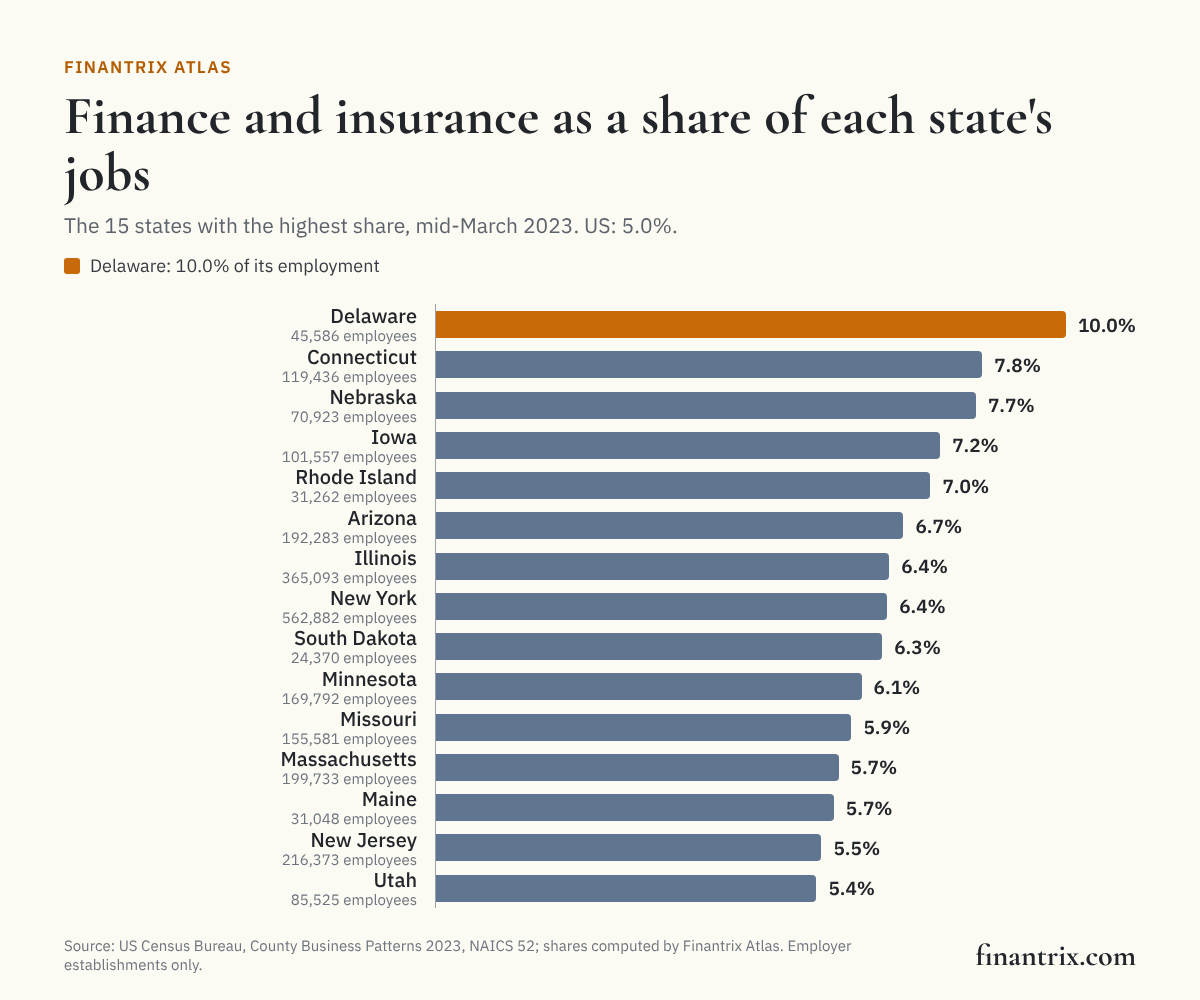
- According to Census Bureau County Business Patterns data, finance and insurance was 10.0% of Delaware's employment in 2023, the highest share of the 50 states and DC, against 5.0% nationally.
- Texas had the most finance and insurance employees in 2023, 643,854, followed by California with 634,885, according to the Census Bureau.
- US finance and insurance employment was 6,991,623 in mid-March 2023, up 2.3% from 2022, a change smaller than the Census Bureau's noise flags allow for the two national figures, according to Census Bureau data; it rose by more than the Bureau's noise could explain in 11 of the 50 states and DC.
- Annual payroll per finance and insurance employee was $125,425 in 2023, against $68,342 across all industries, according to Finantrix Atlas's calculation from Census Bureau data; it was highest in New York, at $253,324.
Finance and insurance was 10.0% of Delaware's employment in 2023, the highest share of the 50 states and DC and against 5.0% nationally, according to the Census Bureau's County Business Patterns. It also had the highest share in 2022, 7.9%, according to Census Bureau data. Its finance and insurance employees rose from 33,368 to 45,586, and all of the rise was in credit intermediation, where employees went from 20,599 to 33,039 while establishments fell, from 768 to 738, according to Census Bureau data; the other finance subsectors together had 222 fewer employees. The data do not say why. By count, Texas had the most finance and insurance employees, 643,854, followed by California with 634,885, according to the Census Bureau. Across the country the industry employed 6,991,623 people in mid-March 2023, up 2.3% from 2022, a change smaller than the Census Bureau's noise flags allow for the two national figures, according to Census Bureau data.
Every figure is from the Census Bureau's County Business Patterns, which counts employer establishments, the people on their payroll in the pay period including March 12, and their annual payroll. Finance and insurance is NAICS sector 52. A state's share is its finance and insurance employees divided by all the employees County Business Patterns counts in that state; the concentration ratio divides that share by the national one, the way a location quotient is defined. Both are computed by Finantrix Atlas from Census Bureau figures; the Census Bureau publishes neither.
Finance and insurance employees, by state
Ranked by the number of finance and insurance employees in 2023, from Census Bureau data. A concentration above one means the industry is a larger part of the state's employment than of the nation's. Payroll per employee divides the year's payroll by the mid-March head count. A change marked * is smaller than the Census Bureau's noise flags allow in the two years' figures together, so it may not be a real change.
| Rank | State | Employees | Share of state's employment | Concentration (US = 1.00) | Establishments | Payroll per employee | Change in employees since 2022 | Source |
|---|---|---|---|---|---|---|---|---|
| 1 | Texas | 643,854 | 5.4% | 1.07 | 42,205 | $107,891 | +5.1% | Census |
| 2 | California | 634,885 | 3.9% | 0.77 | 49,165 | $151,424 | −4.1% | Census |
| 3 | New York | 562,882 | 6.4% | 1.28 | 24,380 | $253,324 | +4.3% | Census |
| 4 | Florida | 472,606 | 4.7% | 0.95 | 36,230 | $105,574 | +10.9% | Census |
| 5 | Illinois | 365,093 | 6.4% | 1.29 | 19,310 | $133,100 | +2.3%* | Census |
| 6 | Pennsylvania | 299,515 | 5.2% | 1.05 | 16,829 | $110,447 | −1.6%* | Census |
| 7 | Ohio | 260,262 | 5.1% | 1.02 | 15,004 | $97,190 | +3.1%* | Census |
| 8 | North Carolina | 221,722 | 5.2% | 1.04 | 13,591 | $115,203 | +0.1%* | Census |
| 9 | New Jersey | 216,373 | 5.5% | 1.10 | 11,075 | $144,443 | +3.8%* | Census |
| 10 | Georgia | 202,824 | 4.6% | 0.92 | 15,226 | $107,094 | +4.5% | Census |
| 11 | Massachusetts | 199,733 | 5.7% | 1.15 | 9,268 | $171,977 | +6.6% | Census |
| 12 | Arizona | 192,283 | 6.7% | 1.33 | 10,000 | $89,325 | +4.7% | Census |
| 13 | Virginia | 178,431 | 5.0% | 1.00 | 10,642 | $123,506 | +3.2%* | Census |
| 14 | Michigan | 172,517 | 4.3% | 0.85 | 12,501 | $94,701 | −3.6%* | Census |
| 15 | Minnesota | 169,792 | 6.1% | 1.21 | 9,687 | $120,512 | +3.2%* | Census |
| 16 | Missouri | 155,581 | 5.9% | 1.18 | 10,384 | $100,161 | +2.8%* | Census |
| 17 | Wisconsin | 139,100 | 5.3% | 1.05 | 8,673 | $105,175 | +1.2%* | Census |
| 18 | Tennessee | 137,754 | 4.6% | 0.93 | 9,913 | $96,419 | −1.8%* | Census |
| 19 | Colorado | 125,158 | 4.9% | 0.98 | 10,673 | $108,507 | −2.9%* | Census |
| 20 | Connecticut | 119,436 | 7.8% | 1.55 | 5,629 | $177,844 | +6.2%* | Census |
| 21 | Indiana | 111,147 | 3.8% | 0.76 | 9,390 | $87,471 | −0.5%* | Census |
| 22 | Washington | 110,060 | 3.6% | 0.72 | 9,829 | $121,998 | −1.3%* | Census |
| 23 | Iowa | 101,557 | 7.2% | 1.43 | 5,833 | $94,393 | +1.7%* | Census |
| 24 | Maryland | 98,329 | 4.0% | 0.80 | 7,054 | $122,940 | −5.7% | Census |
| 25 | Utah | 85,525 | 5.4% | 1.08 | 5,717 | $95,584 | +3.3%* | Census |
| 26 | South Carolina | 82,019 | 4.0% | 0.79 | 7,645 | $82,117 | +0.1%* | Census |
| 27 | Alabama | 76,096 | 4.2% | 0.83 | 7,195 | $89,471 | +2.9%* | Census |
| 28 | Kentucky | 74,622 | 4.4% | 0.87 | 6,269 | $84,187 | +7.1% | Census |
| 29 | Nebraska | 70,923 | 7.7% | 1.54 | 4,249 | $88,599 | +8.1% | Census |
| 30 | Kansas | 65,980 | 5.3% | 1.06 | 5,888 | $87,259 | −1.3%* | Census |
| 31 | Louisiana | 64,830 | 3.8% | 0.76 | 7,328 | $79,316 | +6.6% | Census |
| 32 | Oregon | 63,120 | 3.7% | 0.74 | 5,783 | $95,578 | −1.2%* | Census |
| 33 | Oklahoma | 59,886 | 4.2% | 0.84 | 6,652 | $80,554 | +1.9%* | Census |
| 34 | Nevada | 47,413 | 3.5% | 0.70 | 4,600 | $87,043 | +0.9%* | Census |
| 35 | Delaware | 45,586 | 10.0% | 1.99 | 1,999 | $121,212 | +36.6% | Census |
| 36 | Arkansas | 43,250 | 3.9% | 0.77 | 4,527 | $81,180 | +2.4%* | Census |
| 37 | Mississippi | 34,515 | 3.6% | 0.72 | 4,519 | $75,412 | −1.0%* | Census |
| 38 | Rhode Island | 31,262 | 7.0% | 1.41 | 1,516 | $113,787 | −1.8%* | Census |
| 39 | Maine | 31,048 | 5.7% | 1.13 | 1,897 | $89,404 | −2.0%* | Census |
| 40 | New Hampshire | 29,852 | 4.8% | 0.95 | 1,966 | $111,719 | +4.4%* | Census |
| 41 | Idaho | 25,836 | 3.6% | 0.73 | 3,162 | $78,289 | +1.7%* | Census |
| 42 | South Dakota | 24,370 | 6.3% | 1.27 | 2,044 | $79,125 | −2.9%* | Census |
| 43 | New Mexico | 24,067 | 3.7% | 0.73 | 2,441 | $74,084 | −4.4%* | Census |
| 44 | District of Columbia | 22,979 | 4.1% | 0.82 | 1,079 | $199,781 | +8.4%* | Census |
| 45 | Hawaii | 20,093 | 3.9% | 0.77 | 1,533 | $87,906 | −2.2%* | Census |
| 46 | West Virginia | 18,531 | 3.4% | 0.67 | 1,999 | $69,666 | +6.3% | Census |
| 47 | North Dakota | 18,125 | 5.1% | 1.03 | 1,833 | $81,736 | +0.4%* | Census |
| 48 | Montana | 16,826 | 4.1% | 0.82 | 2,057 | $81,952 | −0.3%* | Census |
| 49 | Vermont | 9,218 | 3.6% | 0.72 | 941 | $97,941 | −6.9% | Census |
| 50 | Wyoming | 7,422 | 3.5% | 0.70 | 1,270 | $81,007 | −3.9% | Census |
| 51 | Alaska | 7,335 | 2.8% | 0.56 | 782 | $85,132 | +0.1%* | Census |
Download this table (CSV), free. The full dataset, every state with each finance subsector's establishments, employees and payroll in both years and the Census Bureau's noise flags, is one email away.
Where the jobs are, and how they changed
- Texas, California and New York together had 26.3% of the nation's finance and insurance employees, and 26.6% of its employees in all industries, according to Census Bureau data.
- 22 of the 50 states and DC have a larger share of their employment in finance and insurance than the nation, according to the Census Bureau. After Delaware come Connecticut, at 7.8%, and Nebraska, at 7.7%, according to Census Bureau data.
- From 2022 to 2023, finance and insurance employment rose by more than the noise could explain in 11 of the 50 states and DC, fell by more than it in 4, and moved within it in 36, according to Finantrix Atlas's calculation from Census Bureau data. The largest rise was in Delaware, +36.6%, the rise described at the top of this page, and the largest fall in Vermont, −6.9%, according to Census Bureau data. Nationally employment changed by +2.3% in finance and insurance and by +3.0% in all industries, according to Census Bureau data; both are smaller than the noise flags allow for the two years' figures.
Banking, securities and insurance, by state
Employees in the three large finance subsectors, from Census Bureau data. Credit intermediation is banks, credit unions and other lenders; securities and investments covers brokers, exchanges, asset managers and advisers; insurance is carriers together with agencies and brokerages. The Census Bureau does not publish a figure flagged as high noise, so some cells read "not published".
| Rank | State | Credit intermediation employees | Securities and investments employees | Insurance employees | Source |
|---|---|---|---|---|---|
| 1 | Texas | 294,576 | 76,364 | 270,629 | Census |
| 2 | California | 281,751 | 113,195 | 236,503 | Census |
| 3 | New York | 201,372 | 192,522 | 164,125 | Census |
| 4 | Florida | 178,144 | 59,979 | 233,532 | Census |
| 5 | Illinois | 119,475 | 61,151 | 182,297 | Census |
| 6 | Pennsylvania | 93,857 | 61,450 | 143,132 | Census |
| 7 | Ohio | 114,437 | 20,939 | 123,594 | Census |
| 8 | North Carolina | 119,473 | 24,103 | 77,613 | Census |
| 9 | New Jersey | 78,232 | 45,194 | 92,225 | Census |
| 10 | Georgia | 84,713 | 20,030 | 96,530 | Census |
| 11 | Massachusetts | 63,231 | 52,238 | 82,802 | Census |
| 12 | Arizona | 92,896 | 16,774 | 82,433 | Census |
| 13 | Virginia | 95,802 | 15,131 | 64,356 | Census |
| 14 | Michigan | 84,624 | 14,942 | 72,506 | Census |
| 15 | Minnesota | 64,008 | 21,011 | 83,601 | Census |
| 16 | Missouri | 67,958 | not published | 67,425 | Census |
| 17 | Wisconsin | 47,201 | 13,042 | 78,748 | Census |
| 18 | Tennessee | 57,059 | 12,332 | 68,095 | Census |
| 19 | Colorado | 49,541 | 19,051 | 56,274 | Census |
| 20 | Connecticut | 23,643 | 19,847 | 75,896 | Census |
| 21 | Indiana | 44,678 | 9,966 | 56,476 | Census |
| 22 | Washington | 48,849 | 16,775 | 44,176 | Census |
| 23 | Iowa | 48,392 | 6,337 | 46,752 | Census |
| 24 | Maryland | 39,000 | 20,587 | 38,459 | Census |
| 25 | Utah | 48,985 | 13,494 | 22,824 | Census |
| 26 | South Carolina | 38,263 | not published | 36,330 | Census |
| 27 | Alabama | 41,583 | 4,152 | 30,239 | Census |
| 28 | Kentucky | 32,696 | 9,694 | 32,165 | Census |
| 29 | Nebraska | 34,158 | 6,965 | 29,578 | Census |
| 30 | Kansas | 28,464 | not published | 29,304 | Census |
| 31 | Louisiana | 31,709 | 4,759 | 28,235 | Census |
| 32 | Oregon | 27,690 | 6,568 | 28,832 | Census |
| 33 | Oklahoma | 34,249 | 4,572 | 20,989 | Census |
| 34 | Nevada | 23,141 | 4,343 | 19,851 | Census |
| 35 | Delaware | 33,039 | 5,566 | 6,888 | Census |
| 36 | Arkansas | 23,056 | 3,002 | 17,167 | Census |
| 37 | Mississippi | 21,073 | 1,404 | 12,017 | Census |
| 38 | Rhode Island | 11,348 | 4,137 | 15,773 | Census |
| 39 | Maine | 17,206 | 1,850 | 11,986 | Census |
| 40 | New Hampshire | 8,541 | not published | 13,715 | Census |
| 41 | Idaho | 13,669 | 1,937 | 10,208 | Census |
| 42 | South Dakota | 15,769 | 1,483 | 7,109 | Census |
| 43 | New Mexico | 10,842 | not published | 10,174 | Census |
| 44 | District of Columbia | 12,152 | 5,125 | 5,598 | Census |
| 45 | Hawaii | 10,217 | 1,081 | 8,786 | Census |
| 46 | West Virginia | 10,038 | 861 | 7,632 | Census |
| 47 | North Dakota | 10,885 | 1,133 | 6,102 | Census |
| 48 | Montana | 9,275 | 1,519 | 5,967 | Census |
| 49 | Vermont | 4,056 | 1,050 | 4,104 | Census |
| 50 | Wyoming | 4,153 | 769 | 2,455 | Census |
| 51 | Alaska | 4,494 | not published | 1,879 | Census |
In the 45 of the 50 states and DC where all three are published, the subsector with the most employees is credit intermediation in 29 of them and insurance carriers and related activities in 16, according to Census Bureau data.
Pay
Annual payroll per finance and insurance employee was $125,425 in 2023, against $68,342 across all industries, according to Finantrix Atlas's calculation from Census Bureau data. It was highest in New York, at $253,324, then the District of Columbia, at $199,781, and lowest in West Virginia, at $69,666, according to the same calculation. Across the country, from Census Bureau data, with * marking a change smaller than the noise flags allow:
| Industry | Establishments | Employees | Share of finance and insurance employees | Payroll per employee | Change in employees since 2022 | Source |
|---|---|---|---|---|---|---|
| Finance and insurance | 469,382 | 6,991,623 | 100.0% | $125,425 | +2.3%* | Census |
| Monetary authorities (central bank) | 66 | 22,009 | 0.3% | $147,648 | +4.5%* | Census |
| Credit intermediation and related activities | 176,966 | 2,953,663 | 42.2% | $104,345 | +0.4%* | Census |
| Securities, commodity contracts and other financial investments | 113,885 | 1,042,226 | 14.9% | $260,466 | +4.9% | Census |
| Insurance carriers and related activities | 176,459 | 2,964,086 | 42.4% | $98,628 | +3.4%* | Census |
| Funds, trusts and other financial vehicles (part) | 2,006 | 9,639 | 0.1% | $173,124 | +7.3% | Census |
| All industries, for comparison | 8,361,342 | 139,831,742 | $68,342 | +3.0%* | Census |
Payroll includes all forms of compensation paid during the year, among them salaries, wages, commissions and bonuses, according to the Census Bureau's glossary. Divided by employees in one March pay period, it is an average, not a median, and a state whose finance employment grew or shrank during the year will read high or low.
What this means for technology buyers
Where a financial firm's people work, and what they are paid there, shapes what its teams cost and where it can hire them. Firms with staff in several states plan headcount, compensation and reporting across all of them at once. These guides compare the options:
- Financial BI and dashboards for bank executives: turning the institution's own data, including its headcount and cost, into the view executives use.
- Sales performance management for wealth and insurance: incentive pay for advisers, agents and producers.
- Data warehouse solutions for financial services: where that data is kept and modeled.
Mapping how a financial firm runs its workforce before choosing the systems? The Human Resources Functional Business Architecture maps HR's capabilities, value streams and data.
More from Finantrix Atlas
- Financial services share of GDP by state: the same states by value added rather than jobs.
- Where financial firms are: establishments by metro: offices by metro area, with banking, securities and insurance apart.
- Insurance agencies and brokerages by state: one finance industry, office by office.
- Pay for technology roles in finance
How this was built
The figures are from the Census Bureau's County Business Patterns for 2023 and 2022, read from its national files (2023, 2022) and state files (2023, 2022), all legal forms of organization together, for the finance and insurance sector and its five subsectors. The share and the concentration ratio use the state's all-industries total from the same file and year.
The figures were reconciled to the Census Bureau's own totals. In both years, the states and DC add up exactly to the national file in establishments, employees and payroll for all industries, the sector, credit intermediation, securities and investments and insurance; the central bank and funds and trusts subsectors, which are not published in states with fewer than three establishments, add up to no more than it. The national subsectors add up to the sector, and no state's subsectors exceed its sector total.
The Census Bureau adds statistical noise to each establishment's employment and payroll before tabulating, and flags each figure by how much: under two percent, two to under five, or five percent or more, according to its methodology and record layouts. Only figures in the first two bands are used. A figure flagged as high noise, withheld or not available shows as "not published" and is left out of every total, share and ranking. Establishment counts carry no noise.
A one-year change is shown because the Census Bureau's methodology says County Business Patterns uses the same industry classification, NAICS 2017, in both years. A state's change counts as a rise or a fall only where it is larger than the most the two years' noise flags allow together; the rest are marked *.
The page was first planned on the Bureau of Labor Statistics' quarterly employment census, whose data site could not be reached when it was built. It uses no BLS figure.
Limits
- Employers in County Business Patterns, not all jobs. The self-employed, most government employees, railroads, crop and animal production and private households are not in it, according to the Census Bureau. In finance, it also leaves out pension, health and welfare funds and trusts and estates. The all-industries total the shares divide by is the same universe, so a state with many government jobs has a smaller denominator than its whole workforce.
- Where the job is, not where the company is based. Employees are counted at the establishment that pays them, so a firm based in one state with offices in others is counted in each.
- One pay period. Employees are those on the payroll in the pay period including March 12; payroll is for the whole year. Neither is an annual average.
- Noise. Every employee and payroll figure on the page carries the Census Bureau's noise, up to five percent; establishment counts carry none. A one-year change near zero can be noise; the * marks those.
- The change shows that employment moved, not why. A firm moving staff between its own establishments, or reclassifying them between industries, moves the figures as much as hiring does.
- Data date. The data years are 2023 and 2022; 2023 is the newest County Business Patterns the Census Bureau has published.
Cite this
Free to quote, cite and republish, including the chart, with credit to Finantrix Atlas and a link to this page.
Finance and insurance was 10.0% of Delaware's employment in 2023, against 5.0% nationally, according to a Finantrix Atlas analysis of Census Bureau County Business Patterns data.
Texas had 643,854 finance and insurance employees in mid-March 2023, more than any other state, according to Finantrix Atlas, from Census Bureau data.
Suggested citation: Finantrix Atlas, "Finance and Insurance Jobs by State," 2023 data, from US Census Bureau, County Business Patterns. https://www.finantrix.com/articles/finance-jobs-by-state
Embed the chart:
<a href="https://www.finantrix.com/articles/finance-jobs-by-state"><img src="https://www.finantrix.com/atlas/finance-jobs-by-state.png" alt="Finance and insurance as a share of employment by state, from Census Bureau data, by Finantrix Atlas"></a>
<p>Chart: <a href="https://www.finantrix.com/articles/finance-jobs-by-state">Finantrix Atlas</a>, from US Census Bureau County Business Patterns.</p>
Frequently asked questions
Q: Which state has the most finance jobs? A: Texas, with 643,854 finance and insurance employees in mid-March 2023, according to the Census Bureau's County Business Patterns.
Q: Which state has the highest concentration of finance and insurance jobs? A: Delaware, where finance and insurance was 10.0% of employment in 2023, 1.99 times the national share of 5.0%, according to Finantrix Atlas's calculation from Census Bureau data.
Q: How many people work in finance and insurance in the US? A: 6,991,623 employees of finance and insurance establishments in mid-March 2023, according to the Census Bureau, up 2.3% from 2022, a change smaller than the Census Bureau's noise flags allow for the two national figures.
Q: How much do finance and insurance jobs pay? A: Annual payroll per employee was $125,425 in 2023, against $68,342 across all industries, according to Finantrix Atlas's calculation from Census Bureau data.
Download the data
The 51 rows on this page (CSV), free. The full dataset has all 306 rows, as of December 31, 2023; we email you a link.
Frequently Asked Questions
Which state has the most finance jobs?
Texas, with 643,854 finance and insurance employees in mid-March 2023, according to the Census Bureau's County Business Patterns.
Which state has the highest concentration of finance and insurance jobs?
Delaware, where finance and insurance was 10.0% of employment in 2023, 1.99 times the national share of 5.0%, according to Finantrix Atlas's calculation from Census Bureau data.
How many people work in finance and insurance in the US?
6,991,623 employees of finance and insurance establishments in mid-March 2023, according to the Census Bureau, up 2.3% from 2022, a change smaller than the Census Bureau's noise flags allow for the two national figures.
How much do finance and insurance jobs pay?
Annual payroll per employee was $125,425 in 2023, against $68,342 across all industries, according to Finantrix Atlas's calculation from Census Bureau data.