
Key Takeaways
- According to BLS data for May 2025, the median wage across all jobs in finance and insurance is $77,030, 51% above the all-industry median of $50,980.
- Software Developers, the largest technology occupation in finance, earn a median $135,460 there against $135,980 across all industries, a difference of −0.4%, according to BLS.
- Of 17 technology occupations, finance and insurance pays a median more than 3% above the all-industry median in 11, within 3% in 6, and more than 3% below in none, according to BLS.
- Finance and insurance has the highest median of any sector for 1 of the 17 technology occupations; according to BLS, Information and Utilities each have the highest median for 5 of the 17 occupations, more than any other sector.
Across all jobs, finance and insurance pays a median wage of $77,030, 51% above the all-industry median, according to BLS data for May 2025. For software developers, the largest technology occupation in the sector, BLS reports a median of $135,460 in finance against $135,980 across all industries, a difference of −0.4%. According to BLS, of 17 technology occupations, finance and insurance pays a median more than 3% above the all-industry median in 11, within 3% in 6, and more than 3% below in none.
Every figure is from the Bureau of Labor Statistics' Occupational Employment and Wage Statistics (OEWS) for May 2025, the newest release, comparing BLS's estimates for the finance and insurance sector (NAICS 52) with its estimates across all industries.
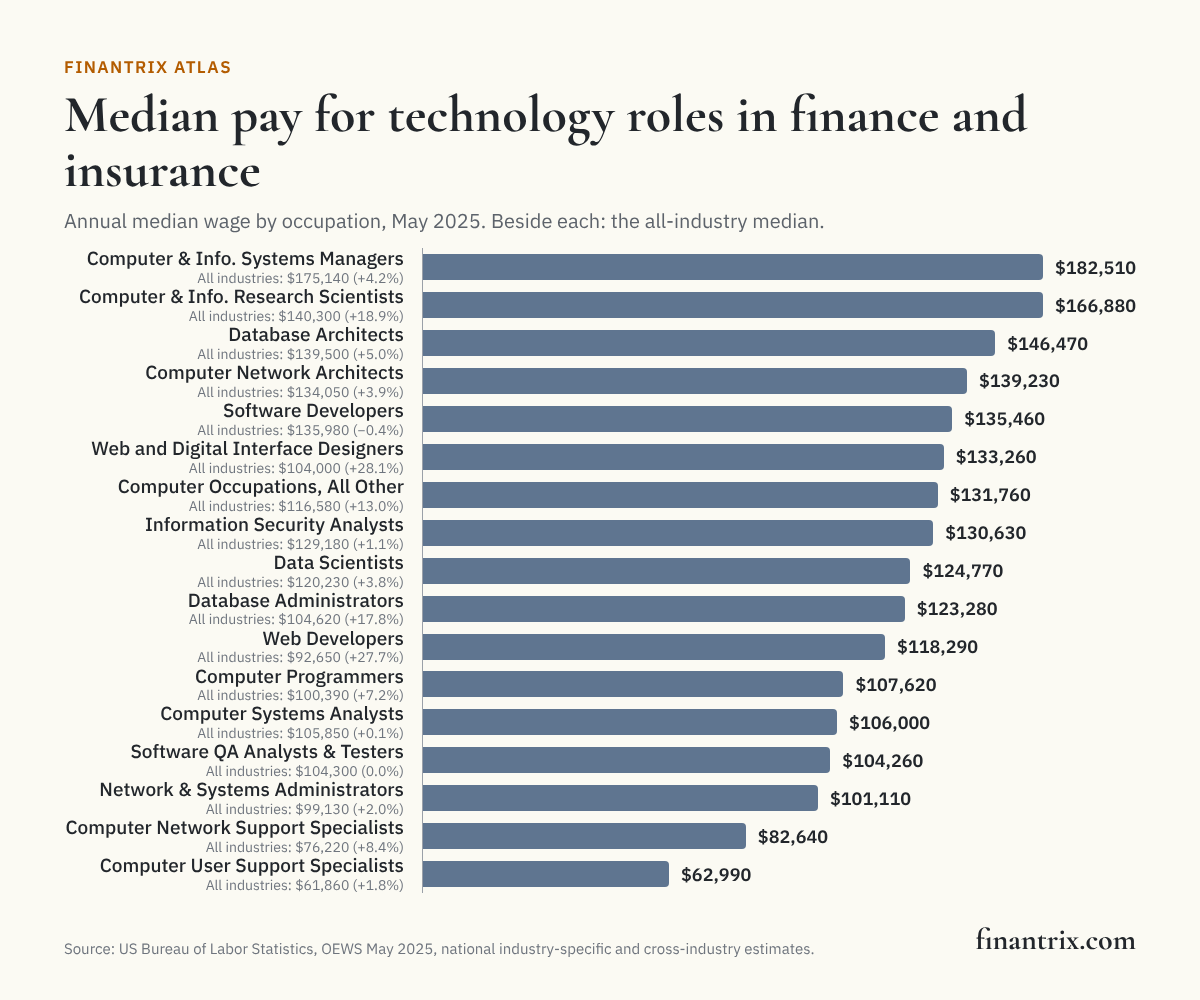
Technology pay in finance and insurance, occupation by occupation
Ordered by employment in finance and insurance. The rank places finance and insurance among the sectors for which BLS publishes a median for that occupation, with the highest-paying sector ranked first.
| Occupation (SOC code) | Employed in finance and insurance | Median, finance and insurance | Median, all industries | Difference | Finance's rank among sectors | Highest-paying sector (median) | Source |
|---|---|---|---|---|---|---|---|
| Software Developers (15-1252) | 167,990 | $135,460 | $135,980 | −0.4% | 8 of 18 | Information ($166,400) | BLS |
| Computer and Information Systems Managers (11-3021) | 81,490 | $182,510 | $175,140 | +4.2% | 3 of 20 | Information ($200,510) | BLS |
| Computer Systems Analysts (15-1211) | 64,570 | $106,000 | $105,850 | +0.1% | 9 of 20 | Mining, Quarrying, and Oil and Gas Extraction ($132,320) | BLS |
| Data Scientists (15-2051) | 46,730 | $124,770 | $120,230 | +3.8% | 6 of 19 | Information ($141,440) | BLS |
| Computer User Support Specialists (15-1232) | 39,670 | $62,990 | $61,860 | +1.8% | 9 of 20 | Utilities ($85,070) | BLS |
| Information Security Analysts (15-1212) | 29,580 | $130,630 | $129,180 | +1.1% | 4 of 19 | Information ($138,650) | BLS |
| Computer Occupations, All Other (15-1299) | 27,020 | $131,760 | $116,580 | +13.0% | 1 of 20 | Finance and Insurance ($131,760) | BLS |
| Network and Computer Systems Administrators (15-1244) | 26,540 | $101,110 | $99,130 | +2.0% | 6 of 19 | Utilities ($108,200) | BLS |
| Software Quality Assurance Analysts and Testers (15-1253) | 22,240 | $104,260 | $104,300 | 0.0% | 8 of 19 | Manufacturing ($129,930) | BLS |
| Computer Network Architects (15-1241) | 18,840 | $139,230 | $134,050 | +3.9% | 3 of 19 | Wholesale Trade ($151,460) | BLS |
| Database Architects (15-1243) | 9,370 | $146,470 | $139,500 | +5.0% | 4 of 18 | Administrative and Support and Waste Services ($149,490) | BLS |
| Computer Network Support Specialists (15-1231) | 8,060 | $82,640 | $76,220 | +8.4% | 2 of 19 | Utilities ($85,700) | BLS |
| Database Administrators (15-1242) | 8,060 | $123,280 | $104,620 | +17.8% | 3 of 19 | Management of Companies and Enterprises ($124,270) | BLS |
| Web and Digital Interface Designers (15-1255) | 7,480 | $133,260 | $104,000 | +28.1% | 2 of 18 | Transportation and Warehousing ($133,840) | BLS |
| Computer Programmers (15-1251) | 5,010 | $107,620 | $100,390 | +7.2% | 6 of 19 | Utilities ($129,150) | BLS |
| Web Developers (15-1254) | 3,200 | $118,290 | $92,650 | +27.7% | 3 of 18 | Utilities ($120,860) | BLS |
| Computer and Information Research Scientists (15-1221) | 160 | $166,880 | $140,300 | +18.9% | 4 of 12 | Information ($214,370) | BLS |
Download this table (CSV), free. The full dataset, every occupation in every sector with employment, mean wage, every percentile BLS publishes and BLS's error measures, is one email away.
Software Developers in every sector
Finance and insurance employs 167,990 software developers, 10% of the national total, and ranks 8 of 18 among sectors by their median wage, according to BLS. The highest median is in Information, at $166,400, according to BLS.
| Sector (NAICS) | Employed | Median | Mean | Source |
|---|---|---|---|---|
| Information (51) | 347,380 | $166,400 | $165,930 | BLS |
| Transportation and Warehousing (48-49) | 18,020 | $147,010 | $151,670 | BLS |
| Mining, Quarrying, and Oil and Gas Extraction (21) | 810 | $139,270 | $144,020 | BLS |
| Arts, Entertainment, and Recreation (71) | 2,500 | $136,610 | $138,670 | BLS |
| Manufacturing (31-33) | 136,390 | $136,330 | $147,420 | BLS |
| Administrative and Support and Waste Services (56) | 62,560 | $136,090 | $144,250 | BLS |
| Management of Companies and Enterprises (55) | 103,450 | $135,680 | $156,760 | BLS |
| Finance and Insurance (52) | 167,990 | $135,460 | $145,230 | BLS |
| Retail Trade (44-45) | 7,610 | $134,930 | $137,040 | BLS |
| Utilities (22) | 2,730 | $134,780 | $134,960 | BLS |
| Real Estate and Rental and Leasing (53) | 5,150 | $134,690 | $136,810 | BLS |
| Wholesale Trade (42) | 60,620 | $133,910 | $139,970 | BLS |
| Professional, Scientific, and Technical Services (54) | 698,420 | $132,810 | $143,040 | BLS |
| Other Services (except Public Administration) (81) | 6,570 | $127,680 | $130,060 | BLS |
| Health Care and Social Assistance (62) | 20,030 | $127,460 | $127,740 | BLS |
| Government (OEWS designation) (99) | 21,090 | $109,770 | $111,800 | BLS |
| Educational Services (61) | 20,990 | $109,620 | $117,480 | BLS |
| Construction (23) | 5,260 | $108,370 | $116,690 | BLS |
| Agriculture, Forestry, Fishing and Hunting (11) | 90 | not published | not published | BLS |
| Accommodation and Food Services (72) | 230 | not published | not published | BLS |
| All industries | 1,687,890 | $135,980 | $148,100 | BLS |
What the comparison shows
- According to BLS, finance and insurance has the highest median of any sector for 1 of the 17 occupations: Computer Occupations, All Other.
- According to BLS, Information and Utilities each have the highest median for 5 of the 17 occupations, more than any other sector.
- The widest gap in finance's favor is for Web and Digital Interface Designers, at +28.1%, according to BLS.
- Finance and insurance employs 566,010 people across these occupations, according to BLS estimates.
What this means for technology buyers
A finance firm hiring for these roles competes with every other sector, and for 6 of the 17 occupations the median in finance is within 3% of the all-industry median, according to BLS. That bears on the build-or-buy question for data platforms, cloud migration and core systems, and on how much of a program an outside firm carries. These guides compare the options:
- Cloud migration advisory: what an outside firm takes on in a move to the cloud.
- Data warehouse solutions for financial services: managed platforms against in-house builds.
- Cloud-based core banking systems: what a hosted core changes about the team a bank needs.
Planning the architecture before the hiring plan? The Enterprise Architecture Current State Assessment scores how an architecture function is working today.
More from Finantrix Atlas
How this was built
The universe is every detailed occupation in the Standard Occupational Classification's Computer Occupations group, plus Computer and Information Systems Managers and Data Scientists, as BLS publishes them for May 2025. Wages are BLS's annual medians, from its national cross-industry file and the sector workbook of its national industry-specific file.
The two files were reconciled against each other: employment in the sector workbook adds up to the cross-industry total for all occupations combined, and for each occupation on this page it adds up except where BLS leaves a sector's employment unpublished.
"Within 3%" is a reading rule this page sets, not a statistical test, because BLS publishes no error measure for a median. No occupation sits close enough to the line for rounding to move it across.
Limits
- National only. BLS publishes industry detail for the nation, not for states or metro areas. Its state-by-industry estimates are, in BLS's words, for research purposes only, and are not used here.
- Wages, not total pay. According to BLS's technical notes, OEWS wages include base pay, commissions and production bonuses but exclude nonproduction bonuses, overtime and the cost of benefits. Where an employer pays nonproduction bonuses, total pay is higher than these figures.
- A sector is a mix. Finance and insurance includes banks, insurers, asset managers, brokers and others, and a median across them can differ from any one of them. BLS's finance figures cover private employers, while its all-industry figures include government.
- Employees, not contractors. OEWS counts wage and salary workers at employers. Contractors are counted in the sector of the firm that employs them, not in the sector of the client.
- One release. The data describe May 2025. BLS builds each release from three years of survey responses, so a single year's change should be read with care.
Cite this
Free to quote, cite and republish, including the chart, with credit to Finantrix Atlas and a link to this page.
Software Developers in finance and insurance earn a median $135,460, against $135,980 across all industries, according to a Finantrix Atlas analysis of BLS OEWS data for May 2025.
Suggested citation: Finantrix Atlas, "Pay for Technology Roles in Finance vs Other Industries," May 2025 data, from the US Bureau of Labor Statistics, Occupational Employment and Wage Statistics. https://www.finantrix.com/articles/financial-it-wages
Embed the chart:
<a href="https://www.finantrix.com/articles/financial-it-wages"><img src="https://www.finantrix.com/atlas/financial-it-wages.png" alt="Median pay for technology roles in finance and insurance, from Finantrix Atlas"></a>
<p>Chart: <a href="https://www.finantrix.com/articles/financial-it-wages">Finantrix Atlas</a>, from BLS OEWS data.</p>
Frequently asked questions
Q: How much do software developers earn in finance? A: Software Developers in finance and insurance earn a median $135,460 a year, against $135,980 across all industries, according to BLS data for May 2025.
Q: Does finance pay technology workers more than other industries? A: Of 17 technology occupations, finance and insurance pays a median more than 3% above the all-industry median in 11, within 3% in 6, and more than 3% below in none, according to BLS.
Q: Which industry pays technology workers the most? A: According to BLS, Information and Utilities each have the highest median for 5 of the 17 occupations, more than any other sector. Finance and insurance has the highest for 1.
Q: Does BLS publish technology wages in finance by state? A: Not as official estimates. BLS publishes industry detail nationally; its state-by-industry figures are research estimates.
Download the data
The 17 rows on this page (CSV), free. The full dataset has all 336 rows, as of May 31, 2025; we email you a link.
Frequently Asked Questions
How much do software developers earn in finance?
Software Developers in finance and insurance earn a median $135,460 a year, against $135,980 across all industries, according to BLS data for May 2025.
Does finance pay technology workers more than other industries?
Of 17 technology occupations, finance and insurance pays a median more than 3% above the all-industry median in 11, within 3% in 6, and more than 3% below in none, according to BLS.
Which industry pays technology workers the most?
According to BLS, Information and Utilities each have the highest median for 5 of the 17 occupations, more than any other sector. Finance and insurance has the highest for 1.
Does BLS publish technology wages in finance by state?
Not as official estimates. BLS publishes industry detail nationally; its state-by-industry figures are research estimates.