
Key Takeaways
- According to Census Bureau County Business Patterns data, the New York metro area had 25,005 finance and insurance establishments in 2023, 5.3% of the US total.
- The 10 metros with the most finance establishments hold 26.9% of them, slightly less than their 28.3% share of all US business establishments, according to Census Bureau data.
- Securities and investment firms are the most concentrated of the three large finance subsectors: the 10 metros with the most hold 32.5% of them, against 26.7% for insurance and 24.3% for credit intermediation, according to the Census Bureau.
- Among metros with at least 1,000 finance establishments, finance is the largest share of all business establishments in Jackson, MS, 7.74%, against 5.6% nationally, according to Census Bureau data.
The New York metro area had 25,005 finance and insurance establishments in 2023, 5.3% of the US total and more than any other, according to the Census Bureau's County Business Patterns. Securities and investment firms are the most concentrated of the three large finance industries, according to Census Bureau data: the 10 metros with the most hold 32.5% of them, against 26.7% of insurance establishments and 24.3% of banking and lending offices. Finance as a whole is not more concentrated than business generally: the 10 metros with the most finance establishments hold 26.9% of them, slightly less than their 28.3% share of all US business establishments, according to the Census Bureau.
Establishments count offices, not people. New York holds 5.3% of the country's finance and insurance establishments but 8.2% of its 6,991,623 finance and insurance employees, according to the Census Bureau.
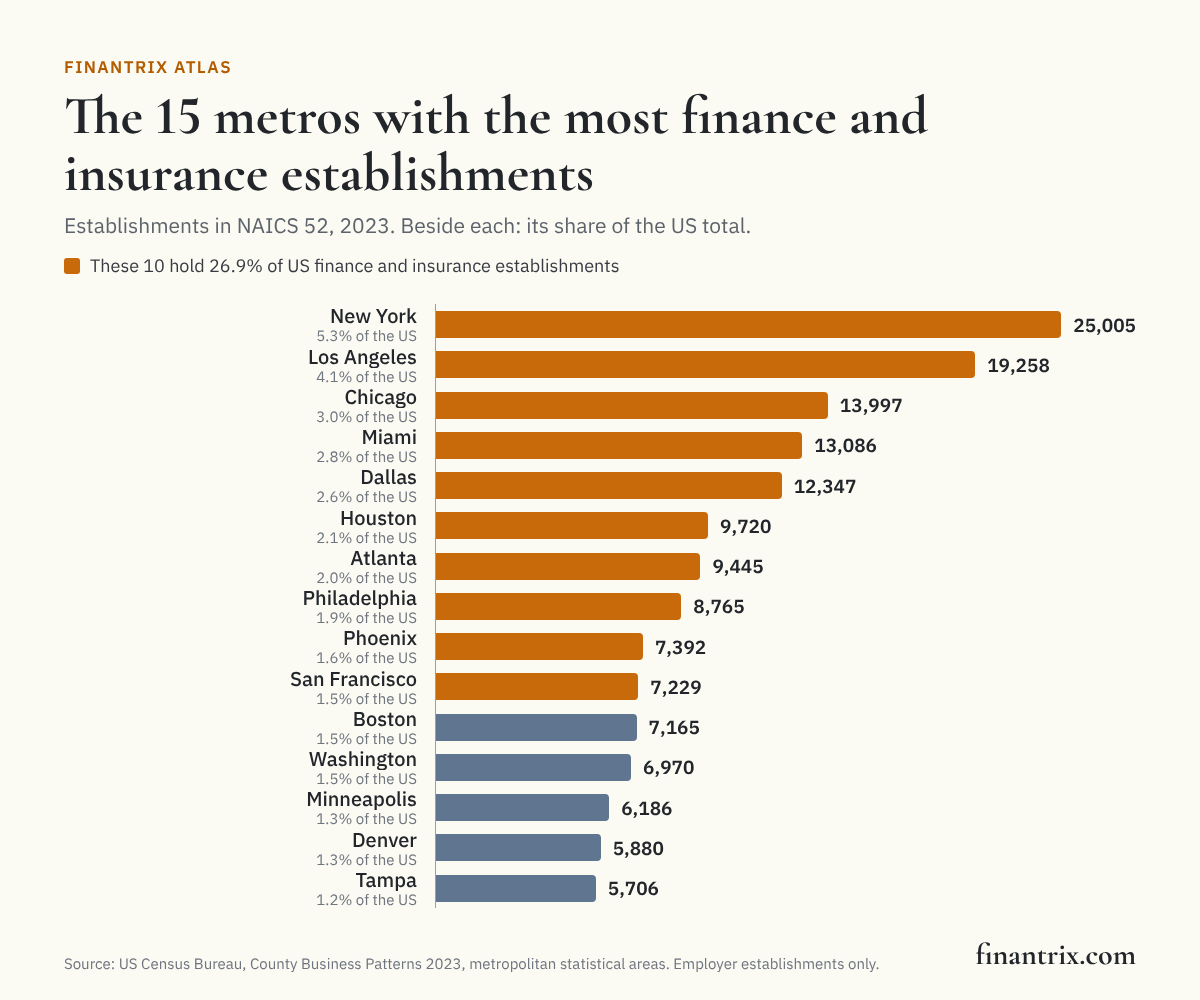
The 25 metro areas with the most finance and insurance establishments
Ranked by establishments in NAICS sector 52, finance and insurance, in 2023. Credit intermediation is banks, credit unions and other lenders; securities and investments covers brokers, exchanges, asset managers and advisers; insurance is carriers together with agencies and brokerages. The Census Bureau does not publish an industry cell with fewer than three establishments, and two small subsectors, the central bank and funds and trusts, are not shown, so the three columns need not add up to the total.
| Rank | Metro area | Finance and insurance establishments | Share of US | Credit intermediation | Securities and investments | Insurance | Finance and insurance employees | Finance share of the metro's establishments | Source |
|---|---|---|---|---|---|---|---|---|---|
| 1 | New York-Newark-Jersey City, NY-NJ | 25,005 | 5.3% | 8,561 | 8,107 | 8,104 | 574,814 | 4.4% | Census |
| 2 | Los Angeles-Long Beach-Anaheim, CA | 19,258 | 4.1% | 6,643 | 5,261 | 7,181 | 230,636 | 4.7% | Census |
| 3 | Chicago-Naperville-Elgin, IL-IN | 13,997 | 3.0% | 4,437 | 4,159 | 5,317 | 278,545 | 5.6% | Census |
| 4 | Miami-Fort Lauderdale-West Palm Beach, FL | 13,086 | 2.8% | 3,835 | 3,507 | 5,627 | 116,609 | 5.9% | Census |
| 5 | Dallas-Fort Worth-Arlington, TX | 12,347 | 2.6% | 4,186 | 3,512 | 4,572 | 262,677 | 6.5% | Census |
| 6 | Houston-Pasadena-The Woodlands, TX | 9,720 | 2.1% | 3,725 | 2,368 | 3,576 | 102,510 | 6.0% | Census |
| 7 | Atlanta-Sandy Springs-Roswell, GA | 9,445 | 2.0% | 3,299 | 2,284 | 3,824 | 135,690 | 5.8% | Census |
| 8 | Philadelphia-Camden-Wilmington, PA-NJ-DE-MD | 8,765 | 1.9% | 3,001 | 2,442 | 3,250 | 190,997 | 5.7% | Census |
| 9 | Phoenix-Mesa-Chandler, AZ | 7,392 | 1.6% | 2,471 | 1,913 | 2,982 | 150,495 | 6.5% | Census |
| 10 | San Francisco-Oakland-Fremont, CA | 7,229 | 1.5% | 2,202 | 2,936 | 2,021 | 135,225 | 5.4% | Census |
| 11 | Boston-Cambridge-Newton, MA-NH | 7,165 | 1.5% | 2,553 | 2,481 | 2,078 | 167,363 | 5.4% | Census |
| 12 | Washington-Arlington-Alexandria, DC-VA-MD-WV | 6,970 | 1.5% | 2,826 | 1,991 | 2,106 | 111,641 | 4.4% | Census |
| 13 | Minneapolis-St. Paul-Bloomington, MN-WI | 6,186 | 1.3% | 1,746 | 1,986 | 2,424 | 123,390 | 6.2% | Census |
| 14 | Denver-Aurora-Centennial, CO | 5,880 | 1.3% | 1,754 | 1,882 | 2,219 | 80,270 | 6.4% | Census |
| 15 | Tampa-St. Petersburg-Clearwater, FL | 5,706 | 1.2% | 1,742 | 1,264 | 2,675 | 114,427 | 6.2% | Census |
| 16 | Seattle-Tacoma-Bellevue, WA | 5,365 | 1.1% | 1,892 | 1,666 | 1,784 | 66,929 | 4.8% | Census |
| 17 | Detroit-Warren-Dearborn, MI | 5,310 | 1.1% | 1,993 | 1,221 | 2,053 | 90,917 | 5.2% | Census |
| 18 | St. Louis, MO-IL | 4,913 | 1.0% | 1,630 | 1,342 | 1,929 | 71,551 | 7.1% | Census |
| 19 | San Diego-Chula Vista-Carlsbad, CA | 4,858 | 1.0% | 1,660 | 1,547 | 1,623 | 58,373 | 5.2% | Census |
| 20 | Charlotte-Concord-Gastonia, NC-SC | 4,237 | 0.9% | 1,447 | 1,282 | 1,495 | 109,045 | 5.9% | Census |
| 21 | Orlando-Kissimmee-Sanford, FL | 4,175 | 0.9% | 1,353 | 930 | 1,870 | 49,779 | 5.4% | Census |
| 22 | Kansas City, MO-KS | 3,984 | 0.8% | 1,336 | 1,033 | 1,607 | 62,861 | 7.2% | Census |
| 23 | Austin-Round Rock-San Marcos, TX | 3,783 | 0.8% | 1,289 | 1,164 | 1,293 | 47,108 | 5.7% | Census |
| 24 | Baltimore-Columbia-Towson, MD | 3,566 | 0.8% | 1,300 | 950 | 1,287 | 51,308 | 5.2% | Census |
| 25 | Portland-Vancouver-Hillsboro, OR-WA | 3,524 | 0.8% | 1,190 | 1,036 | 1,289 | 44,152 | 4.8% | Census |
Download this table (CSV), free. The full dataset, every metropolitan and micropolitan area with all five finance subsectors, employees and the Census Bureau's noise flag, is one email away.
How concentrated each industry is
For each industry, the share of US establishments in the 10 metro areas with the most of that industry, from Census Bureau data:
| Industry | US establishments | Share in the 10 metros with the most | Leading metro | Its establishments | Source |
|---|---|---|---|---|---|
| Finance and insurance | 469,382 | 26.9% | New York-Newark-Jersey City, NY-NJ | 25,005 | Census, Census |
| Credit intermediation and related activities | 176,966 | 24.3% | New York-Newark-Jersey City, NY-NJ | 8,561 | Census, Census |
| Securities, commodity contracts and other financial investments | 113,885 | 32.5% | New York-Newark-Jersey City, NY-NJ | 8,107 | Census, Census |
| Insurance carriers and related activities | 176,459 | 26.7% | New York-Newark-Jersey City, NY-NJ | 8,104 | Census, Census |
| All industries, for comparison | 8,361,342 | 28.8% | Census, Census |
New York leads each of the three, according to the Census Bureau. The 387 metropolitan areas together hold 85.5% of the country's finance and insurance establishments; the rest are in micropolitan areas, rural counties and the Census Bureau's statewide category, according to the Census Bureau.
Where finance is the largest share of local business
Finance and insurance are 5.6% of all US business establishments, according to the Census Bureau. Among the 76 metro areas with at least 1,000 finance and insurance establishments, these ten have the highest share:
| Metro area | Finance share of the metro's establishments | Finance and insurance establishments | All establishments | Source |
|---|---|---|---|---|
| Jackson, MS | 7.74% | 1,112 | 14,359 | Census |
| Bridgeport-Stamford-Danbury, CT | 7.72% | 2,077 | 26,896 | Census |
| Des Moines-West Des Moines, IA | 7.64% | 1,447 | 18,946 | Census |
| Little Rock-North Little Rock-Conway, AR | 7.40% | 1,418 | 19,170 | Census |
| Kansas City, MO-KS | 7.23% | 3,984 | 55,104 | Census |
| Birmingham, AL | 7.14% | 1,943 | 27,200 | Census |
| Omaha, NE-IA | 7.09% | 1,794 | 25,290 | Census |
| St. Louis, MO-IL | 7.07% | 4,913 | 69,470 | Census |
| Wichita, KS | 6.98% | 1,073 | 15,367 | Census |
| Louisville/Jefferson County, KY-IN | 6.89% | 2,178 | 31,628 | Census |
A high share can mean many finance offices or few other businesses; the establishment counts beside it show which.
What this means for technology buyers
A firm spread across many metros buys for many offices at once: the same systems, contracts and suppliers in every location. These guides compare the options:
- Procurement platforms for financial institutions: sourcing, contracts and third-party risk in one place.
- CRM for financial services: relationship systems for banks, insurers and investment firms.
- Data warehouse solutions for financial services: one place for the data a firm reports on.
- Financial BI and dashboarding for bank executives: reporting on the business, by line and location.
Mapping the business? Business Architecture for Digital Transformation sets out how to map what a firm does before changing how it does it.
More from Finantrix Atlas
- Financial services share of GDP by state
- Pay for technology roles in finance
- Banks by state
- Registered investment advisers by state
How this list was built
The figures are from the Census Bureau's County Business Patterns for 2023, read from its metro-area file. Metropolitan areas are those in the Census Bureau's own metro-area reference file for County Business Patterns, outside Puerto Rico, which the metro file does not cover; micropolitan areas are in the dataset and not ranked.
The metro file was checked against the county file: for each of the 898 metro and micro areas whose counties all have a published finance row, the counties the reference file assigns to it add up exactly to the metro file, for all industries, for finance and insurance, and for each of the three subsectors; 27 areas have a county without a published finance row and could not be checked this way. The Census Bureau's reference file also assigns some "statewide" establishments, those with no fixed county, to a metro: Providence-Warwick, RI-MA. The states, from the state file, add up to the national file for the same industries.
Employees are for the pay period including March 12. The Census Bureau adds statistical noise to each establishment's employment before tabulating, and flags each figure by how much; a figure it withholds or flags as high noise shows as "not published". Establishment counts carry no noise, according to its methodology.
Limits
- Offices, not firms or size. An establishment is a location: a bank branch, an agency office and a trading floor each count once. Employees are shown so a few large offices can be told apart from many small ones.
- Employers only. Self-employed advisers, agents and brokers with no paid employees are not in County Business Patterns.
- Metro areas, not cities. A metropolitan area includes its suburbs and outlying counties, as the Office of Management and Budget defines it.
- Some cells are missing. An industry cell with fewer than three establishments is not published, so a small metro can show "not published" for a subsector it has.
- Funds and trusts in part. County Business Patterns leaves out pension, health and welfare funds and trusts and estates, so the finance total does not include them.
- One year. The data year is 2023, the newest County Business Patterns the Census Bureau has published.
Cite this
Free to quote, cite and republish, including the chart, with credit to Finantrix Atlas and a link to this page.
The New York metro area had 25,005 finance and insurance establishments in 2023, 5.3% of the US total, according to a Finantrix Atlas analysis of Census Bureau County Business Patterns data.
The 10 US metro areas with the most securities and investment firms hold 32.5% of them, according to Finantrix Atlas, from Census Bureau data.
Suggested citation: Finantrix Atlas, "Where Financial Firms Are: Establishments by Metro," 2023 data, from US Census Bureau, County Business Patterns. https://www.finantrix.com/articles/finance-establishments-by-county
Embed the chart:
<a href="https://www.finantrix.com/articles/finance-establishments-by-county"><img src="https://www.finantrix.com/atlas/finance-establishments-by-county.png" alt="US metro areas with the most finance and insurance establishments, from Census Bureau data, by Finantrix Atlas"></a>
<p>Chart: <a href="https://www.finantrix.com/articles/finance-establishments-by-county">Finantrix Atlas</a>, from US Census Bureau County Business Patterns.</p>
Frequently asked questions
Q: Which US city has the most financial firms? A: The New York-Newark-Jersey City, NY-NJ metro area, with 25,005 finance and insurance establishments in 2023, according to the Census Bureau, followed by Los Angeles with 19,258 and Chicago with 13,997.
Q: How many finance and insurance establishments are there in the US? A: 469,382 in 2023, according to the Census Bureau's County Business Patterns, 5.6% of all US business establishments.
Q: Where are securities and investment firms concentrated? A: The 10 metro areas with the most hold 32.5% of US securities and investment establishments, according to the Census Bureau, and New York alone holds 7.1%.
Q: Where is finance the largest share of local business? A: Among metro areas with at least 1,000 finance and insurance establishments, Jackson, MS, where finance and insurance are 7.74% of all business establishments, according to Census Bureau data.
Download the data
The 25 rows on this page (CSV), free. The full dataset has all 925 rows, as of December 31, 2023; we email you a link.
Frequently Asked Questions
Which US city has the most financial firms?
The New York-Newark-Jersey City, NY-NJ metro area, with 25,005 finance and insurance establishments in 2023, according to the Census Bureau, followed by Los Angeles with 19,258 and Chicago with 13,997.
How many finance and insurance establishments are there in the US?
469,382 in 2023, according to the Census Bureau's County Business Patterns, 5.6% of all US business establishments.
Where are securities and investment firms concentrated?
The 10 metro areas with the most hold 32.5% of US securities and investment establishments, according to the Census Bureau, and New York alone holds 7.1%.
Where is finance the largest share of local business?
Among metro areas with at least 1,000 finance and insurance establishments, Jackson, MS, where finance and insurance are 7.74% of all business establishments, according to Census Bureau data.