
Key Takeaways
- According to BEA data for 2025, finance and insurance is 34.4% of Delaware's GDP, the largest share of any state and 3.9 times the national share of 8.7%.
- According to BEA, the national share of GDP from finance and insurance rose from 7.6% in 2015 to 8.7% in 2025, and it rose in 46 of the 50 states and DC.
- Nebraska's share rose the most, from 10.2% to 19.1%; according to BEA, insurance carriers account for 7.7 of the 8.9-point rise.
- Finance and insurance is a larger share of GDP than real estate in 7 states, according to BEA: Delaware, New York, Nebraska, South Dakota, Connecticut, Iowa and Ohio.
Finance and insurance is 34.4% of Delaware's GDP, the largest share of any state and 3.9 times the national share of 8.7%, according to BEA data for 2025. New York is second, at 21.1%, and Nebraska third, at 19.1%, according to BEA. Over the 10 years since 2015, the sector's national share rose from 7.6% to 8.7%, and it rose in 46 of the 50 states and the District of Columbia, according to BEA. Nebraska's share rose the most, from 10.2% to 19.1%, and insurance carriers account for 7.7 of that 8.9-point rise, according to BEA.
Every figure is from the Bureau of Economic Analysis' GDP by state and industry, in current dollars, released September 30, 2026. A share divides an industry's GDP by the state's GDP for the same year, so it never mixes current-dollar and inflation-adjusted figures. Real estate is shown in its own column and is not added to finance.
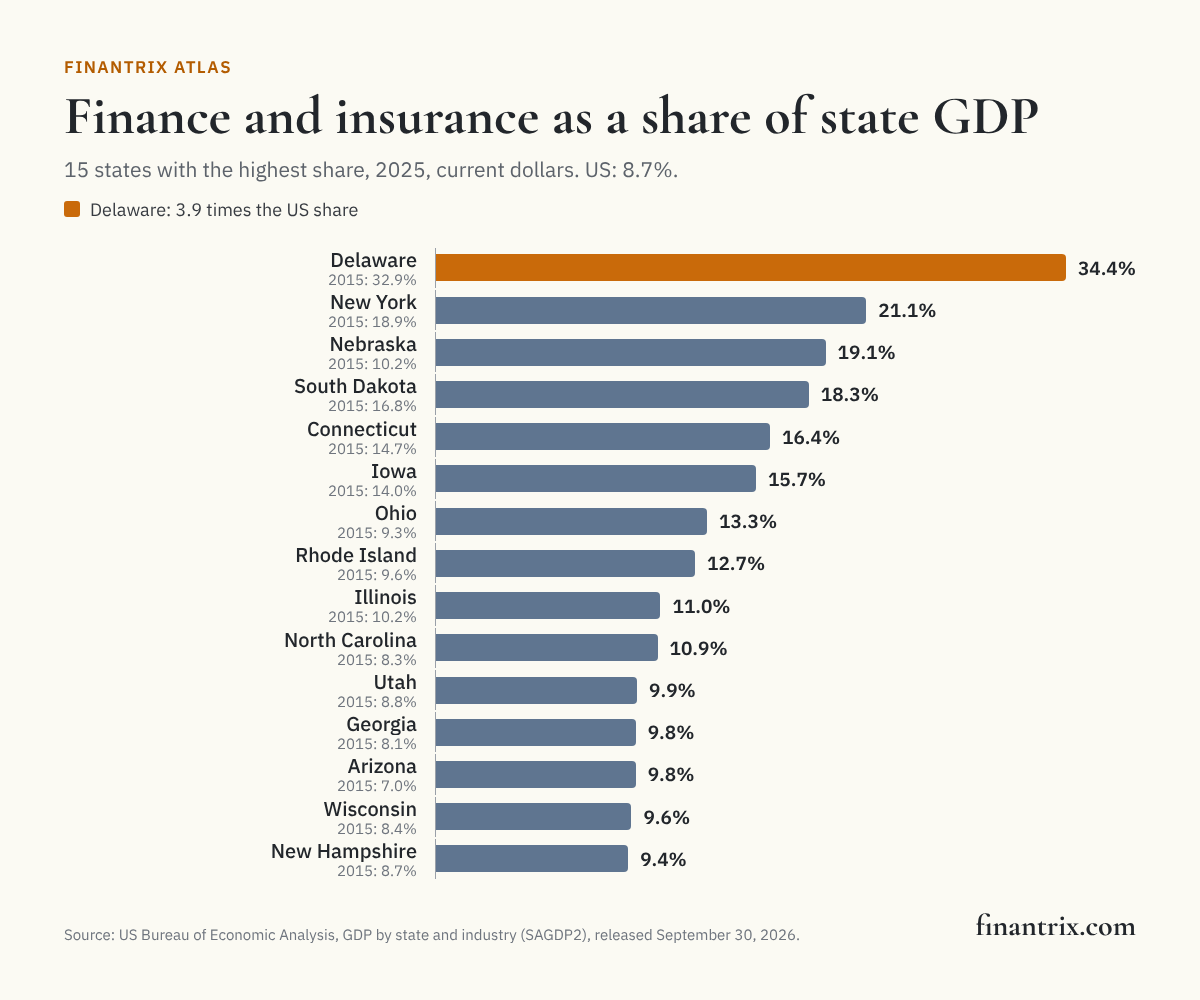
Finance and insurance as a share of GDP, by state
Ranked by finance and insurance (NAICS 52) as a share of the state's GDP in 2025. The three subsector columns are each a share of the state's GDP, and with BEA's fourth subsector, funds, trusts and other financial vehicles, they add up to the sector. "Relative to the US share" divides the state's share by the national one. Real estate is BEA's real estate industry (NAICS 531).
| Rank | State | Finance and insurance, share of GDP (2025) | Share in 2015 | Change (points) | Relative to the US share | Finance and insurance GDP (2025) | Credit intermediation | Securities and investments | Insurance carriers | Real estate, share of GDP (2025) | Source |
|---|---|---|---|---|---|---|---|---|---|---|---|
| 1 | Delaware | 34.4% | 32.9% | +1.5 | 3.9 times | $41.9 billion | 19.7% | 2.0% | 12.7% | 10.5% | Data from BEA |
| 2 | New York | 21.1% | 18.9% | +2.2 | 2.4 times | $521 billion | 12.8% | 6.3% | 1.9% | 13.1% | Data from BEA |
| 3 | Nebraska | 19.1% | 10.2% | +8.9 | 2.2 times | $39.5 billion | 3.2% | 0.8% | 15.2% | 8.1% | Data from BEA |
| 4 | South Dakota | 18.3% | 16.8% | +1.5 | 2.1 times | $15.0 billion | 15.6% | 0.4% | 2.2% | 9.1% | Data from BEA |
| 5 | Connecticut | 16.4% | 14.7% | +1.7 | 1.9 times | $62.8 billion | 3.0% | 4.3% | 9.1% | 11.8% | Data from BEA |
| 6 | Iowa | 15.7% | 14.0% | +1.7 | 1.8 times | $42.7 billion | 4.5% | 0.4% | 10.8% | 8.3% | Data from BEA |
| 7 | Ohio | 13.3% | 9.3% | +4.1 | 1.5 times | $130 billion | 7.3% | 0.5% | 5.4% | 11.1% | Data from BEA |
| 8 | Rhode Island | 12.7% | 9.6% | +3.1 | 1.5 times | $11.2 billion | 4.7% | 1.4% | 6.6% | 13.0% | Data from BEA |
| 9 | Illinois | 11.0% | 10.2% | +0.8 | 1.3 times | $137 billion | 3.3% | 1.4% | 6.2% | 11.6% | Data from BEA |
| 10 | North Carolina | 10.9% | 8.3% | +2.6 | 1.2 times | $97.5 billion | 7.6% | 0.9% | 2.3% | 12.0% | Data from BEA |
| 11 | Utah | 9.9% | 8.8% | +1.0 | 1.1 times | $31.5 billion | 7.6% | 0.4% | 1.7% | 11.7% | Data from BEA |
| 12 | Georgia | 9.8% | 8.1% | +1.7 | 1.1 times | $91.8 billion | 6.5% | 0.8% | 2.5% | 12.5% | Data from BEA |
| 13 | Arizona | 9.8% | 7.0% | +2.8 | 1.1 times | $58.1 billion | 5.2% | 0.7% | 3.9% | 15.2% | Data from BEA |
| 14 | Wisconsin | 9.6% | 8.4% | +1.2 | 1.1 times | $45.9 billion | 2.6% | 0.8% | 6.3% | 11.0% | Data from BEA |
| 15 | New Hampshire | 9.4% | 8.7% | +0.7 | 1.1 times | $12.1 billion | 1.9% | 1.5% | 6.0% | 13.3% | Data from BEA |
| 16 | Massachusetts | 9.2% | 9.2% | −0.0 | 1.1 times | $74.7 billion | 3.1% | 3.3% | 2.7% | 13.0% | Data from BEA |
| 17 | Missouri | 9.2% | 7.4% | +1.8 | 1.1 times | $43.7 billion | 3.0% | 2.6% | 3.5% | 11.2% | Data from BEA |
| 18 | Minnesota | 9.1% | 8.4% | +0.7 | 1.0 times | $46.8 billion | 4.2% | 1.5% | 3.3% | 11.6% | Data from BEA |
| 19 | Pennsylvania | 8.4% | 6.6% | +1.8 | 1.0 times | $88.8 billion | 2.8% | 1.6% | 4.0% | 11.9% | Data from BEA |
| 20 | Maine | 7.5% | 6.1% | +1.5 | 0.9 times | $7.7 billion | 3.6% | 0.5% | 3.4% | 14.7% | Data from BEA |
| 21 | Kentucky | 7.5% | 5.5% | +2.0 | 0.9 times | $23.5 billion | 2.3% | 0.4% | 4.7% | 10.4% | Data from BEA |
| 22 | Texas | 7.4% | 5.4% | +2.0 | 0.8 times | $217 billion | 2.8% | 1.5% | 3.0% | 11.2% | Data from BEA |
| 23 | Vermont | 6.8% | 5.3% | +1.5 | 0.8 times | $3.4 billion | 2.2% | 0.7% | 3.9% | 14.2% | Data from BEA |
| 24 | Alabama | 6.6% | 6.4% | +0.2 | 0.8 times | $22.5 billion | 3.6% | 0.5% | 2.5% | 11.3% | Data from BEA |
| 25 | Florida | 6.5% | 5.8% | +0.7 | 0.7 times | $117 billion | 1.8% | 1.1% | 3.6% | 19.0% | Data from BEA |
| 26 | Nevada | 6.5% | 5.1% | +1.3 | 0.7 times | $18.2 billion | 2.8% | 0.5% | 3.1% | 13.5% | Data from BEA |
| 27 | Virginia | 6.4% | 5.0% | +1.4 | 0.7 times | $51.6 billion | 3.9% | 0.7% | 1.8% | 13.4% | Data from BEA |
| 28 | New Jersey | 6.4% | 6.5% | −0.1 | 0.7 times | $56.6 billion | 1.9% | 1.9% | 2.5% | 14.7% | Data from BEA |
| 29 | Tennessee | 6.4% | 5.4% | +0.9 | 0.7 times | $37.3 billion | 2.8% | 0.7% | 2.8% | 11.6% | Data from BEA |
| 30 | Arkansas | 6.3% | 4.9% | +1.3 | 0.7 times | $12.3 billion | 3.2% | 0.5% | 2.6% | 10.1% | Data from BEA |
| 31 | Indiana | 6.2% | 6.0% | +0.2 | 0.7 times | $33.8 billion | 1.8% | 0.5% | 3.9% | 10.0% | Data from BEA |
| 32 | Kansas | 6.2% | 5.6% | +0.6 | 0.7 times | $14.3 billion | 2.2% | 0.8% | 3.2% | 10.3% | Data from BEA |
| 33 | Montana | 6.0% | 4.7% | +1.4 | 0.7 times | $4.9 billion | 3.7% | 0.5% | 1.9% | 13.6% | Data from BEA |
| 34 | Mississippi | 5.9% | 4.9% | +1.0 | 0.7 times | $9.6 billion | 3.2% | 0.2% | 2.5% | 11.0% | Data from BEA |
| 35 | North Dakota | 5.8% | 4.5% | +1.3 | 0.7 times | $4.8 billion | 3.2% | 0.4% | 2.2% | 8.0% | Data from BEA |
| 36 | Michigan | 5.8% | 5.6% | +0.2 | 0.7 times | $42.4 billion | 2.6% | 0.5% | 2.6% | 12.5% | Data from BEA |
| 37 | Colorado | 5.8% | 5.4% | +0.3 | 0.7 times | $33.1 billion | 2.8% | 1.2% | 1.7% | 15.0% | Data from BEA |
| 38 | Oklahoma | 5.6% | 3.9% | +1.7 | 0.6 times | $15.3 billion | 2.6% | 0.4% | 2.6% | 9.6% | Data from BEA |
| 39 | District of Columbia | 5.5% | 4.0% | +1.5 | 0.6 times | $10.6 billion | 2.8% | 1.2% | 1.3% | 8.6% | Data from BEA |
| 40 | Idaho | 5.4% | 4.4% | +1.0 | 0.6 times | $7.5 billion | 3.0% | 0.5% | 1.9% | 13.7% | Data from BEA |
| 41 | Oregon | 5.3% | 4.7% | +0.6 | 0.6 times | $18.1 billion | 2.2% | 0.5% | 2.6% | 14.0% | Data from BEA |
| 42 | Louisiana | 5.3% | 3.9% | +1.4 | 0.6 times | $18.0 billion | 2.1% | 0.4% | 2.8% | 9.1% | Data from BEA |
| 43 | South Carolina | 5.2% | 4.4% | +0.8 | 0.6 times | $19.7 billion | 2.2% | 0.5% | 2.4% | 14.6% | Data from BEA |
| 44 | California | 5.1% | 5.1% | −0.0 | 0.6 times | $219 billion | 2.3% | 1.5% | 1.3% | 12.9% | Data from BEA |
| 45 | Hawaii | 4.7% | 3.7% | +1.0 | 0.5 times | $5.8 billion | 2.3% | 0.2% | 2.2% | 15.0% | Data from BEA |
| 46 | Maryland | 4.6% | 5.0% | −0.4 | 0.5 times | $26.2 billion | 1.7% | 1.1% | 1.8% | 14.5% | Data from BEA |
| 47 | West Virginia | 4.3% | 3.6% | +0.6 | 0.5 times | $4.7 billion | 1.9% | 0.2% | 2.1% | 9.3% | Data from BEA |
| 48 | New Mexico | 3.9% | 3.5% | +0.4 | 0.4 times | $5.9 billion | 1.9% | 0.3% | 1.7% | 10.8% | Data from BEA |
| 49 | Wyoming | 3.9% | 2.5% | +1.4 | 0.4 times | $2.0 billion | 2.2% | 0.5% | 1.1% | 11.8% | Data from BEA |
| 50 | Washington | 3.6% | 3.7% | −0.2 | 0.4 times | $31.8 billion | 1.7% | 0.5% | 1.4% | 12.3% | Data from BEA |
| 51 | Alaska | 2.5% | 2.4% | +0.1 | 0.3 times | $1.8 billion | 1.5% | 0.2% | 0.8% | 8.6% | Data from BEA |
For the nation:
| Area | Finance and insurance, share of GDP (2025) | Share in 2015 | Change (points) | Finance and insurance GDP (2025) | Real estate, share of GDP (2025) | Source |
|---|---|---|---|---|---|---|
| United States | 8.7% | 7.6% | +1.1 | $2.69 trillion | 12.6% | Data from BEA |
Download this table (CSV), free. The full dataset, every state's GDP in dollars for each industry line in both years, as BEA publishes it, is one email away.
Where the share rose most
According to BEA, the share fell or held level in 5: Massachusetts, New Jersey, California, Maryland and Washington. These are the ten largest rises, with the subsector that contributed the most to each:
| State | Share in 2015 | Share in 2025 | Change (points) | Largest contributor | Its change (points) | Source |
|---|---|---|---|---|---|---|
| Nebraska | 10.2% | 19.1% | +8.9 | insurance carriers | +7.7 | Data from BEA |
| Ohio | 9.3% | 13.3% | +4.1 | credit intermediation | +2.9 | Data from BEA |
| Rhode Island | 9.6% | 12.7% | +3.1 | credit intermediation | +2.2 | Data from BEA |
| Arizona | 7.0% | 9.8% | +2.8 | credit intermediation | +1.8 | Data from BEA |
| North Carolina | 8.3% | 10.9% | +2.6 | credit intermediation | +2.0 | Data from BEA |
| New York | 18.9% | 21.1% | +2.2 | credit intermediation | +3.3 | Data from BEA |
| Kentucky | 5.5% | 7.5% | +2.0 | insurance carriers | +1.6 | Data from BEA |
| Texas | 5.4% | 7.4% | +2.0 | securities and investments | +0.7 | Data from BEA |
| Pennsylvania | 6.6% | 8.4% | +1.8 | credit intermediation | +1.0 | Data from BEA |
| Missouri | 7.4% | 9.2% | +1.8 | securities and investments | +1.7 | Data from BEA |
What drives a state's share
- In Delaware, credit intermediation is the largest part of the sector, 19.7% of the state's GDP, according to BEA.
- Across the 50 states and DC, insurance carriers are the largest finance subsector in 23 and credit intermediation in 27, according to BEA. Securities and investments lead in 1: Massachusetts.
- 18 of the 50 states and DC have a share above the national 8.7%, according to BEA. The lowest is Alaska, at 2.5%, according to BEA.
- Finance and insurance is a larger share of GDP than real estate in 7 of them, according to BEA: Delaware, New York, Nebraska, South Dakota, Connecticut, Iowa and Ohio. Real estate is largest in Florida, at 19.0% of GDP, according to BEA.
BEA measures GDP by state by place of work, according to its methodology: a firm's value added is counted where its establishments are, not where its customers live. BEA's real estate industry includes the imputed rental value of owner-occupied homes, according to the same methodology, which is one reason it is shown apart from finance.
What this means for technology buyers
Wherever a financial firm sits in this table, its executives read the same kinds of figures about their own business, and those figures come from the same kinds of systems. These guides compare them side by side:
- Financial BI and dashboards for bank executives: turning the institution's own data into the view executives use.
- Data warehouse solutions for financial services: where that data is kept and modeled.
- Financial close and consolidation software for banks: the reporting cycle behind every published figure.
Mapping how a financial firm is organized before choosing the systems? The Business Architecture Current State Assessment scores how a business architecture practice is working today.
More from Finantrix Atlas
How this was built
The universe is the 50 states and the District of Columbia in BEA's table SAGDP2, GDP by state in current dollars by industry, from BEA's bulk download. Finance and insurance is BEA's line for NAICS 52, with its subsectors 521-522, 523, 524 and 525; real estate is BEA's line for NAICS 531. Each share is that line divided by the state's all-industry GDP in the same year, for 2025 and 2015.
The figures were reconciled to BEA's own totals. For finance and insurance, each of its subsectors and real estate, the states add up to BEA's national figure in both years. For all industries, the national figure exceeds the sum of the states by BEA's line for overseas activity, the federal military and civilian activity abroad that no state is credited with. Each state's all-industry GDP equals the current-dollar GDP in BEA's summary table, SAGDP1, and the four subsectors add up to the sector in every state.
Limits
- Value added, not jobs or revenue. GDP by industry is the value an industry adds. A state can employ many people in finance with a smaller share of GDP, or the reverse; employment by state is a different measure.
- Where the work is, not where the firm is based. BEA assigns value added to the state of the establishment doing the work. For insurance carriers, according to BEA's methodology, the state figures are built from premiums and losses by state reported to the NAIC.
- Current dollars. Shares are of nominal GDP. They describe the size of the sector within each state's economy in a year, not growth after inflation.
- Revisions. BEA revises recent years with each release; the one used here, released September 30, 2026, revised 2019 to 2025. The data are for 2025 and 2015.
- Funds, trusts and other financial vehicles is small in most states; according to BEA, which prints it as less than $50,000 where it is that small, it is part of the sector total, and the table counts it there too.
Cite this
Free to quote, cite and republish, including the chart, with credit to Finantrix Atlas and a link to this page.
Finance and insurance accounts for 34.4% of Delaware's GDP, 3.9 times the national share of 8.7%, according to a Finantrix Atlas analysis of BEA data for 2025.
Suggested citation: Finantrix Atlas, "Financial Services Share of GDP by State," 2025 data, from the US Bureau of Economic Analysis, GDP by State. https://www.finantrix.com/articles/financial-sector-gdp-by-state
Embed the chart:
<a href="https://www.finantrix.com/articles/financial-sector-gdp-by-state"><img src="https://www.finantrix.com/atlas/financial-sector-gdp-by-state.png" alt="Finance and insurance as a share of state GDP, from Finantrix Atlas, from BEA data"></a>
<p>Chart: <a href="https://www.finantrix.com/articles/financial-sector-gdp-by-state">Finantrix Atlas</a>, from BEA data.</p>
Frequently asked questions
Q: Which state depends most on finance and insurance? A: Delaware, where finance and insurance is 34.4% of GDP, according to BEA data for 2025. New York is second, at 21.1%, according to BEA.
Q: What share of US GDP comes from finance and insurance? A: 8.7% in 2025, up from 7.6% in 2015, according to BEA.
Q: Is real estate counted as part of the financial sector here? A: No. BEA's real estate industry is shown in its own column. It includes the imputed rent of owner-occupied homes, according to BEA's methodology, and in 2025 it was 12.6% of US GDP, according to BEA.
Q: Which state's financial sector grew fastest as a share of its economy? A: Nebraska, from 10.2% of GDP in 2015 to 19.1% in 2025, mostly from insurance carriers, according to BEA.
Download the data
The 51 rows on this page (CSV), free. The full dataset has all 102 rows, as of December 31, 2025; we email you a link.
Frequently Asked Questions
Which state depends most on finance and insurance?
Delaware, where finance and insurance is 34.4% of GDP, according to BEA data for 2025. New York is second, at 21.1%, according to BEA.
What share of US GDP comes from finance and insurance?
8.7% in 2025, up from 7.6% in 2015, according to BEA.
Is real estate counted as part of the financial sector here?
No. BEA's real estate industry is shown in its own column. It includes the imputed rent of owner-occupied homes, according to BEA's methodology, and in 2025 it was 12.6% of US GDP, according to BEA.
Which state's financial sector grew fastest as a share of its economy?
Nebraska, from 10.2% of GDP in 2015 to 19.1% in 2025, mostly from insurance carriers, according to BEA.