
Key Takeaways
- According to Census Bureau County Business Patterns data, 133,728 insurance agency and brokerage establishments employed 818,561 people in the United States in 2023.
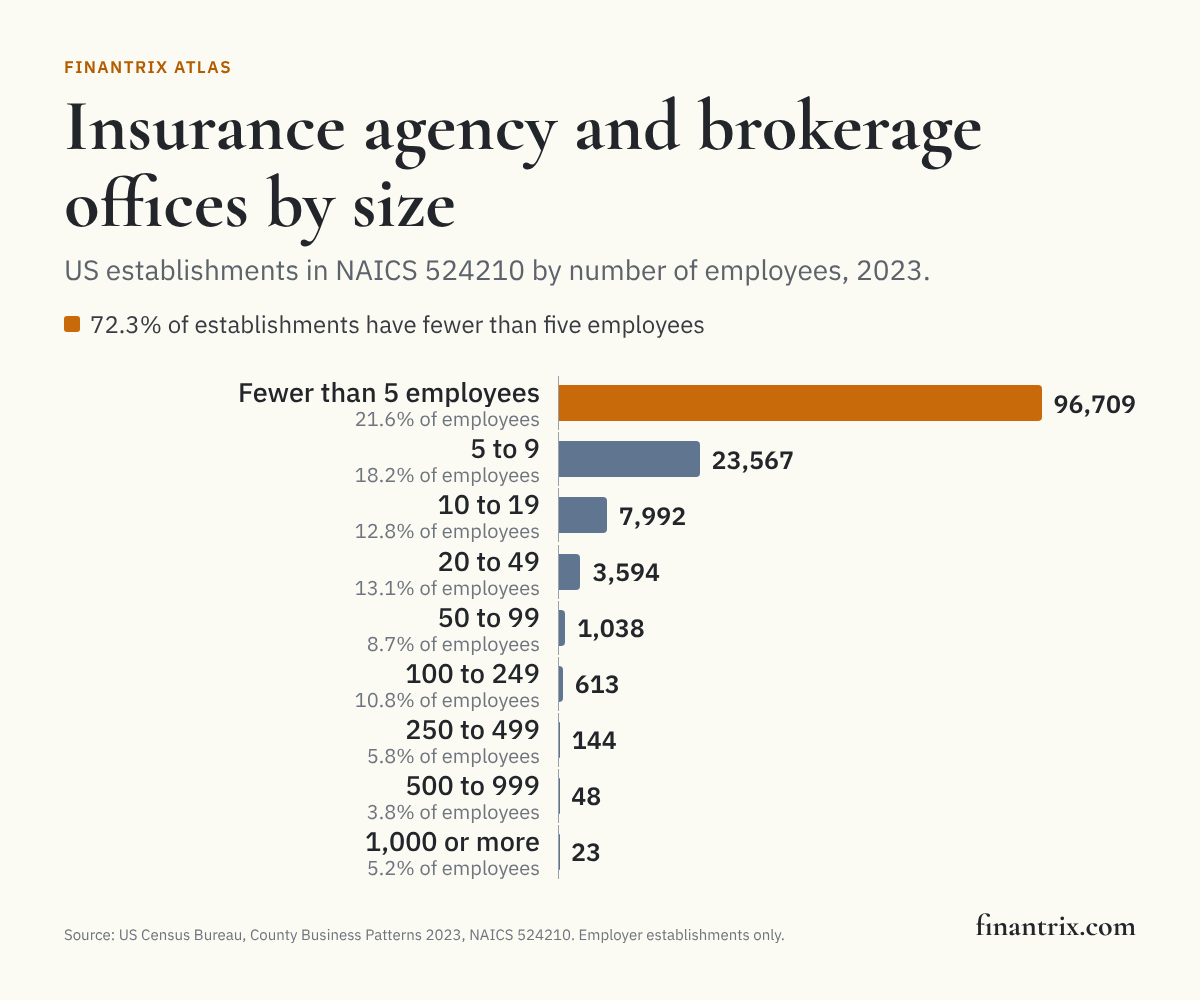
- According to Census Bureau data, 72.3% of those establishments had fewer than five employees, while the 828 with 100 or more employees, 0.6% of the total, employed 25.6% of the industry's workers.
- California has the most insurance agency establishments, 13,919, according to the Census Bureau; per resident, North Dakota has the most, 82.2 per 100,000 residents.
- The typical establishment is small: the industry averages 6.1 employees per establishment in Census data, from 3.6 in Wyoming to 14.5 in the District of Columbia.
72.3% of the 133,728 insurance agency and brokerage establishments in the United States had fewer than five employees in 2023, according to the Census Bureau's County Business Patterns. The 828 with 100 or more employees, 0.6% of the total, employed 25.6% of the industry's 818,561 workers, more people than the 96,709 smallest employed between them. California has the most establishments, 13,919, and North Dakota the most per resident, 82.2 per 100,000 residents, according to Census Bureau data.
An establishment is one office: an agency or brokerage with several locations counts once for each. The figures cover employer establishments in the industry the Census Bureau codes as insurance agencies and brokerages, NAICS 524210.
Insurance agencies and brokerages by state, 2023
Ranked by the number of establishments. Employees are for the pay period including March 12, as the Census Bureau counts them.
| Rank | State | Establishments | Employees | Employees per establishment | Share with fewer than five employees | Establishments per 100,000 residents | Source |
|---|---|---|---|---|---|---|---|
| 1 | California | 13,919 | 83,259 | 6.0 | 74.9% | 35.5 | Census, Census |
| 2 | Texas | 12,210 | 78,885 | 6.5 | 71.6% | 39.7 | Census, Census |
| 3 | Florida | 10,837 | 69,499 | 6.4 | 73.3% | 47.3 | Census, Census |
| 4 | New York | 6,336 | 51,373 | 8.1 | 67.9% | 32.0 | Census, Census |
| 5 | Illinois | 5,679 | 40,486 | 7.1 | 73.4% | 45.0 | Census, Census |
| 6 | Pennsylvania | 4,773 | 34,382 | 7.2 | 66.6% | 36.7 | Census, Census |
| 7 | Georgia | 4,637 | 27,468 | 5.9 | 71.6% | 41.9 | Census, Census |
| 8 | Ohio | 4,382 | 27,942 | 6.4 | 70.0% | 37.1 | Census, Census |
| 9 | North Carolina | 3,914 | 26,949 | 6.9 | 72.4% | 36.0 | Census, Census |
| 10 | Michigan | 3,680 | 26,370 | 7.2 | 65.7% | 36.6 | Census, Census |
| 11 | Missouri | 3,330 | 19,059 | 5.7 | 76.9% | 53.7 | Census, Census |
| 12 | Minnesota | 3,131 | 16,007 | 5.1 | 75.9% | 54.4 | Census, Census |
| 13 | Colorado | 3,124 | 15,146 | 4.8 | 76.6% | 52.8 | Census, Census |
| 14 | Indiana | 2,965 | 17,060 | 5.8 | 75.7% | 43.1 | Census, Census |
| 15 | Arizona | 2,845 | 14,065 | 4.9 | 78.7% | 38.2 | Census, Census |
| 16 | Virginia | 2,728 | 14,244 | 5.2 | 72.5% | 31.2 | Census, Census |
| 17 | Washington | 2,598 | 16,046 | 6.2 | 74.0% | 33.1 | Census, Census |
| 18 | New Jersey | 2,588 | 22,795 | 8.8 | 66.1% | 27.5 | Census, Census |
| 19 | Wisconsin | 2,587 | 12,120 | 4.7 | 75.0% | 43.6 | Census, Census |
| 20 | Tennessee | 2,565 | 14,337 | 5.6 | 71.8% | 35.9 | Census, Census |
| 21 | Oklahoma | 2,191 | 8,548 | 3.9 | 78.1% | 53.9 | Census, Census |
| 22 | Louisiana | 2,136 | 11,634 | 5.4 | 64.8% | 46.4 | Census, Census |
| 23 | Massachusetts | 2,065 | 19,519 | 9.5 | 60.0% | 29.2 | Census, Census |
| 24 | South Carolina | 2,042 | 9,737 | 4.8 | 69.1% | 37.9 | Census, Census |
| 25 | Iowa | 1,993 | 9,839 | 4.9 | 77.3% | 62.0 | Census, Census |
| 26 | Kansas | 1,947 | 14,227 | 7.3 | 76.6% | 66.0 | Census, Census |
| 27 | Maryland | 1,855 | 12,881 | 6.9 | 65.9% | 29.9 | Census, Census |
| 28 | Kentucky | 1,771 | 9,060 | 5.1 | 69.3% | 38.9 | Census, Census |
| 29 | Alabama | 1,737 | 8,170 | 4.7 | 70.5% | 33.9 | Census, Census |
| 30 | Utah | 1,659 | 9,491 | 5.7 | 76.2% | 48.1 | Census, Census |
| 31 | Oregon | 1,644 | 7,992 | 4.9 | 74.2% | 38.7 | Census, Census |
| 32 | Nebraska | 1,545 | 6,715 | 4.3 | 78.3% | 77.7 | Census, Census |
| 33 | Arkansas | 1,517 | 6,129 | 4.0 | 77.1% | 49.4 | Census, Census |
| 34 | Nevada | 1,247 | 5,318 | 4.3 | 75.8% | 38.8 | Census, Census |
| 35 | Mississippi | 1,233 | 5,336 | 4.3 | 75.0% | 41.9 | Census, Census |
| 36 | Connecticut | 1,229 | 9,820 | 8.0 | 66.5% | 33.8 | Census, Census |
| 37 | Idaho | 943 | 3,630 | 3.8 | 76.6% | 47.9 | Census, Census |
| 38 | New Mexico | 755 | 3,224 | 4.3 | 71.7% | 35.6 | Census, Census |
| 39 | South Dakota | 745 | 3,229 | 4.3 | 74.2% | 81.2 | Census, Census |
| 40 | North Dakota | 647 | 2,389 | 3.7 | 82.7% | 82.2 | Census, Census |
| 41 | Montana | 645 | 2,740 | 4.2 | 75.8% | 57.0 | Census, Census |
| 42 | West Virginia | 637 | 2,898 | 4.5 | 73.3% | 36.0 | Census, Census |
| 43 | Maine | 459 | 3,470 | 7.6 | 63.6% | 32.7 | Census, Census |
| 44 | New Hampshire | 422 | 2,911 | 6.9 | 65.2% | 30.1 | Census, Census |
| 45 | Hawaii | 385 | 1,984 | 5.2 | 74.8% | 26.8 | Census, Census |
| 46 | Wyoming | 343 | 1,238 | 3.6 | 75.2% | 58.7 | Census, Census |
| 47 | Rhode Island | 320 | 2,406 | 7.5 | 67.2% | 29.1 | Census, Census |
| 48 | Delaware | 315 | 2,412 | 7.7 | 61.3% | 30.4 | Census, Census |
| 49 | Vermont | 208 | 1,601 | 7.7 | 63.9% | 32.1 | Census, Census |
| 50 | Alaska | 177 | 1,243 | 7.0 | 58.8% | 24.1 | Census, Census |
| 51 | District of Columbia | 88 | 1,278 | 14.5 | 54.5% | 12.9 | Census, Census |
Download this table (CSV), free. The full dataset, every state with payroll, the Census Bureau's noise flags, the count of establishments in every size class and the population used, is one email away.
How big insurance agencies are
Across the country, by the number of employees at each establishment, from Census Bureau data:
| Employees at the establishment | Establishments | Share of establishments | Employees | Share of employees | Source |
|---|---|---|---|---|---|
| Fewer than 5 employees | 96,709 | 72.3% | 176,651 | 21.6% | Census |
| 5 to 9 | 23,567 | 17.6% | 149,360 | 18.2% | Census |
| 10 to 19 | 7,992 | 6.0% | 104,387 | 12.8% | Census |
| 20 to 49 | 3,594 | 2.7% | 107,485 | 13.1% | Census |
| 50 to 99 | 1,038 | 0.8% | 70,933 | 8.7% | Census |
| 100 to 249 | 613 | 0.5% | 88,184 | 10.8% | Census |
| 250 to 499 | 144 | 0.1% | 47,576 | 5.8% | Census |
| 500 to 999 | 48 | 0.0% | 31,466 | 3.8% | Census |
| 1,000 or more | 23 | 0.0% | 42,519 | 5.2% | Census |
| All establishments | 133,728 | 100.0% | 818,561 | 100.0% | Census |
The industry averages 6.1 employees per establishment, according to the Census Bureau. By state, the average runs from 3.6 in Wyoming to 14.5 in the District of Columbia.
Where there are the most agencies per resident
Nationally there are 39.7 insurance agency and brokerage establishments per 100,000 residents, by Finantrix Atlas's calculation from Census Bureau data. The five with the most and the five with the fewest, of the fifty states and DC:
| State | Establishments per 100,000 residents | Establishments | Residents | Source |
|---|---|---|---|---|
| North Dakota | 82.2 | 647 | 787,071 | Census, Census |
| South Dakota | 81.2 | 745 | 917,739 | Census, Census |
| Nebraska | 77.7 | 1,545 | 1,988,172 | Census, Census |
| Kansas | 66.0 | 1,947 | 2,949,749 | Census, Census |
| Iowa | 62.0 | 1,993 | 3,214,739 | Census, Census |
| Rhode Island | 29.1 | 320 | 1,101,183 | Census, Census |
| New Jersey | 27.5 | 2,588 | 9,395,315 | Census, Census |
| Hawaii | 26.8 | 385 | 1,434,950 | Census, Census |
| Alaska | 24.1 | 177 | 734,654 | Census, Census |
| District of Columbia | 12.9 | 88 | 682,559 | Census, Census |
California, Texas and Florida together hold 27.6% of the country's establishments and 27.6% of its residents, according to Census Bureau data. Per resident, the count runs from 12.9 in the District of Columbia to 82.2 in North Dakota.
What this means for technology buyers
Most agency offices are a handful of people, while the 828 largest employ 25.6% of the industry's workers, according to Census Bureau data: two very different buyers of the same kinds of systems. These guides compare the options:
- Agency management systems for independent agencies: the system of record for clients, policies and commissions.
- Comparative raters for personal lines: quoting several carriers at once for auto and home.
- Comparative raters for commercial lines: the same for small business coverage.
- Commission calculation software: how carriers pay the agencies that sell for them.
Mapping the business? The P&C Insurance Business Architecture Toolkit maps what a property and casualty insurer does, including the distribution it runs through agencies.
More from Finantrix Atlas
- US-listed property and casualty insurers by premiums
- US-listed life insurers by assets
- Financial services share of GDP by state
- Registered investment advisers by state
How this list was built
The figures are from the Census Bureau's County Business Patterns for 2023, read from its national and state files for NAICS 524210, all legal forms of organization together. The states and DC add up exactly to the national file, in establishments and in employees, and the national size classes add up to the national count.
Residents are the Census Bureau's population estimates for 2023, from the vintage 2025 state file; the states and DC add up to its US total. Establishments per resident are computed by Finantrix Atlas.
The Bureau adds statistical noise to each establishment's employment and payroll before tabulating, to protect confidentiality, and flags each figure by how much noise it carries; establishment counts carry none, according to its methodology. Every employee figure on this page carries the low or moderate noise flag. A figure the Bureau withholds or flags as high noise would show as "not published", and none here does.
The catalog listed the Bureau of Labor Statistics as a second source. Its data site and API could not be reached when this page was built, so the page uses no BLS figure.
Limits
- Offices, not firms. An establishment is a location. A brokerage with many offices is many establishments, and the size classes describe offices, not companies.
- Employers only. County Business Patterns leaves out self-employed agents with no paid employees; the Census Bureau counts them separately, in Nonemployer Statistics.
- Agencies and brokerages, not carriers. NAICS 524210 is establishments primarily engaged in selling insurance and annuities as agents or brokers. An insurer's own offices are classed with the carriers and are not counted here.
- Noise in employment. Employee counts carry the Census Bureau's noise, up to five percent for any figure on this page; establishment counts carry none.
- One year. The data year is 2023, the newest County Business Patterns the Census Bureau has published; employment is for the pay period including March 12.
Cite this
Free to quote, cite and republish, including the chart, with credit to Finantrix Atlas and a link to this page.
72.3% of US insurance agency and brokerage establishments had fewer than five employees in 2023, according to a Finantrix Atlas analysis of Census Bureau County Business Patterns data.
The 828 US insurance agency and brokerage establishments with 100 or more employees employed 25.6% of the industry's workers in 2023, according to Finantrix Atlas, from Census Bureau data.
Suggested citation: Finantrix Atlas, "Insurance Agencies and Brokerages by State," 2023 data, from US Census Bureau, County Business Patterns, and US Census Bureau, Population Estimates. https://www.finantrix.com/articles/insurance-agencies-by-state
Embed the chart:
<a href="https://www.finantrix.com/articles/insurance-agencies-by-state"><img src="https://www.finantrix.com/atlas/insurance-agencies-by-state.png" alt="US insurance agency and brokerage establishments by number of employees, from Census Bureau data, by Finantrix Atlas"></a>
<p>Chart: <a href="https://www.finantrix.com/articles/insurance-agencies-by-state">Finantrix Atlas</a>, from US Census Bureau County Business Patterns.</p>
Frequently asked questions
Q: How many insurance agencies are there in the US? A: 133,728 insurance agency and brokerage establishments with paid employees in 2023, according to the Census Bureau's County Business Patterns. Each office counts once.
Q: How many people work at insurance agencies? A: 818,561 employees in 2023, according to the Census Bureau, an average of 6.1 per establishment.
Q: Which state has the most insurance agencies? A: California, with 13,919 establishments in 2023, according to the Census Bureau. Per resident, North Dakota has the most, 82.2 per 100,000 residents.
Q: Are most insurance agencies small? A: Yes. 72.3% of insurance agency and brokerage establishments had fewer than five employees in 2023, according to Census Bureau data.
Download the data
The 51 rows on this page (CSV), free. The full dataset has all 51 rows, as of December 31, 2023; we email you a link.
Frequently Asked Questions
How many insurance agencies are there in the US?
133,728 insurance agency and brokerage establishments with paid employees in 2023, according to the Census Bureau's County Business Patterns. Each office counts once.
How many people work at insurance agencies?
818,561 employees in 2023, according to the Census Bureau, an average of 6.1 per establishment.
Which state has the most insurance agencies?
California, with 13,919 establishments in 2023, according to the Census Bureau. Per resident, North Dakota has the most, 82.2 per 100,000 residents.
Are most insurance agencies small?
Yes. 72.3% of insurance agency and brokerage establishments had fewer than five employees in 2023, according to Census Bureau data.