
Key Takeaways
- Among US-listed property and casualty insurers, Progressive earned the most net premiums in 2025, $81.7 billion, according to SEC filings.
- Progressive, Allstate and Chubb together earned 44% of the $450 billion the 60 listed insurers reported to the SEC.
- The ranking leaves out mutual and reciprocal insurers, which do not file with the SEC, and Berkshire Hathaway, which reports premiums only by segment.
- Premiums are worldwide, as each company reports them, for its fiscal year closest to calendar 2025.
Among US-listed property and casualty insurers, Progressive earned the most net premiums in 2025: $81.7 billion, according to the financial data it files with the SEC. Allstate and Chubb follow. The 60 listed insurers in the SEC's data earned $450 billion between them, and the first three earned 44% of it.
This is a ranking of publicly traded insurers, not of the whole market. Mutual and reciprocal insurers, several of them among the biggest in the country, do not file financial statements with the SEC, and Berkshire Hathaway reports its insurance premiums only by business segment. They are not in it.
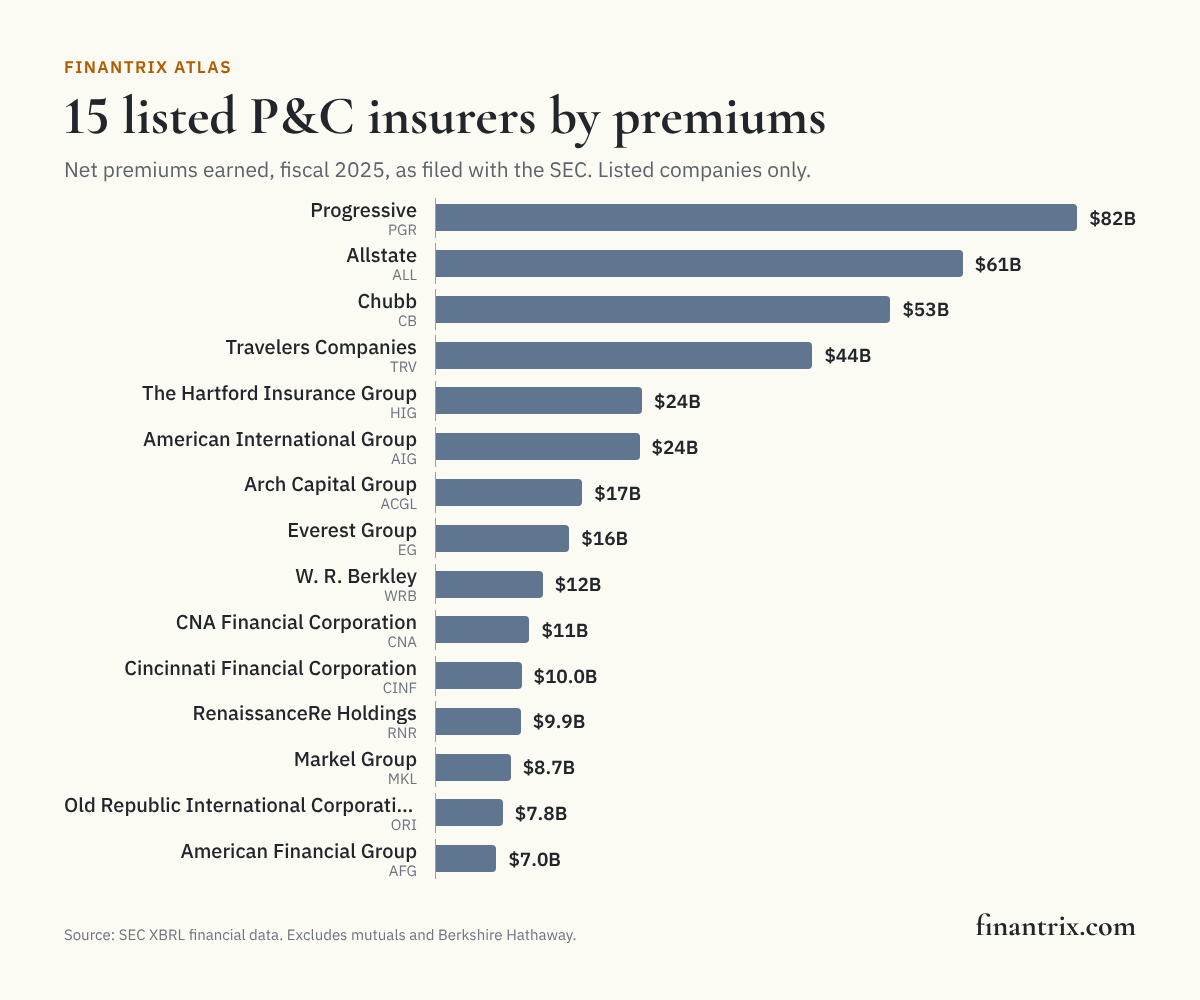
30 US-listed property and casualty insurers by premiums
Insurers are ranked by net premiums earned, as each tagged it in the financial statements it filed with the SEC for its fiscal year closest to calendar 2025. Premiums are worldwide and net of reinsurance ceded.
| Rank | Insurer | Ticker | Net premiums earned | Share of listed total | Fiscal year end | Source |
|---|---|---|---|---|---|---|
| 1 | Progressive Corp. | PGR | $81.7 billion | 18.1% | December 31, 2025 | SEC |
| 2 | Allstate Corp. | ALL | $61.4 billion | 13.6% | December 31, 2025 | SEC |
| 3 | Chubb Limited | CB | $53.0 billion | 11.8% | December 31, 2025 | SEC |
| 4 | Travelers Companies, Inc. | TRV | $43.9 billion | 9.8% | December 31, 2025 | SEC |
| 5 | The Hartford Insurance Group, Inc. | HIG | $24.0 billion | 5.3% | December 31, 2025 | SEC |
| 6 | American International Group, Inc. | AIG | $23.8 billion | 5.3% | December 31, 2025 | SEC |
| 7 | Arch Capital Group Ltd. | ACGL | $17.1 billion | 3.8% | December 31, 2025 | SEC |
| 8 | Everest Group, Ltd. | EG | $15.6 billion | 3.5% | December 31, 2025 | SEC |
| 9 | W. R. Berkley Corp. | WRB | $12.4 billion | 2.8% | December 31, 2025 | SEC |
| 10 | CNA Financial Corporation | CNA | $10.9 billion | 2.4% | December 31, 2025 | SEC |
| 11 | Cincinnati Financial Corporation | CINF | $10.0 billion | 2.2% | December 31, 2025 | SEC |
| 12 | RenaissanceRe Holdings Ltd. | RNR | $9.9 billion | 2.2% | December 31, 2025 | SEC |
| 13 | Markel Group Inc. | MKL | $8.7 billion | 1.9% | December 31, 2025 | SEC |
| 14 | Old Republic International Corporation | ORI | $7.8 billion | 1.7% | December 31, 2025 | SEC |
| 15 | American Financial Group, Inc. | AFG | $7.0 billion | 1.6% | December 31, 2025 | SEC |
| 16 | Hanover Insurance Group, Inc. | THG | $6.2 billion | 1.4% | December 31, 2025 | SEC |
| 17 | Axis Capital Holdings Limited | AXS | $5.7 billion | 1.3% | December 31, 2025 | SEC |
| 18 | Mercury General Corporation | MCY | $5.5 billion | 1.2% | December 31, 2025 | SEC |
| 19 | Selective Insurance Group, Inc. | SIGI | $4.8 billion | 1.1% | December 31, 2025 | SEC |
| 20 | Kemper Corporation | KMPR | $4.4 billion | 1.0% | December 31, 2025 | SEC |
| 21 | Aspen Insurance Holdings Limited | AHL-PD | $2.8 billion | 0.6% | December 31, 2025 | SEC |
| 22 | SiriusPoint Ltd. | SPNT | $2.6 billion | 0.6% | December 31, 2025 | SEC |
| 23 | Pelagos Insurance Capital Ltd | PLGO | $2.3 billion | 0.5% | December 31, 2025 | SEC |
| 24 | Hamilton Insurance Group, Ltd. | HG | $2.1 billion | 0.5% | December 31, 2025 | SEC |
| 25 | White Mountains Insurance Group, Ltd. | WTM | $1.8 billion | 0.4% | December 31, 2025 | SEC |
| 26 | RLI Corp. | RLI | $1.6 billion | 0.4% | December 31, 2025 | SEC |
| 27 | Kinsale Capital Group, Inc. | KNSL | $1.6 billion | 0.3% | December 31, 2025 | SEC |
| 28 | Universal Insurance Holdings, Inc. | UVE | $1.4 billion | 0.3% | December 31, 2025 | SEC |
| 29 | Root, Inc. | ROOT | $1.4 billion | 0.3% | December 31, 2025 | SEC |
| 30 | Skyward Specialty Insurance Group, Inc. | SKWD | $1.3 billion | 0.3% | December 31, 2025 | SEC |
Download this table (CSV), free. The full dataset, every listed insurer in the SEC's data with its premiums, filing and identifiers, is one email away.
How concentrated the listed market is
- The first three listed insurers earned 44% of the premiums the 60 listed insurers reported to the SEC, and the first ten 76%.
- The thirtieth earned $1.3 billion.
- Loews Corp. is left out because it consolidates a listed insurer whose premiums are already in the table; the two report the same figure to the SEC.
What this means for technology buyers
An insurer writing premiums at this scale runs policy, rating and claims systems that have to change with every filing season. These guides compare the options:
- Document management for insurance claims: the records behind every loss, from first notice to payment.
- Claims fraud detection for auto insurers: the biggest line for most personal insurers.
- Regulatory compliance software for insurers: rate filings, statutory reporting and market conduct.
Mapping the business? The P&C Insurance Business Architecture Toolkit sets out what a property and casualty insurer does, and the Property and Casualty Insurance Value Streams show how that work runs end to end.
More from Finantrix Atlas
- Life and annuity insurers by assets
- Largest commercial health insurers
- Largest Medicare Advantage insurers
How this list was built
The universe is every company EDGAR files under SIC codes 6331 and 6351 (fire, marine and casualty insurance, and surety) whose shares trade on a US exchange, with the net premiums earned it reported in the SEC's XBRL financial data for 2025. The SEC aligns each company's fiscal year to the nearest calendar year.
Limits
- Listed companies only. Mutual and reciprocal insurers file no financial statements with the SEC, and some of the largest property and casualty writers are organized that way.
- Berkshire Hathaway is missing. Its insurance businesses are large, but it reports their premiums only by segment, so there is no company-level figure to rank.
- Worldwide, not US. Premiums cover every country an insurer writes in, including reinsurance assumed.
- Surety included. The surety code brings in mortgage, financial guaranty and surety insurers alongside property and casualty writers.
- As tagged. Figures are what each company tagged in its filing; a company that used a different tag for its premiums is not in the table.
Cite this
Free to quote, cite and republish, including the chart, with credit to Finantrix Atlas and a link to this page.
Among US-listed property and casualty insurers, Progressive earned the most net premiums in 2025, $81.7 billion, according to a Finantrix Atlas analysis of SEC filings.
Suggested citation: Finantrix Atlas, "US-Listed Property and Casualty Insurers Ranked by Premiums," fiscal 2025, from SEC XBRL financial data. https://www.finantrix.com/articles/public-pc-insurers-by-premiums
Embed the chart:
<a href="https://www.finantrix.com/articles/public-pc-insurers-by-premiums"><img src="https://www.finantrix.com/atlas/public-pc-insurers-by-premiums.png" alt="US-listed property and casualty insurers by premiums, from Finantrix Atlas"></a>
<p>Chart: <a href="https://www.finantrix.com/articles/public-pc-insurers-by-premiums">Finantrix Atlas</a>, from SEC filings.</p>
Frequently asked questions
Q: Which publicly traded property and casualty insurer earns the most premiums? A: Progressive, with $81.7 billion in net premiums earned for 2025, according to its SEC filings. Mutual insurers and Berkshire Hathaway are not in the comparison.
Q: Why are some well-known insurers missing? A: Mutual and reciprocal insurers are owned by their policyholders and file no financial statements with the SEC. Berkshire Hathaway files, but reports insurance premiums only by segment.
Download the data
The 30 rows on this page (CSV), free. The full dataset has all 60 rows, as of December 31, 2025; we email you a link.
Frequently Asked Questions
Which publicly traded property and casualty insurer earns the most premiums?
Progressive, with $81.7 billion in net premiums earned for 2025, according to its SEC filings. Mutual insurers and Berkshire Hathaway are not in the comparison.
Why are some well-known insurers missing?
Mutual and reciprocal insurers are owned by their policyholders and file no financial statements with the SEC. Berkshire Hathaway files, but reports insurance premiums only by segment.