
Key Takeaways
- Kaiser Permanente collects the most premiums in the fully insured commercial health market, $64.0 billion in 2024, according to CMS data.
- According to CMS, insurers earned $512 billion in commercial health premiums in 2024; the largest five groups took 46% of it.
- Nonprofit insurers, most of them Blue plans and Kaiser Permanente, earned 51% of commercial premiums reported to CMS.
- Across the market, insurers reported paying 88% of premiums back out in claims.
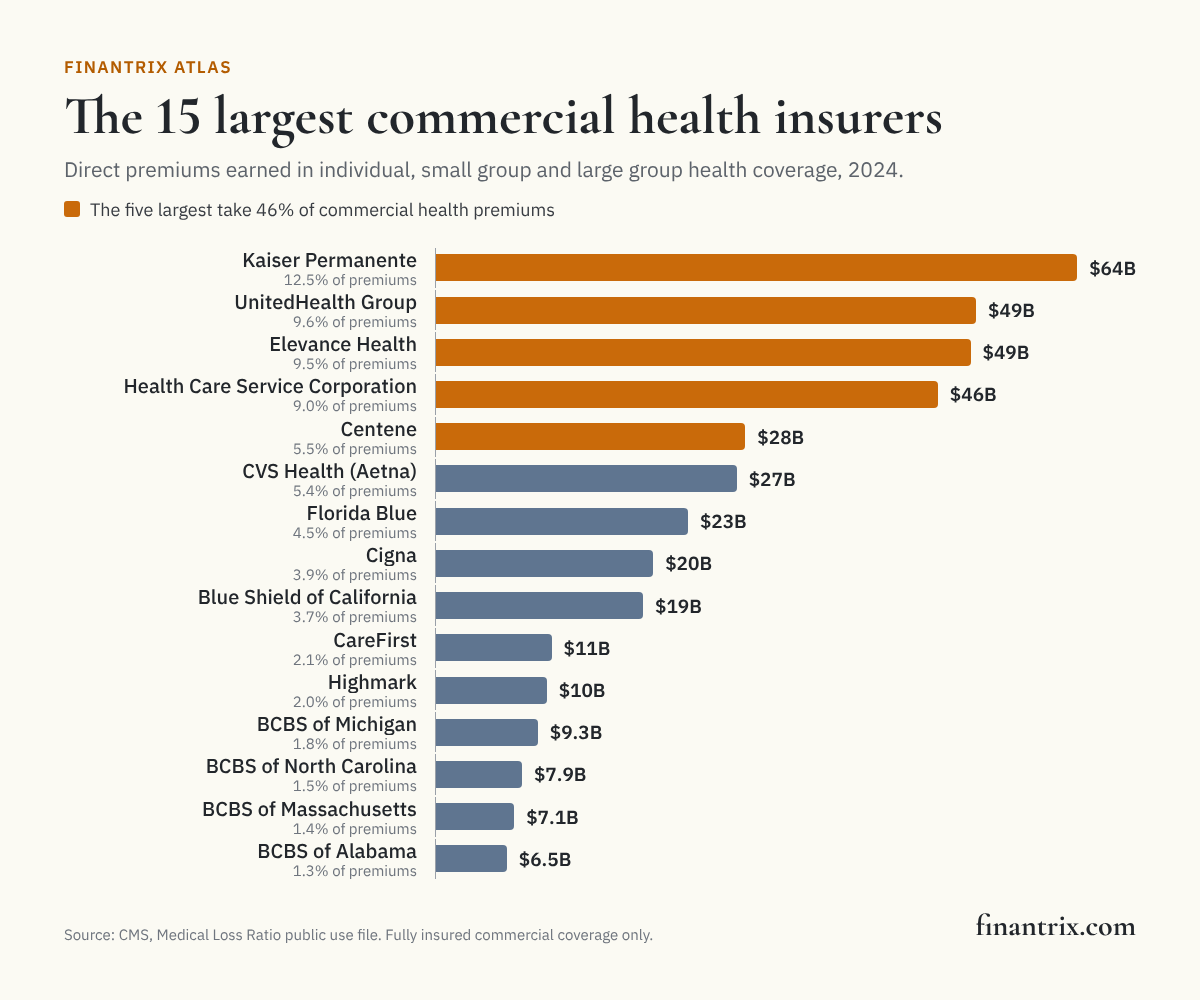
Kaiser Permanente collects more premiums than any other insurer in the fully insured commercial health market: $64.0 billion in 2024, according to CMS data. UnitedHealth Group and Elevance Health follow. Insurers earned $512 billion in commercial health premiums that year, and the largest five groups took 46% of it.
Every figure is from the Medical Loss Ratio reports insurers file with CMS for each state they sell in, as published in CMS's public use file for 2024.
The 30 largest commercial health insurers
Insurers are ranked by direct premiums earned in comprehensive medical coverage sold to individuals, small employers and large employers, with each insurance company counted under the group it reports belonging to. The last column is the share of those premiums the group reported paying out in claims.
| Rank | Insurer | Commercial premiums | Share | Individual | Small group | Large group | Claims as a share of premiums | Source |
|---|---|---|---|---|---|---|---|---|
| 1 | Kaiser Permanente | $64.0 billion | 12.5% | $7.2 billion | $5.8 billion | $51.0 billion | 92% | CMS |
| 2 | UnitedHealth Group | $49.4 billion | 9.6% | $9.4 billion | $12.8 billion | $27.2 billion | 81% | CMS |
| 3 | Elevance Health | $48.9 billion | 9.5% | $8.4 billion | $9.4 billion | $31.1 billion | 86% | CMS |
| 4 | Health Care Service Corporation | $45.9 billion | 9.0% | $13.9 billion | $8.9 billion | $23.1 billion | 91% | CMS |
| 5 | Centene | $28.3 billion | 5.5% | $25.1 billion | $803 million | $2.4 billion | 79% | CMS |
| 6 | CVS Health (Aetna) | $27.5 billion | 5.4% | $10.2 billion | $775 million | $16.5 billion | 91% | CMS |
| 7 | Florida Blue | $23.0 billion | 4.5% | $14.0 billion | $1.9 billion | $7.1 billion | 87% | CMS |
| 8 | Cigna | $19.9 billion | 3.9% | $3.6 billion | $422 million | $15.8 billion | 88% | CMS |
| 9 | Blue Shield of California | $18.9 billion | 3.7% | $7.9 billion | $3.8 billion | $7.2 billion | 87% | CMS |
| 10 | CareFirst | $10.6 billion | 2.1% | $1.4 billion | $2.2 billion | $7.0 billion | 84% | CMS |
| 11 | Highmark | $10.1 billion | 2.0% | $2.0 billion | $1.5 billion | $6.6 billion | 93% | CMS |
| 12 | Blue Cross Blue Shield of Michigan | $9.3 billion | 1.8% | $1.1 billion | $1.7 billion | $6.5 billion | 90% | CMS |
| 13 | Blue Cross and Blue Shield of North Carolina | $7.9 billion | 1.5% | $3.6 billion | $1.3 billion | $3.0 billion | 86% | CMS |
| 14 | Blue Cross Blue Shield of Massachusetts | $7.1 billion | 1.4% | $241 million | $1.3 billion | $5.6 billion | 92% | CMS |
| 15 | Blue Cross and Blue Shield of Alabama | $6.5 billion | 1.3% | $1.9 billion | $1.2 billion | $3.4 billion | 93% | CMS |
| 16 | Oscar Health | $6.4 billion | 1.3% | $6.4 billion | $6 million | $0 | 108% | CMS |
| 17 | Regence | $5.9 billion | 1.2% | $840 million | $1.5 billion | $3.6 billion | 90% | CMS |
| 18 | Horizon Blue Cross Blue Shield of New Jersey | $5.6 billion | 1.1% | $2.3 billion | $1.4 billion | $2.0 billion | 112% | CMS |
| 19 | Independence Blue Cross | $5.1 billion | 1.0% | $1.7 billion | $1.3 billion | $2.1 billion | 82% | CMS |
| 20 | BlueCross BlueShield of South Carolina | $4.6 billion | 0.9% | $2.2 billion | $462 million | $1.9 billion | 85% | CMS |
| 21 | Premera Blue Cross | $4.4 billion | 0.9% | $588 million | $500 million | $3.3 billion | 89% | CMS |
| 22 | Blue Cross and Blue Shield of Louisiana | $4.2 billion | 0.8% | $1.3 billion | $1.1 billion | $1.8 billion | 84% | CMS |
| 23 | BlueCross BlueShield of Tennessee | $4.1 billion | 0.8% | $971 million | $665 million | $2.4 billion | 87% | CMS |
| 24 | Wellmark | $3.9 billion | 0.8% | $876 million | $954 million | $2.1 billion | 85% | CMS |
| 25 | EmblemHealth | $3.7 billion | 0.7% | $950 million | $108 million | $2.7 billion | 83% | CMS |
| 26 | Medica | $3.6 billion | 0.7% | $1.0 billion | $442 million | $2.1 billion | 92% | CMS |
| 27 | Intermountain Health (SelectHealth) | $3.5 billion | 0.7% | $1.9 billion | $654 million | $1.0 billion | 87% | CMS |
| 28 | Harvard Pilgrim Health Care | $3.4 billion | 0.7% | $411 million | $1.0 billion | $1.9 billion | 95% | CMS |
| 29 | Corewell Health | $3.2 billion | 0.6% | $871 million | $538 million | $1.8 billion | 92% | CMS |
| 30 | Blue Cross and Blue Shield of Minnesota | $2.9 billion | 0.6% | $338 million | $617 million | $2.0 billion | 93% | CMS |
Download this table (CSV), free, with the group affiliations and companies behind each name. The full dataset, every insurer's filing state by state with its premiums, claims and covered lives, is one email away.
How the commercial market divides
- The largest five groups take 46% of commercial health premiums reported to CMS, and the largest ten 66%. The smallest group in the table earned $2.9 billion.
- Large employer coverage is 54% of the market, small employer coverage 15% and individual coverage 31%, according to CMS data. Centene leads the individual market.
- Nonprofit insurers, most of them Blue plans and Kaiser Permanente, earned 51% of the premiums.
- Across the market, insurers reported paying 88% of premiums back out in claims.
- The filings come from 484 insurance companies in 184 groups.
What this means for technology buyers
A commercial health plan runs on claims, billing and compliance systems that have to work state by state. These guides compare the options:
- Claims management systems for health insurers: adjudicating and paying claims at plan scale.
- Billing and invoicing platforms for insurance carriers: premium billing to employers and individuals.
- Regulatory compliance software for insurers: filings like the ones this page is built from.
Mapping the business? The Health Insurance Capability Model sets out what a health plan does, and the Health Insurance Value Streams show how that work runs end to end.
More from Finantrix Atlas
How this list was built
The universe is every Medical Loss Ratio report in CMS's public use file for 2024. Every insurer selling fully insured comprehensive medical coverage files one for each state it sells in. Premiums are direct premiums earned in the individual, small group and large group markets for the year. Each company is counted under the group affiliation it reports, with the largest groups given the names their customers know. The state filings were checked against each insurer's own total across states.
Limits
- Commercial insured coverage only. Medicare Advantage, Medicaid managed care and employer plans that pay their own claims, with an insurer only administering them, are not in these filings. An insurer's total health revenue can be several times what is shown here.
- Claims share is not the regulatory MLR. The legal medical loss ratio adds spending on quality, deducts taxes and fees, averages three years and is calculated state by state and market by market. The column here is simpler: claims over premiums for one year.
- As filed. Figures are as insurers reported them to CMS. Covered lives are in the dataset as filed, including at least one figure that looks misreported, so the table leaves them out.
- Grouping is a judgment. The group affiliations and companies behind each name are in the free table.
Cite this
Free to quote, cite and republish, including the chart, with credit to Finantrix Atlas and a link to this page.
Kaiser Permanente earned $64.0 billion in fully insured commercial health premiums in 2024, the most of any insurer, according to a Finantrix Atlas analysis of CMS Medical Loss Ratio data.
The five largest insurance groups took 46% of the $512 billion in commercial health premiums reported to CMS for 2024, according to Finantrix Atlas.
Suggested citation: Finantrix Atlas, "Largest Commercial Health Insurers by Premiums," 2024, from CMS Medical Loss Ratio public use files. https://www.finantrix.com/articles/largest-health-insurers-mlr
Embed the chart:
<a href="https://www.finantrix.com/articles/largest-health-insurers-mlr"><img src="https://www.finantrix.com/atlas/largest-health-insurers-mlr.png" alt="The largest commercial health insurers by premiums, from Finantrix Atlas"></a>
<p>Chart: <a href="https://www.finantrix.com/articles/largest-health-insurers-mlr">Finantrix Atlas</a>, from CMS Medical Loss Ratio data.</p>
Frequently asked questions
Q: Which health insurer collects the most commercial premiums? A: Kaiser Permanente, with $64.0 billion in fully insured individual and employer premiums in 2024, according to CMS data.
Q: How big is the commercial health insurance market? A: According to CMS, insurers earned $512 billion in fully insured commercial health premiums in 2024. Self-funded employer plans are not included.
Q: What is a medical loss ratio? A: The share of premiums an insurer spends on medical care and quality improvement. Under the Affordable Care Act it must be at least 80% in the individual and small group markets and 85% in the large group market, or the insurer owes customers a rebate.
Download the data
The 30 rows on this page (CSV), free. The full dataset has all 1,710 rows, as of December 31, 2024; we email you a link.
Frequently Asked Questions
Which health insurer collects the most commercial premiums?
Kaiser Permanente, with $64.0 billion in fully insured individual and employer premiums in 2024, according to CMS data.
How big is the commercial health insurance market?
According to CMS, insurers earned $512 billion in fully insured commercial health premiums in 2024. Self-funded employer plans are not included.
What is a medical loss ratio?
The share of premiums an insurer spends on medical care and quality improvement. Under the Affordable Care Act it must be at least 80% in the individual and small group markets and 85% in the large group market, or the insurer owes customers a rebate.