
Key Takeaways
- US lenders denied 8.7% of home purchase applications they acted on in 2025, according to HMDA data, against 8.8% in 2024.
- Among the 108 lenders with at least 5,000 applications, denial rates ran from 1.1% at Flat Branch Mortgage to 32.8% at USAA Federal Savings Bank, according to HMDA data.
- Debt-to-income ratio was the reason lenders cited most often for denying a home purchase application in 2025, in 38% of denials, according to HMDA filings.
- According to the FFIEC, HMDA data alone cannot show whether a lender complies with fair lending laws; the public file has no credit scores.
Among the 108 US lenders with at least 5,000 home purchase applications in 2025, denial rates ran from 1.1% at Flat Branch Mortgage to 32.8% at USAA Federal Savings Bank, according to HMDA data. For 51% of its denials, USAA Federal Savings Bank gave an incomplete application as the principal reason, more often than any other reason. Across all lenders, 8.7% of home purchase applications were denied, against 8.8% in 2024, according to HMDA data.
A denial rate is not a finding about a lender's fairness or its standards. HMDA's public file has no credit scores, and lenders differ in who applies to them. In announcing an earlier year's data, the FFIEC said that "HMDA data alone cannot be used to determine whether a lender is complying with fair lending laws" and that "the data do not include some legitimate credit risk considerations for loan approval and loan pricing decisions."
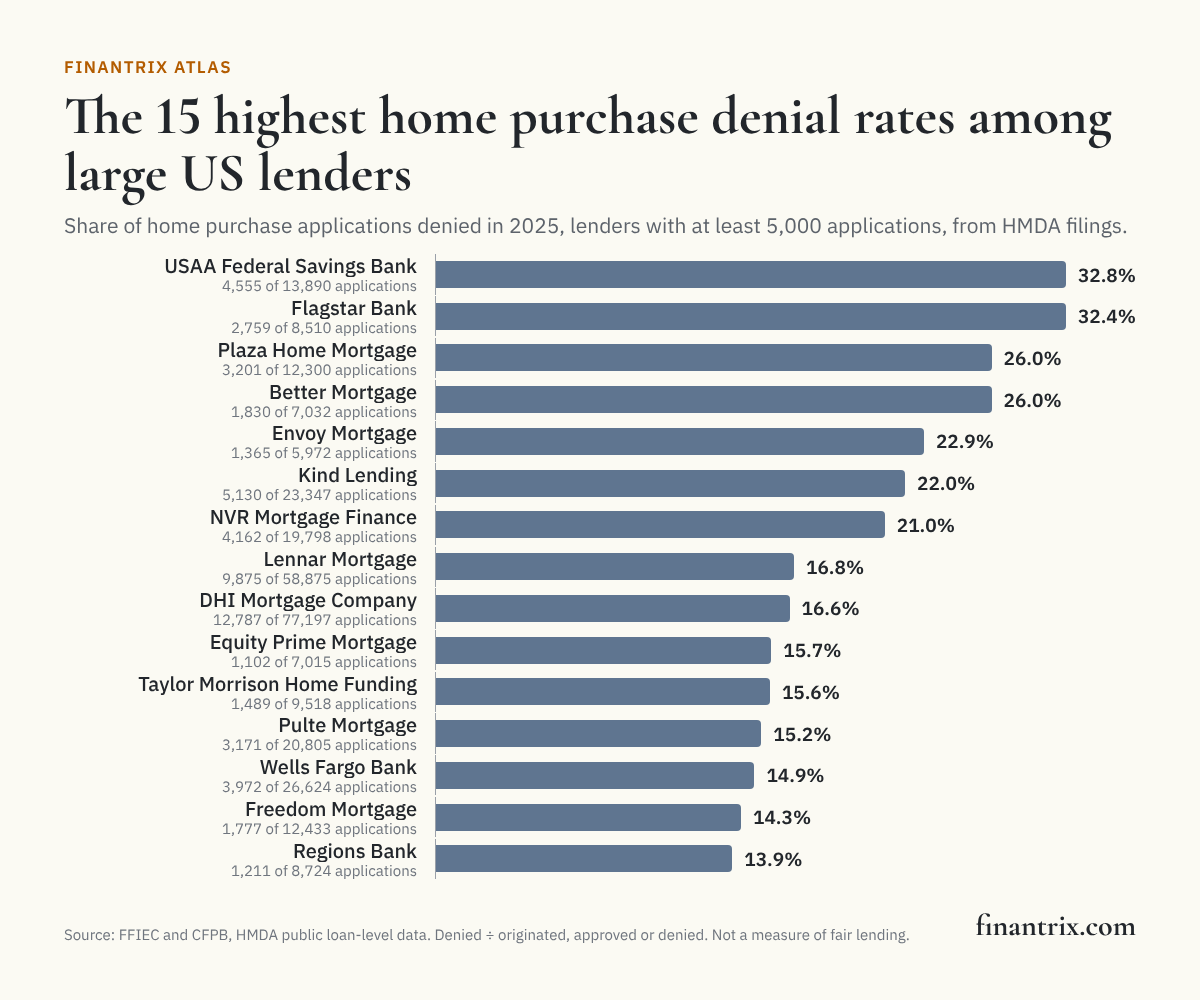
Denial rates of the 108 largest home purchase lenders
Every lender that acted on at least 5,000 home purchase applications in 2025, ranked by the share it denied. Applications are closed-end, first-lien loans to buy a site-built one-to-four family home as a principal residence. The reason column is the principal reason the lender itself reported, and the FHA, VA and USDA column shows how much of its business is government-backed.
| Rank | Lender | Type | Applications acted on | Denied | Denial rate | Most-cited denial reason | FHA, VA and USDA share of applications | Change from a year earlier | Source |
|---|---|---|---|---|---|---|---|---|---|
| 1 | USAA Federal Savings Bank | Bank | 13,890 | 4,555 | 32.8% | Credit application incomplete (51%) | 65% | +5.8 pts | FFIEC |
| 2 | Flagstar Bank | Bank | 8,510 | 2,759 | 32.4% | Credit application incomplete (59%) | 36% | +6.1 pts | FFIEC |
| 3 | Plaza Home Mortgage | Independent mortgage company | 12,300 | 3,201 | 26.0% | Other (46%) | 51% | +3.6 pts | FFIEC |
| 4 | Better Mortgage | Independent mortgage company | 7,032 | 1,830 | 26.0% | Credit application incomplete (53%) | 26% | +4.8 pts | FFIEC |
| 5 | Envoy Mortgage | Independent mortgage company | 5,972 | 1,365 | 22.9% | Credit history (77%) | 46% | −0.3 pts | FFIEC |
| 6 | Kind Lending | Independent mortgage company | 23,347 | 5,130 | 22.0% | Unverifiable information (28%) | 52% | −1.2 pts | FFIEC |
| 7 | NVR Mortgage Finance | Independent mortgage company | 19,798 | 4,162 | 21.0% | Debt-to-income ratio (55%) | 52% | +1.8 pts | FFIEC |
| 8 | Lennar Mortgage | Independent mortgage company | 58,875 | 9,875 | 16.8% | Debt-to-income ratio (59%) | 56% | +2.0 pts | FFIEC |
| 9 | DHI Mortgage Company | Bank- or credit union-affiliated | 77,197 | 12,787 | 16.6% | Debt-to-income ratio (59%) | 72% | +4.3 pts | FFIEC |
| 10 | Equity Prime Mortgage | Independent mortgage company | 7,015 | 1,102 | 15.7% | Debt-to-income ratio (32%) | 94% | +10.3 pts | FFIEC |
| 11 | Taylor Morrison Home Funding | Independent mortgage company | 9,518 | 1,489 | 15.6% | Debt-to-income ratio (51%) | 32% | +4.5 pts | FFIEC |
| 12 | Pulte Mortgage | Independent mortgage company | 20,805 | 3,171 | 15.2% | Debt-to-income ratio (66%) | 32% | +1.8 pts | FFIEC |
| 13 | Wells Fargo Bank | Bank | 26,624 | 3,972 | 14.9% | Debt-to-income ratio (63%) | 6% | −2.9 pts | FFIEC |
| 14 | Freedom Mortgage | Independent mortgage company | 12,433 | 1,777 | 14.3% | Debt-to-income ratio (37%) | 87% | +4.0 pts | FFIEC |
| 15 | Regions Bank | Bank | 8,724 | 1,211 | 13.9% | Debt-to-income ratio (35%) | 22% | +1.3 pts | FFIEC |
| 16 | loanDepot.com | Independent mortgage company | 40,566 | 5,595 | 13.8% | Debt-to-income ratio (56%) | 54% | +0.2 pts | FFIEC |
| 17 | Bank of America | Bank | 24,122 | 3,312 | 13.7% | Debt-to-income ratio (43%) | 3% | +0.7 pts | FFIEC |
| 18 | State Employees' Credit Union | Credit union | 9,895 | 1,351 | 13.7% | Debt-to-income ratio (55%) | 0% | +0.6 pts | FFIEC |
| 19 | Pennymac Loan Services | Independent mortgage company | 35,794 | 4,873 | 13.6% | Debt-to-income ratio (37%) | 39% | −0.2 pts | FFIEC |
| 20 | Rocket Mortgage | Independent mortgage company | 143,021 | 18,836 | 13.2% | Debt-to-income ratio (39%) | 28% | −0.5 pts | FFIEC |
| 21 | PNC Bank | Bank | 10,467 | 1,333 | 12.7% | Credit application incomplete (32%) | 7% | +0.8 pts | FFIEC |
| 22 | Inspire Home Loans | Independent mortgage company | 7,574 | 925 | 12.2% | Debt-to-income ratio (64%) | 70% | −1.9 pts | FFIEC |
| 23 | OCMBC | Independent mortgage company | 9,449 | 1,127 | 11.9% | Credit application incomplete (31%) | 40% | −2.0 pts | FFIEC |
| 24 | American Financial Network | Independent mortgage company | 9,265 | 1,095 | 11.8% | Debt-to-income ratio (54%) | 63% | −1.3 pts | FFIEC |
| 25 | Sun West Mortgage Company | Independent mortgage company | 5,195 | 598 | 11.5% | Debt-to-income ratio (39%) | 62% | −1.7 pts | FFIEC |
| 26 | Citizens Bank | Bank | 7,731 | 866 | 11.2% | Debt-to-income ratio (40%) | 7% | −2.2 pts | FFIEC |
| 27 | JPMorgan Chase Bank | Bank | 56,843 | 6,221 | 10.9% | Debt-to-income ratio (32%) | 5% | +0.0 pts | FFIEC |
| 28 | First National Bank of Pennsylvania | Bank | 6,189 | 661 | 10.7% | Other (51%) | 4% | +0.5 pts | FFIEC |
| 29 | Toll Brothers Mortgage | Independent mortgage company | 7,241 | 761 | 10.5% | Debt-to-income ratio (81%) | 13% | +2.5 pts | FFIEC |
| 30 | Navy Federal Credit Union | Credit union | 31,508 | 3,265 | 10.4% | Debt-to-income ratio (45%) | 52% | −5.2 pts | FFIEC |
| 31 | Newrez | Independent mortgage company | 24,702 | 2,428 | 9.8% | Debt-to-income ratio (39%) | 46% | −0.7 pts | FFIEC |
| 32 | Fifth Third Bank | Bank | 8,628 | 821 | 9.5% | Debt-to-income ratio (33%) | 11% | −0.9 pts | FFIEC |
| 33 | Homeamerican Mortgage | Bank- or credit union-affiliated | 5,887 | 549 | 9.3% | Credit history (79%) | 55% | −0.4 pts | FFIEC |
| 34 | Kbhs Home Loans | Independent mortgage company | 9,142 | 852 | 9.3% | Debt-to-income ratio (58%) | 56% | +1.8 pts | FFIEC |
| 35 | U.S. Bank | Bank | 29,454 | 2,687 | 9.1% | Debt-to-income ratio (35%) | 11% | −0.5 pts | FFIEC |
| 36 | Veterans United Home Loans | Independent mortgage company | 71,718 | 6,411 | 8.9% | Credit history (28%) | 96% | −1.5 pts | FFIEC |
| 37 | United Wholesale Mortgage | Independent mortgage company | 233,859 | 20,884 | 8.9% | Debt-to-income ratio (47%) | 36% | −0.4 pts | FFIEC |
| 38 | Cadence Bank | Bank | 7,256 | 638 | 8.8% | Debt-to-income ratio (26%) | 22% | −3.1 pts | FFIEC |
| 39 | Citibank | Bank | 8,764 | 760 | 8.7% | Debt-to-income ratio (36%) | 1% | +1.1 pts | FFIEC |
| 40 | A&D Mortgage | Independent mortgage company | 6,593 | 570 | 8.6% | Debt-to-income ratio (37%) | 12% | −6.8 pts | FFIEC |
| 41 | Cardinal Financial Company | Independent mortgage company | 8,446 | 721 | 8.5% | Debt-to-income ratio (39%) | 56% | +0.6 pts | FFIEC |
| 42 | Nationstar Mortgage | Independent mortgage company | 5,639 | 473 | 8.4% | Debt-to-income ratio (36%) | 30% | +1.2 pts | FFIEC |
| 43 | Plains Commerce Bank | Bank | 10,626 | 875 | 8.2% | Debt-to-income ratio (54%) | 42% | +4.3 pts | FFIEC |
| 44 | Manufacturers and Traders Trust | Bank | 6,975 | 554 | 7.9% | Collateral (29%) | 24% | −1.2 pts | FFIEC |
| 45 | The Huntington National Bank | Bank | 14,454 | 1,119 | 7.7% | Debt-to-income ratio (37%) | 16% | +0.0 pts | FFIEC |
| 46 | Truist Bank | Bank | 11,668 | 902 | 7.7% | Debt-to-income ratio (46%) | 9% | −1.5 pts | FFIEC |
| 47 | Barrington Bank & Trust | Bank | 5,099 | 393 | 7.7% | Debt-to-income ratio (39%) | 27% | +1.4 pts | FFIEC |
| 48 | Sierra Pacific Mortgage Company | Independent mortgage company | 5,766 | 430 | 7.5% | Employment history (24%) | 32% | −5.8 pts | FFIEC |
| 49 | Click n' Close | Independent mortgage company | 7,417 | 538 | 7.3% | Debt-to-income ratio (46%) | 81% | +2.1 pts | FFIEC |
| 50 | Zillow Home Loans | Independent mortgage company | 14,934 | 1,074 | 7.2% | Debt-to-income ratio (46%) | 28% | −0.3 pts | FFIEC |
| 51 | American Pacific Mortgage | Independent mortgage company | 19,017 | 1,315 | 6.9% | Debt-to-income ratio (30%) | 46% | +0.3 pts | FFIEC |
| 52 | American Financial Resources | Independent mortgage company | 7,255 | 494 | 6.8% | Debt-to-income ratio (46%) | 64% | −6.9 pts | FFIEC |
| 53 | Everett Financial | Independent mortgage company | 11,685 | 789 | 6.8% | Debt-to-income ratio (41%) | 46% | +0.5 pts | FFIEC |
| 54 | Provident Funding Associates | Independent mortgage company | 9,432 | 630 | 6.7% | Debt-to-income ratio (40%) | 0% | −1.4 pts | FFIEC |
| 55 | Lower | Independent mortgage company | 12,442 | 831 | 6.7% | Debt-to-income ratio (47%) | 42% | −0.7 pts | FFIEC |
| 56 | FBC Mortgage | Independent mortgage company | 5,693 | 352 | 6.2% | Debt-to-income ratio (43%) | 58% | −1.0 pts | FFIEC |
| 57 | JET Homeloans | Independent mortgage company | 5,523 | 329 | 6.0% | Debt-to-income ratio (46%) | 57% | +4.5 pts | FFIEC |
| 58 | Synergy One Lending | Independent mortgage company | 6,094 | 358 | 5.9% | Debt-to-income ratio (37%) | 44% | +1.3 pts | FFIEC |
| 59 | First Community Mortgage | Bank- or credit union-affiliated | 9,073 | 511 | 5.6% | Debt-to-income ratio (40%) | 47% | −0.3 pts | FFIEC |
| 60 | Mortgage Solutions of Colorado | Independent mortgage company | 5,009 | 277 | 5.5% | Credit history (43%) | 93% | +0.4 pts | FFIEC |
| 61 | The Loan Store | Independent mortgage company | 20,084 | 1,093 | 5.4% | Debt-to-income ratio (54%) | 21% | −0.9 pts | FFIEC |
| 62 | Stockton Mortgage | Independent mortgage company | 5,773 | 307 | 5.3% | Debt-to-income ratio (36%) | 52% | −0.7 pts | FFIEC |
| 63 | Mutual of Omaha Mortgage | Independent mortgage company | 7,391 | 391 | 5.3% | Credit history (49%) | 34% | −2.1 pts | FFIEC |
| 64 | Arvest Bank | Bank | 5,257 | 277 | 5.3% | Debt-to-income ratio (37%) | 26% | −0.7 pts | FFIEC |
| 65 | T2 Financial | Independent mortgage company | 7,704 | 403 | 5.2% | Debt-to-income ratio (38%) | 46% | −0.2 pts | FFIEC |
| 66 | Primary Residential Mortgage | Independent mortgage company | 6,850 | 350 | 5.1% | Debt-to-income ratio (46%) | 49% | +0.2 pts | FFIEC |
| 67 | New American Funding | Independent mortgage company | 33,206 | 1,675 | 5.0% | Credit history (42%) | 48% | +0.1 pts | FFIEC |
| 68 | Union Home Mortgage | Independent mortgage company | 25,630 | 1,264 | 4.9% | Debt-to-income ratio (42%) | 35% | +0.2 pts | FFIEC |
| 69 | Ameris Bank | Bank | 9,134 | 427 | 4.7% | Debt-to-income ratio (49%) | 34% | +0.2 pts | FFIEC |
| 70 | Paramount Residential Mortgage Group | Independent mortgage company | 17,334 | 808 | 4.7% | Debt-to-income ratio (52%) | 52% | +0.2 pts | FFIEC |
| 71 | Guaranteed Rate | Independent mortgage company | 47,875 | 2,158 | 4.5% | Debt-to-income ratio (42%) | 31% | +0.1 pts | FFIEC |
| 72 | Guaranteed Rate Affinity | Independent mortgage company | 12,477 | 539 | 4.3% | Debt-to-income ratio (37%) | 22% | −0.8 pts | FFIEC |
| 73 | Gold Star Mortgage Financial Group | Independent mortgage company | 5,716 | 237 | 4.1% | Debt-to-income ratio (50%) | 50% | +1.3 pts | FFIEC |
| 74 | Prosperity Home Mortgage | Independent mortgage company | 16,196 | 658 | 4.1% | Debt-to-income ratio (37%) | 26% | −1.0 pts | FFIEC |
| 75 | First Heritage Mortgage | Independent mortgage company | 6,613 | 268 | 4.1% | Debt-to-income ratio (52%) | 44% | +2.1 pts | FFIEC |
| 76 | Fairway Independent Mortgage | Independent mortgage company | 55,406 | 2,238 | 4.0% | Debt-to-income ratio (30%) | 37% | −0.1 pts | FFIEC |
| 77 | Ixonia Bank | Bank | 6,708 | 269 | 4.0% | Debt-to-income ratio (42%) | 43% | −0.1 pts | FFIEC |
| 78 | Velocio Mortgage | Independent mortgage company | 5,547 | 222 | 4.0% | Debt-to-income ratio (61%) | 78% | −0.9 pts | FFIEC |
| 79 | PrimeLending, A PlainsCapital | Bank- or credit union-affiliated | 20,754 | 820 | 4.0% | Debt-to-income ratio (48%) | 37% | −0.1 pts | FFIEC |
| 80 | Towne Mortgage | Independent mortgage company | 6,212 | 235 | 3.8% | Debt-to-income ratio (34%) | 66% | +0.5 pts | FFIEC |
| 81 | First Colony Mortgage | Independent mortgage company | 6,802 | 257 | 3.8% | Debt-to-income ratio (48%) | 36% | +0.0 pts | FFIEC |
| 82 | Gateway First Bank | Bank | 5,385 | 188 | 3.5% | Debt-to-income ratio (50%) | 47% | −0.3 pts | FFIEC |
| 83 | Ruoff Mortgage Company | Independent mortgage company | 9,293 | 320 | 3.4% | Debt-to-income ratio (32%) | 36% | −0.2 pts | FFIEC |
| 84 | Luminate Bank | Bank | 6,044 | 207 | 3.4% | Debt-to-income ratio (38%) | 33% | n/a | FFIEC |
| 85 | American Neighborhood Mortgage Acceptance Company | Independent mortgage company | 9,496 | 310 | 3.3% | Debt-to-income ratio (41%) | 44% | +0.1 pts | FFIEC |
| 86 | CMG Mortgage | Independent mortgage company | 51,361 | 1,668 | 3.2% | Debt-to-income ratio (38%) | 42% | −0.1 pts | FFIEC |
| 87 | Movement Mortgage | Independent mortgage company | 43,221 | 1,364 | 3.2% | Debt-to-income ratio (41%) | 41% | −0.1 pts | FFIEC |
| 88 | Swbc Mortgage | Independent mortgage company | 5,187 | 161 | 3.1% | Debt-to-income ratio (34%) | 34% | −0.4 pts | FFIEC |
| 89 | Guild Mortgage | Independent mortgage company | 62,104 | 1,902 | 3.1% | Debt-to-income ratio (38%) | 43% | −0.0 pts | FFIEC |
| 90 | EMM Loans | Independent mortgage company | 5,215 | 157 | 3.0% | Other (28%) | 37% | −0.8 pts | FFIEC |
| 91 | M/I Financial | Independent mortgage company | 7,850 | 225 | 2.9% | Debt-to-income ratio (62%) | 44% | −0.2 pts | FFIEC |
| 92 | Alcova Mortgage | Independent mortgage company | 5,168 | 148 | 2.9% | Collateral (31%) | 49% | −0.6 pts | FFIEC |
| 93 | Ark-La-Tex Financial Services | Independent mortgage company | 12,136 | 339 | 2.8% | Debt-to-income ratio (43%) | 52% | −1.0 pts | FFIEC |
| 94 | Bell Bank | Bank | 7,279 | 203 | 2.8% | Debt-to-income ratio (35%) | 16% | −0.4 pts | FFIEC |
| 95 | Lake Michigan Credit Union | Credit union | 7,036 | 193 | 2.7% | Debt-to-income ratio (45%) | 6% | −0.3 pts | FFIEC |
| 96 | CrossCountry Mortgage | Independent mortgage company | 85,690 | 2,269 | 2.6% | Debt-to-income ratio (38%) | 35% | −0.2 pts | FFIEC |
| 97 | V.I.P. Mortgage | Independent mortgage company | 5,434 | 140 | 2.6% | Debt-to-income ratio (36%) | 41% | −0.1 pts | FFIEC |
| 98 | Waterstone Mortgage | Bank- or credit union-affiliated | 5,294 | 135 | 2.6% | Debt-to-income ratio (39%) | 43% | −1.1 pts | FFIEC |
| 99 | Canopy Mortgage | Independent mortgage company | 6,757 | 149 | 2.2% | Debt-to-income ratio (46%) | 54% | −0.1 pts | FFIEC |
| 100 | Morgan Stanley Private Bank | Bank | 6,315 | 138 | 2.2% | Debt-to-income ratio (62%) | 0% | −0.4 pts | FFIEC |
| 101 | DAS Acquisition Company | Independent mortgage company | 6,748 | 141 | 2.1% | Debt-to-income ratio (30%) | 49% | −0.3 pts | FFIEC |
| 102 | NFM | Independent mortgage company | 15,111 | 312 | 2.1% | Debt-to-income ratio (42%) | 40% | −0.1 pts | FFIEC |
| 103 | Vanderbilt Mortgage and Finance | Independent mortgage company | 7,512 | 149 | 2.0% | Debt-to-income ratio (44%) | 49% | −0.9 pts | FFIEC |
| 104 | Cornerstone Capital Bank, SSB | Bank | 5,599 | 110 | 2.0% | Debt-to-income ratio (48%) | 44% | +0.2 pts | FFIEC |
| 105 | GREENSTATE Credit Union | Credit union | 7,182 | 141 | 2.0% | Debt-to-income ratio (39%) | 11% | −0.4 pts | FFIEC |
| 106 | Highlands Residential Mortgage | Independent mortgage company | 5,770 | 101 | 1.8% | Debt-to-income ratio (31%) | 45% | −0.4 pts | FFIEC |
| 107 | Atlantic Bay Mortgage Group | Independent mortgage company | 9,602 | 143 | 1.5% | Debt-to-income ratio (28%) | 45% | +0.1 pts | FFIEC |
| 108 | Flat Branch Mortgage | Independent mortgage company | 12,805 | 142 | 1.1% | Debt-to-income ratio (44%) | 47% | −0.5 pts | FFIEC |
Download this table (CSV), free. The full dataset, every reporting lender with each action taken, every denial reason and the year-earlier rate, is one email away.
What lenders say when they deny
Lenders report up to four reasons for each denial. The first, which the lender treats as principal, breaks down like this across all home purchase denials in 2025, according to HMDA data:
| Principal reason given | Denials | Share of denials | Source |
|---|---|---|---|
| Debt-to-income ratio | 105,695 | 37.9% | FFIEC |
| Credit history | 40,642 | 14.6% | FFIEC |
| Collateral | 39,962 | 14.3% | FFIEC |
| Credit application incomplete | 22,255 | 8.0% | FFIEC |
| Other | 22,236 | 8.0% | FFIEC |
| Insufficient cash | 17,351 | 6.2% | FFIEC |
| Unverifiable information | 17,340 | 6.2% | FFIEC |
| Employment history | 7,725 | 2.8% | FFIEC |
| Exempt | 5,362 | 1.9% | FFIEC |
| Mortgage insurance denied | 174 | 0.1% | FFIEC |
- Debt-to-income ratio was the reason cited most often, in 38% of denials, followed by credit history at 15%, according to HMDA filings.
- Among lenders with at least 5,000 applications, the median denial rate was 6.7%, according to HMDA data.
- For 5 of those lenders, the reason given most often was an incomplete application, according to HMDA filings. HMDA records an incomplete application either as a denial or as a file closed for incompleteness, which is left out of the rate, so lenders that handle incomplete files differently can have different rates.
- The national rate was down 0.2 percentage points from 2024, according to HMDA data.
A reason is the lender's account of its decision, not a separate measure of the borrower.
What this means for technology buyers
A denial is the end of a decision that runs through a lender's intake, verification and underwriting systems, and every one is reported under HMDA with its reasons. These guides compare the options:
- Credit decision engines for consumer lending: the rules and models behind an approval or a denial.
- Loan origination systems for mortgage banks: where an application is taken, documented and decided.
- Predictive analytics platforms for credit risk: the models that score the borrower.
Mapping the process end to end? The Bank Value Streams show how lending work flows from application to decision.
More from Finantrix Atlas
How this list was built
The universe is every institution in the FFIEC's public HMDA loan-level file for 2025, the same file as our ranking of the largest mortgage lenders. To compare like with like, only home purchase applications are counted, for closed-end, first-lien loans on a site-built one-to-four family home that the borrower will live in, with reverse mortgages and business-purpose loans left out.
The denial rate follows the CFPB's own convention in its annual mortgage market report: applications denied divided by all applications, "excluding withdrawn applications and application files closed for incompleteness," because on those the lender made no decision. According to HMDA data, 707,595 like-for-like applications in 2025 were withdrawn or closed as incomplete, and they are left out. Preapproval requests that never became an application are reported as separate actions and are left out too.
Three checks hold the figures to what the FFIEC and the CFPB publish. Home purchase records by action match the FFIEC Data Browser nationally, for each of the eight actions. Each listed lender's records match its own Data Browser figures. And the method reproduces the CFPB's published national rate: for 2023 the CFPB reported 9.4% of home purchase applications denied, and the same count here gives 9.4%.
Limits
- No credit scores, no cause. The public file leaves out credit scores; the CFPB says it excludes them "to protect applicant and borrower privacy." Without them, and without each lender's own policies, a difference in denial rates cannot be attributed to anything, including discrimination.
- Who applies differs. The CFPB reports higher denial rates on FHA home purchase applications than on conventional conforming ones, so a lender with more government-backed applications can deny more for reasons that say nothing about its standards. The table shows each lender's government-backed share for that reason.
- Lenders, not groups. A bank and its mortgage subsidiary file separately and are ranked separately.
- The floor leaves out smaller lenders. Lenders with fewer than 5,000 applications are in the full dataset but not the ranking. Lenders below HMDA's reporting thresholds do not file at all.
- One product. Refinance, home equity and second-home applications are not in these rates, and lenders' rankings on them can differ.
- The data are for 2025.
Cite this
Free to quote, cite and republish, including the chart, with credit to Finantrix Atlas and a link to this page.
US lenders denied 8.7% of home purchase applications in 2025, according to a Finantrix Atlas analysis of HMDA data.
Among US lenders with at least 5,000 home purchase applications in 2025, denial rates ranged from 1.1% to 32.8%, according to Finantrix Atlas.
Suggested citation: Finantrix Atlas, "Mortgage Denial Rates by Lender," 2025, from FFIEC and CFPB HMDA data. https://www.finantrix.com/articles/mortgage-denial-rates-by-lender
Embed the chart:
<a href="https://www.finantrix.com/articles/mortgage-denial-rates-by-lender"><img src="https://www.finantrix.com/atlas/mortgage-denial-rates-by-lender.png" alt="Mortgage denial rates by lender, from Finantrix Atlas"></a>
<p>Chart: <a href="https://www.finantrix.com/articles/mortgage-denial-rates-by-lender">Finantrix Atlas</a>, from HMDA data.</p>
Frequently asked questions
Q: Which mortgage lender denies the most applications? A: Among US lenders with at least 5,000 home purchase applications in 2025, USAA Federal Savings Bank denied the largest share, 32.8%, according to HMDA data.
Q: What is the average mortgage denial rate? A: According to HMDA data, US lenders denied 8.7% of the home purchase applications they acted on in 2025. The median among lenders with at least 5,000 applications was 6.7%, according to the same data.
Q: Why are mortgage applications denied? A: According to HMDA filings, the reason lenders cited most often for home purchase denials in 2025 was debt-to-income ratio, in 38% of denials, followed by credit history.
Q: Does a high denial rate mean a lender discriminates? A: Not on its own. According to the FFIEC, HMDA data alone cannot be used to determine whether a lender complies with fair lending laws, and the data do not include some legitimate credit risk considerations. The public file also has no credit scores.
Q: How is a denial rate calculated? A: Applications denied divided by applications the lender acted on: those it originated, approved but the borrower did not accept, or denied. Withdrawn and incomplete applications are left out, as in the CFPB's own reporting.
Download the data
The 108 rows on this page (CSV), free. The full dataset has all 4,393 rows, as of December 31, 2025; we email you a link.
Frequently Asked Questions
Which mortgage lender denies the most applications?
Among US lenders with at least 5,000 home purchase applications in 2025, USAA Federal Savings Bank denied the largest share, 32.8%, according to HMDA data.
What is the average mortgage denial rate?
According to HMDA data, US lenders denied 8.7% of the home purchase applications they acted on in 2025. The median among lenders with at least 5,000 applications was 6.7%, according to the same data.
Why are mortgage applications denied?
According to HMDA filings, the reason lenders cited most often for home purchase denials in 2025 was debt-to-income ratio, in 38% of denials, followed by credit history.
Does a high denial rate mean a lender discriminates?
Not on its own. According to the FFIEC, HMDA data alone cannot be used to determine whether a lender complies with fair lending laws, and the data do not include some legitimate credit risk considerations. The public file also has no credit scores.
How is a denial rate calculated?
Applications denied divided by applications the lender acted on: those it originated, approved but the borrower did not accept, or denied. Withdrawn and incomplete applications are left out, as in the CFPB's own reporting.