
Key Takeaways
- According to FDIC data, the four largest US banking organizations hold 40.3% of FDIC-insured bank assets on June 30, 2026, below the 45.5% they held in 2009; in 1984 they held 11.5%.
- In FDIC data, the ten largest held 19.6% in 1984, 54.7% in 2009 and 55.2% now; most of the rise came between 1991 and 1999.
- The hundred largest organizations' share has kept rising, from 79.4% in 2009 to 84.3%, according to the FDIC, while the number of banking organizations fell from 14,961 in 1984 to 4,013.
- Every date is checked against the FDIC's Quarterly Banking Profile, and the seven dates that differ from it are marked with what differs.
The four largest US banking organizations hold 40.3% of the assets of every FDIC-insured bank, less than the 45.5% they held in 2009, according to FDIC data for June 30, 2026. In 1984 the four largest held 11.5%, according to the FDIC. The ten largest went from 19.6% in 1984 to 54.7% in 2009, and hold 55.2% now, according to the FDIC. In FDIC data, the measure that has kept rising since 2009 is the share of the hundred largest organizations, from 79.4% to 84.3%.
A banking organization here is every FDIC-insured bank under the same top-tier holding company on the date, as the FDIC lists it, or a bank on its own when it has none. Each year is read at June 30, from 1984 to 2026, and checked against the FDIC's Quarterly Banking Profile.
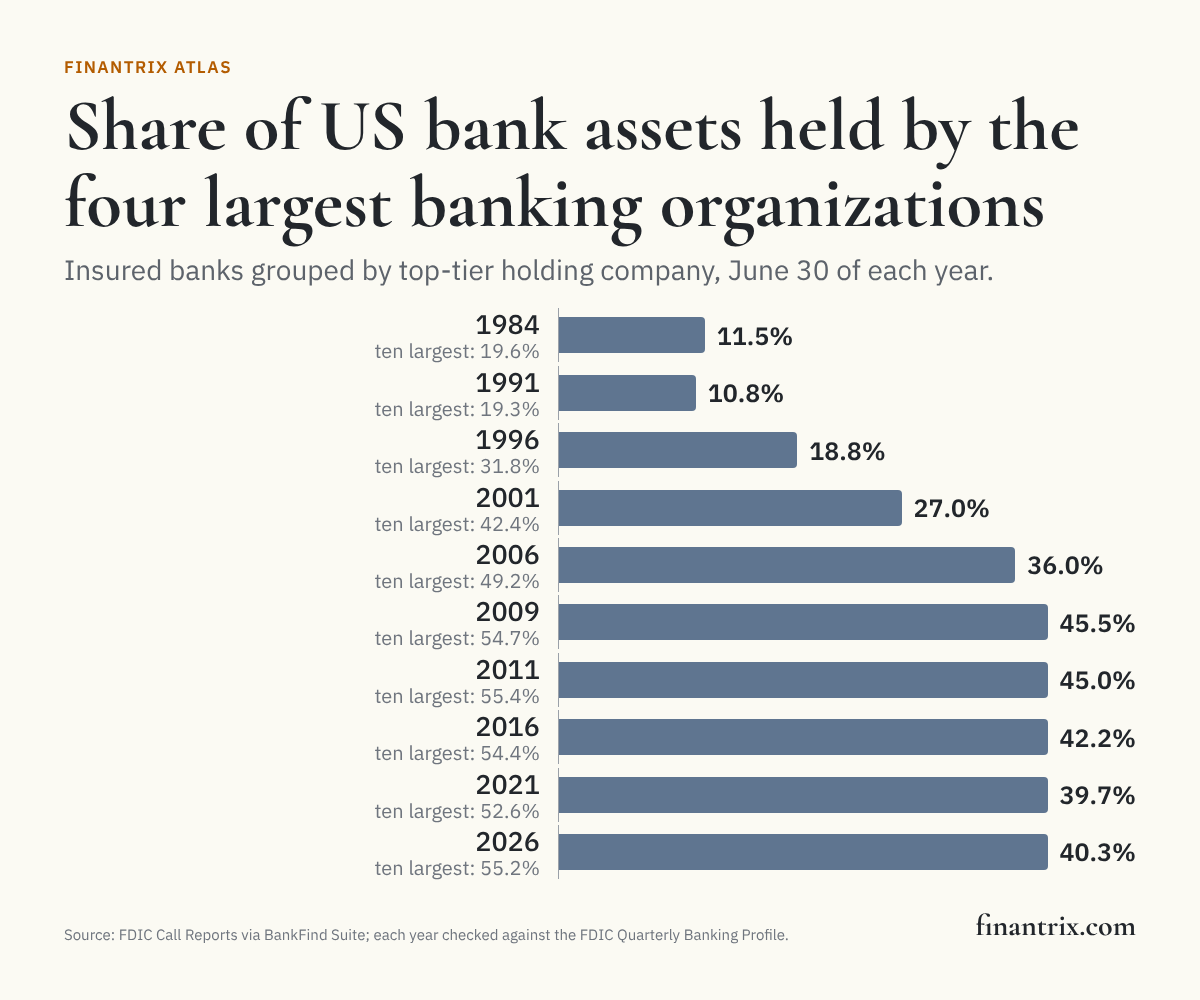
The four largest banking organizations, then and now
Every five years from 1991 to 2026, with 1984 and 2009 added. Each organization's share is the assets of its FDIC-insured banks as a share of all insured bank assets on June 30 of that year; names are as the FDIC lists the holding company on that date.
| Year | Four largest banking organizations (share of insured bank assets) | Together | Source |
|---|---|---|---|
| 1984 | Citicorp (3.8%); BankAmerica Corp. (3.3%); Chase Manhattan Corp. (2.5%); Manufacturers Hanover Corp. (1.8%) | 11.5% | FDIC |
| 1991 § | Citicorp (4.4%); BankAmerica Corp. (2.6%); Chase Manhattan Corp. (2.1%); NCNB Corp. (1.7%) | 10.8% | FDIC |
| 1996 | Chase Manhattan Corp. (5.9%); Citicorp (5.0%); BankAmerica Corp. (4.6%); NationsBank Corp. (3.3%) | 18.8% | FDIC |
| 2001 | J P Morgan Chase & Co. (8.7%); Bank of America Corp. (7.8%); Citigroup Inc. (6.6%); Bank One Corp. (4.0%) | 27.0% | FDIC |
| 2006 | Bank of America Corp. (11.7%); JPMorgan Chase & Co. (10.6%); Citigroup Inc. (9.3%); Wachovia Corp. (4.4%) | 36.0% | FDIC |
| 2009 | JPMorgan Chase & Co. (13.3%); Bank of America Corp. (13.1%); Citigroup Inc. (9.7%); Wells Fargo & Company (9.3%) | 45.5% | FDIC |
| 2011 | JPMorgan Chase & Co. (14.2%); Bank of America Corp. (12.4%); Citigroup Inc. (9.9%); Wells Fargo & Company (8.5%) | 45.0% | FDIC |
| 2016 | JPMorgan Chase & Co. (13.3%); Wells Fargo & Company (10.4%); Bank of America Corp. (10.2%); Citigroup Inc. (8.3%) | 42.2% | FDIC |
| 2021 | JPMorgan Chase & Co. (14.0%); Bank of America Corp. (10.4%); Wells Fargo & Company (7.9%); Citigroup Inc. (7.4%) | 39.7% | FDIC |
| 2026 | JPMorgan Chase & Co. (15.5%); Bank of America Corp. (10.1%); Citigroup Inc. (7.5%); Wells Fargo & Company (7.3%) | 40.3% | FDIC |
§ BankFind's figures for this date differ from the Quarterly Banking Profile; see "Where the record differs" below.
Concentration every year since 1984
The share of FDIC-insured bank assets held by the largest one, four, ten and hundred banking organizations on June 30 of each year, with the number of organizations and of insured banks, according to FDIC data.
| Date | Largest | Largest 4 | Largest 10 | Largest 100 | Banking organizations | Insured banks | Insured bank assets | Source |
|---|---|---|---|---|---|---|---|---|
| June 30, 1984 | 3.8% | 11.5% | 19.6% | 46.3% | 14,961 | 17,889 | $3.48 trillion | FDIC, FDIC QBP |
| June 30, 1985 § | 4.2% | 11.4% | 19.1% | 46.3% | 14,659 | 17,806 | $3.84 trillion | FDIC, FDIC QBP |
| June 30, 1986 | 4.2% | 10.9% | 18.4% | 47.5% | 14,593 | 18,017 | $4.11 trillion | FDIC, FDIC QBP |
| June 30, 1987 | 4.3% | 10.5% | 18.2% | 49.2% | 14,018 | 17,605 | $4.35 trillion | FDIC, FDIC QBP |
| June 30, 1988 | 4.3% | 10.0% | 17.7% | 50.2% | 13,522 | 16,993 | $4.61 trillion | FDIC, FDIC QBP |
| June 30, 1989 § | 4.2% | 9.9% | 17.9% | 51.4% | 13,070 | 16,369 | $4.83 trillion | FDIC, FDIC QBP |
| June 30, 1990 § | 4.4% | 10.4% | 18.8% | 53.4% | 12,531 | 15,680 | $4.80 trillion | FDIC, FDIC QBP |
| June 30, 1991 § | 4.4% | 10.8% | 19.3% | 54.3% | 11,988 | 15,032 | $4.63 trillion | FDIC, FDIC QBP |
| June 30, 1992 § | 4.7% | 14.6% | 23.2% | 57.0% | 11,386 | 14,237 | $4.54 trillion | FDIC, FDIC QBP |
| June 30, 1993 § | 4.4% | 14.4% | 24.5% | 60.2% | 10,890 | 13,597 | $4.61 trillion | FDIC, FDIC QBP |
| June 30, 1994 § | 5.1% | 15.4% | 26.5% | 63.5% | 10,313 | 12,953 | $4.91 trillion | FDIC, FDIC QBP |
| June 30, 1995 | 5.0% | 16.3% | 27.3% | 65.6% | 9,732 | 12,253 | $5.19 trillion | FDIC, FDIC QBP |
| June 30, 1996 | 5.9% | 18.8% | 31.8% | 67.9% | 9,344 | 11,672 | $5.42 trillion | FDIC, FDIC QBP |
| June 30, 1997 | 5.7% | 19.8% | 32.9% | 69.1% | 8,996 | 11,161 | $5.80 trillion | FDIC, FDIC QBP |
| June 30, 1998 | 5.8% | 20.3% | 34.6% | 71.4% | 8,665 | 10,713 | $6.23 trillion | FDIC, FDIC QBP |
| June 30, 1999 | 9.3% | 24.4% | 38.6% | 72.4% | 8,382 | 10,328 | $6.59 trillion | FDIC, FDIC QBP |
| June 30, 2000 | 8.7% | 24.4% | 39.4% | 73.1% | 8,282 | 10,102 | $7.16 trillion | FDIC, FDIC QBP |
| June 30, 2001 | 8.7% | 27.0% | 42.4% | 74.1% | 8,139 | 9,747 | $7.64 trillion | FDIC, FDIC QBP |
| June 30, 2002 | 7.7% | 26.8% | 43.2% | 73.9% | 8,001 | 9,466 | $8.04 trillion | FDIC, FDIC QBP |
| June 30, 2003 | 8.1% | 28.0% | 44.0% | 74.6% | 7,871 | 9,268 | $8.92 trillion | FDIC, FDIC QBP |
| June 30, 2004 | 10.2% | 30.8% | 45.4% | 75.1% | 7,752 | 9,078 | $9.65 trillion | FDIC, FDIC QBP |
| June 30, 2005 | 10.7% | 34.5% | 47.6% | 76.5% | 7,639 | 8,868 | $10.47 trillion | FDIC, FDIC QBP |
| June 30, 2006 | 11.7% | 36.0% | 49.2% | 77.5% | 7,573 | 8,777 | $11.53 trillion | FDIC, FDIC QBP |
| June 30, 2007 | 11.7% | 38.1% | 50.5% | 78.4% | 7,438 | 8,615 | $12.26 trillion | FDIC, FDIC QBP |
| June 30, 2008 | 12.6% | 39.3% | 51.8% | 79.5% | 7,341 | 8,451 | $13.30 trillion | FDIC, FDIC QBP |
| June 30, 2009 | 13.3% | 45.5% | 54.7% | 79.4% | 7,199 | 8,195 | $13.28 trillion | FDIC, FDIC QBP |
| June 30, 2010 | 13.4% | 45.0% | 54.6% | 79.9% | 7,010 | 7,830 | $13.20 trillion | FDIC, FDIC QBP |
| June 30, 2011 | 14.2% | 45.0% | 55.4% | 80.8% | 6,816 | 7,513 | $13.60 trillion | FDIC, FDIC QBP |
| June 30, 2012 | 13.9% | 44.1% | 55.8% | 81.3% | 6,612 | 7,245 | $14.03 trillion | FDIC, FDIC QBP |
| June 30, 2013 | 14.4% | 44.2% | 56.0% | 81.8% | 6,379 | 6,940 | $14.41 trillion | FDIC, FDIC QBP |
| June 30, 2014 | 14.1% | 43.7% | 56.1% | 82.2% | 6,165 | 6,656 | $15.17 trillion | FDIC, FDIC QBP |
| June 30, 2015 | 13.5% | 42.4% | 55.0% | 82.1% | 5,900 | 6,348 | $15.75 trillion | FDIC, FDIC QBP |
| June 30, 2016 | 13.3% | 42.2% | 54.4% | 82.2% | 5,640 | 6,058 | $16.53 trillion | FDIC, FDIC QBP |
| June 30, 2017 | 13.4% | 42.0% | 54.0% | 82.2% | 5,405 | 5,787 | $17.07 trillion | FDIC, FDIC QBP |
| June 30, 2018 | 13.1% | 40.9% | 52.8% | 82.2% | 5,180 | 5,542 | $17.53 trillion | FDIC, FDIC QBP |
| June 30, 2019 | 12.9% | 40.2% | 52.2% | 82.3% | 4,960 | 5,303 | $18.27 trillion | FDIC, FDIC QBP |
| June 30, 2020 | 13.3% | 40.0% | 53.1% | 82.7% | 4,747 | 5,066 | $21.14 trillion | FDIC, FDIC QBP |
| June 30, 2021 | 14.0% | 39.7% | 52.6% | 82.8% | 4,645 | 4,950 | $22.77 trillion | FDIC, FDIC QBP |
| June 30, 2022 | 14.3% | 39.2% | 52.4% | 83.3% | 4,480 | 4,771 | $23.72 trillion | FDIC, FDIC QBP |
| June 30, 2023 | 14.4% | 39.4% | 52.9% | 83.0% | 4,371 | 4,645 | $23.46 trillion | FDIC, FDIC QBP |
| June 30, 2024 | 14.7% | 39.7% | 53.0% | 82.8% | 4,284 | 4,538 | $23.89 trillion | FDIC, FDIC QBP |
| June 30, 2025 | 15.2% | 40.3% | 54.3% | 83.4% | 4,190 | 4,421 | $24.99 trillion | FDIC, FDIC QBP |
| June 30, 2026 | 15.5% | 40.3% | 55.2% | 84.3% | 4,013 | 4,238 | $26.46 trillion | FDIC, FDIC QBP |
Download every year (CSV), free, with the charter-level figures beside the organization-level ones. The full dataset, the hundred largest banking organizations in every year with their RSSD IDs and charter counts, is one email away.
When concentration rose, and when it stopped
According to FDIC data, most of the ten largest organizations' rise came between 1991 and 1999, when their share went from 19.3% to 38.6%. That is 19.4 percentage points of the 35.6 percentage points they gained from 1984 to 2026, according to the FDIC.
The four largest's share rose more in 2009 than in any other year in the series, from 39.3% in 2008 to 45.5%, a rise of 6.1 percentage points, according to the FDIC. It has not been that high since. In FDIC data, the ten largest held 54.7% in 2009 and hold 55.2% now, within a percentage point of each other, while the hundred largest went from 79.4% to 84.3%. Since 2009, then, the share of the four largest has fallen, and the next 96 have gained, from 33.9% of insured bank assets to 44.0%, according to the FDIC.
The number of banking organizations fell from 14,961 in 1984 to 4,013 in 2026, according to the FDIC, and it fell in every one of the 42 years. The largest organization was Citicorp in 1984 and is JPMorgan Chase & Co. now, with 15.5% of insured bank assets, according to FDIC data.
Organizations, not charters
Counting bank charters rather than organizations understates concentration whenever one holding company runs several charters. According to FDIC data, the gap was widest in 1996: the ten largest charters held 21.6% of insured bank assets, the ten largest organizations 31.8%, a difference of 10.2 percentage points. In FDIC data, the difference was 1.4 percentage points in 1984 and is 1.0 percentage points now. Both figures for every year are in the free CSV.
The present-day charter ranking is on the largest banks page, and the count of banks by size, with the ten largest charters a decade apart, is on the asset tier page.
Where the record differs from the Quarterly Banking Profile
On seven of the dates, 1985 and 1989 through 1994, BankFind's financial reports carry more insured filers than the QBP counts on six of them and fewer on one, and more assets than the QBP's total on every one of them. The QBP time series prints no note on either, so this page states the difference and offers no reason for it. The figures above are computed from BankFind's filers on those dates too. Measured against the QBP's own total assets instead, the ten largest's share on those dates moves by at most 0.5 percentage points, according to FDIC data, and the years holding most of the rise are the same.
| Date | Insured filers in BankFind | Institutions in the QBP | Difference | BankFind assets | QBP assets | Largest 10, BankFind total | Largest 10, QBP total | Source |
|---|---|---|---|---|---|---|---|---|
| June 30, 1985 | 17,806 | 17,936 | -130 | $3.84 trillion | $3.76 trillion | 19.1% | 19.5% | FDIC, FDIC QBP |
| June 30, 1989 | 16,369 | 16,142 | +227 | $4.83 trillion | $4.74 trillion | 17.9% | 18.2% | FDIC, FDIC QBP |
| June 30, 1990 | 15,680 | 15,436 | +244 | $4.80 trillion | $4.69 trillion | 18.8% | 19.2% | FDIC, FDIC QBP |
| June 30, 1991 | 15,032 | 14,839 | +193 | $4.63 trillion | $4.55 trillion | 19.3% | 19.6% | FDIC, FDIC QBP |
| June 30, 1992 | 14,237 | 14,177 | +60 | $4.54 trillion | $4.52 trillion | 23.2% | 23.3% | FDIC, FDIC QBP |
| June 30, 1993 | 13,597 | 13,514 | +83 | $4.61 trillion | $4.58 trillion | 24.5% | 24.7% | FDIC, FDIC QBP |
| June 30, 1994 | 12,953 | 12,935 | +18 | $4.91 trillion | $4.90 trillion | 26.5% | 26.5% | FDIC, FDIC QBP |
What this means for technology buyers
An industry where four organizations hold 40.3% of the assets and thousands hold the rest, according to FDIC data, is more than one market for a technology seller. The largest organizations tend to run large internal engineering teams and negotiate bespoke terms, while smaller banks more often buy hosted systems through a provider. The organizations just below the top four are the group whose share has grown since 2009, and many of them are large enough to need enterprise-grade systems without the engineering depth of the very largest. These guides compare the options side by side:
- Cloud-based core banking systems: what a move off a legacy core involves, and who can take it on.
- Mobile banking apps for regional banks: digital channel platforms for banks below money-center scale.
- Real-time payments platforms: the instant payment rails and the platforms that connect a bank to them.
- Regulatory reporting platforms for Basel compliance: the reporting stack that grows with a bank's size and complexity.
Planning a change across a larger organization? The Retail Banking Business Architecture Toolkit packages a capability model, value streams and an information model for a transformation program.
More from Finantrix Atlas
- Largest banks in the US, ranked by total assets
- US banks by size: how many in each asset tier
- Largest bank holding companies
- US bank mergers of the past year
- US bank failures
How this list was built
The universe on each date is every FDIC-insured commercial bank and savings institution that filed a Call Report for that quarter, read from the financial reports in the FDIC's BankFind Suite. Those reports keep a quarter's filers after a charter ends, so a bank that has merged away since is counted on every date it filed; 38 banks filed for June 30, 2026 and have closed since, and all of them are counted. Uninsured filers, such as trust companies, and insured US branches of foreign banks are left out, as the Quarterly Banking Profile leaves them out; on June 30, 2026 there were 75 of them.
Each bank is grouped under the top-tier holding company recorded in its report for that date, so an organization is measured as it was then, not as it is today. The holding company's own consolidated balance sheet, which includes businesses outside its banks, is not used; the measure is the assets of the insured banks it owns, which is what makes every date comparable back to 1984.
On every date, the number of insured banks and their total assets were compared with the FDIC's Quarterly Banking Profile time series, the edition for the second quarter of 2026, and so were the number of institutions and the share of assets in each of its five asset-size groups. Every date matches except the seven marked §. Each year's rows also sum to BankFind's own server-side count and total. For June 30, 2026, the ten largest commercial banks report the same consolidated assets in the Federal Reserve's Large Commercial Banks release.
Limits
- Insured banks only. Credit unions, uninsured trust companies, US branches of foreign banks, and the nonbank businesses of holding companies are not counted, so a holding company with a large securities or nonbank business is larger than its share here.
- National shares. The figures measure concentration of assets across the whole country. They do not show concentration of deposits or loans in any state or local market; deposits by state are on the banks by state page.
- The FDIC's holding company record. An organization is what the FDIC lists as each bank's top-tier holder on the date. A bank owned by a foreign bank is grouped under that foreign parent.
- One date a year. Each year is read at June 30; the latest is June 30, 2026. A merger can move a share between one year's figure and the next.
- Dates that differ from the QBP. They are marked §, and what differs is shown above.
Cite this
Free to quote, cite and republish, including the chart, with credit to Finantrix Atlas and a link to this page.
The four largest US banking organizations hold 40.3% of FDIC-insured bank assets, down from 45.5% in 2009 and up from 11.5% in 1984, according to a Finantrix Atlas analysis of FDIC data for June 30, 2026.
The hundred largest US banking organizations hold 84.3% of FDIC-insured bank assets, up from 79.4% in 2009, according to Finantrix Atlas, from FDIC data.
Suggested citation: Finantrix Atlas, "How Concentrated Is US Banking?," data as of June 30, 2026, from FDIC Call Reports and the FDIC Quarterly Banking Profile. https://www.finantrix.com/articles/bank-concentration-us
Embed the chart:
<a href="https://www.finantrix.com/articles/bank-concentration-us"><img src="https://www.finantrix.com/atlas/bank-concentration-us.png" alt="Share of US bank assets held by the four largest banking organizations, from FDIC data, by Finantrix Atlas"></a>
<p>Chart: <a href="https://www.finantrix.com/articles/bank-concentration-us">Finantrix Atlas</a>, from FDIC Call Reports.</p>
Frequently asked questions
Q: What share of US bank assets do the largest banks hold? A: The four largest US banking organizations hold 40.3% of FDIC-insured bank assets and the ten largest hold 55.2%, according to FDIC data for June 30, 2026.
Q: Is US banking more concentrated than it used to be? A: Yes, compared with 1984, when the four largest organizations held 11.5% of insured bank assets, according to the FDIC. Their share peaked at 45.5% in 2009 and is 40.3% now, according to FDIC data.
Q: When did US banking become concentrated? A: According to FDIC data, most of the ten largest organizations' rise came between 1991 and 1999, when their share went from 19.3% to 38.6% of insured bank assets.
Q: How many banking organizations are there in the US? A: 4,013 on June 30, 2026, owning 4,238 FDIC-insured banks, according to FDIC data, down from 14,961 in 1984.
Q: Which is the largest US banking organization? A: JPMorgan Chase & Co., whose insured banks hold 15.5% of FDIC-insured bank assets on June 30, 2026, according to the FDIC.
Download the data
The 43 rows on this page (CSV), free. The full dataset has all 4,300 rows, as of June 30, 2026; we email you a link.
Frequently Asked Questions
What share of US bank assets do the largest banks hold?
The four largest US banking organizations hold 40.3% of FDIC-insured bank assets and the ten largest hold 55.2%, according to FDIC data for June 30, 2026.
Is US banking more concentrated than it used to be?
Yes, compared with 1984, when the four largest organizations held 11.5% of insured bank assets, according to the FDIC. Their share peaked at 45.5% in 2009 and is 40.3% now, according to FDIC data.
When did US banking become concentrated?
According to FDIC data, most of the ten largest organizations' rise came between 1991 and 1999, when their share went from 19.3% to 38.6% of insured bank assets.
How many banking organizations are there in the US?
4,013 on June 30, 2026, owning 4,238 FDIC-insured banks, according to FDIC data, down from 14,961 in 1984.
Which is the largest US banking organization?
JPMorgan Chase & Co., whose insured banks hold 15.5% of FDIC-insured bank assets on June 30, 2026, according to the FDIC.