
Key Takeaways
- According to FDIC data, the 18 US banks with more than $250 billion in assets hold 63.7% of insured bank assets on June 30, 2026; a decade earlier 10 banks were that large.
- The ten largest US banks held 52.3% of insured bank assets on June 30, 2016 and 54.2% on June 30, 2026, according to the FDIC, so most of the top tier's rise is banks crossing the line.
- In FDIC data, 4,080 of the 4,238 insured banks, 96%, have less than $10 billion in assets; together they hold 13.4% of bank assets and 42.0% of bank offices.
- The number of FDIC-insured banks fell from 6,058 to 4,238 between June 30, 2016 and June 30, 2026, according to the FDIC; the tier under $100 million shrank the most, from 1,637 banks to 543.
18 US banks with more than $250 billion in assets hold 63.7% of the assets of every FDIC-insured bank, while the 4,080 banks under $10 billion, 96% of all banks, hold 13.4%, according to FDIC data for June 30, 2026. A decade earlier, on June 30, 2016, 10 banks were above that line, holding 52.3%. Most of the rise is banks crossing the line rather than the largest pulling away: counted the same way on both dates, the ten largest banks held 52.3% of insured bank assets then and hold 54.2% now, according to the FDIC.
The banks under $10 billion also hold 42.0% of bank offices in the United States, according to the FDIC. The tiers are the five asset-size groups the FDIC uses in its Quarterly Banking Profile, and every count and share below matches that publication.
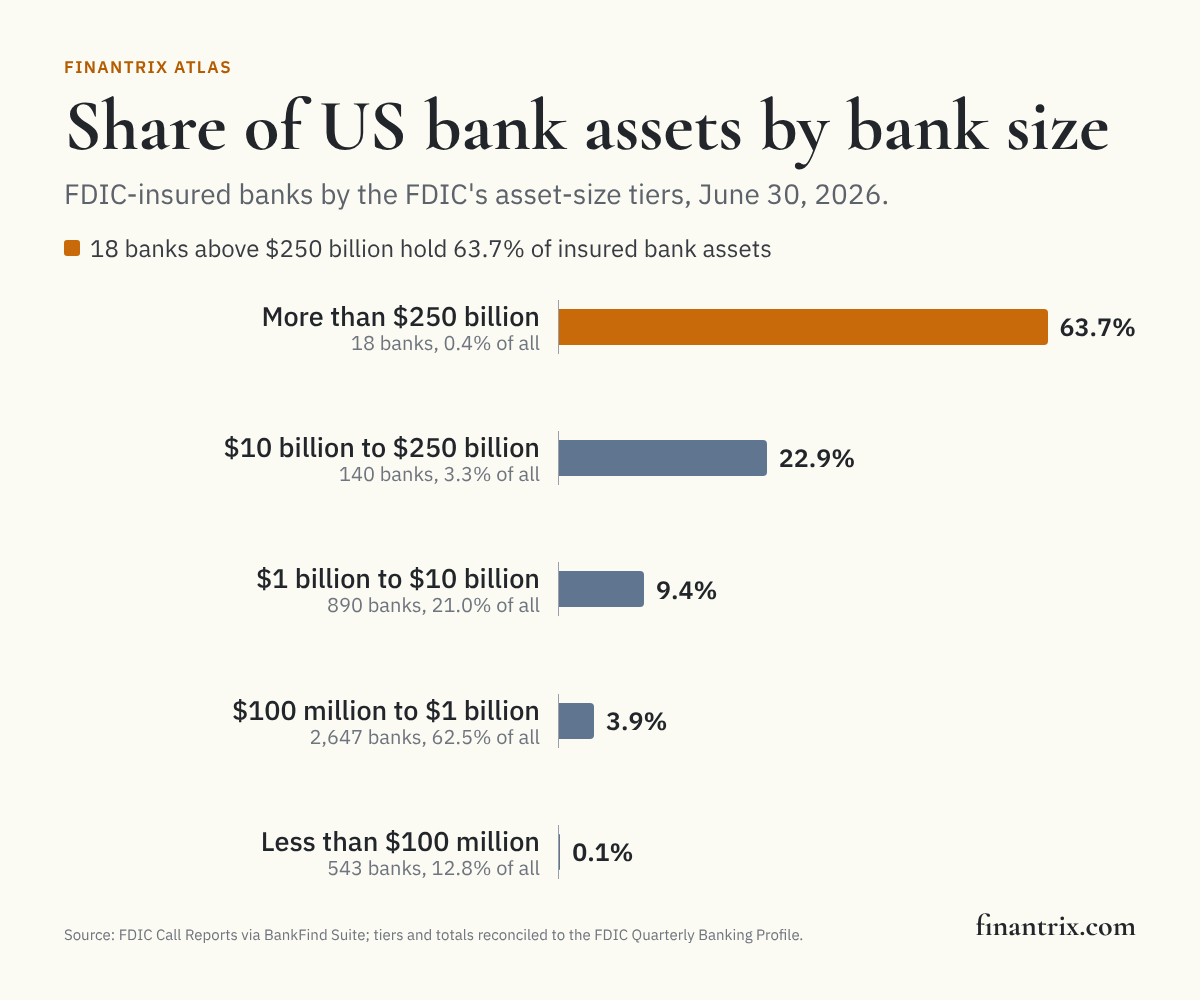
US banks by asset tier, June 30, 2026
Each FDIC-insured bank is placed in a tier by the total assets in its Call Report for June 30, 2026. Shares are of all insured banks. Offices are US offices, the main office and its branches.
| Asset tier | Banks | Share of banks | Total assets | Share of assets | Share of deposits | Share of US offices | Source |
|---|---|---|---|---|---|---|---|
| Less than $100 million | 543 | 12.8% | $34.0 billion | 0.1% | 0.1% | 1.1% | FDIC QBP, FDIC |
| $100 million to $1 billion | 2,647 | 62.5% | $1.02 trillion | 3.9% | 4.2% | 17.2% | FDIC QBP, FDIC |
| $1 billion to $10 billion | 890 | 21.0% | $2.48 trillion | 9.4% | 9.9% | 23.7% | FDIC QBP, FDIC |
| $10 billion to $250 billion | 140 | 3.3% | $6.07 trillion | 22.9% | 23.8% | 25.0% | FDIC QBP, FDIC |
| More than $250 billion | 18 | 0.4% | $16.85 trillion | 63.7% | 62.0% | 33.0% | FDIC QBP, FDIC |
| All insured banks | 4,238 | 100.0% | $26.46 trillion | 100.0% | 100.0% | 100.0% | FDIC QBP, FDIC |
Download the tier figures for every year (CSV), free. The full dataset, every insured bank in every year with its tier, assets, deposits, offices and FDIC certificate, is one email away.
How the tiers changed over ten years
The number of FDIC-insured banks fell from 6,058 on June 30, 2016 to 4,238 on June 30, 2026, according to the FDIC. It fell in every one of the ten years.
Banks in each tier, on the same date each year:
| Date (FDIC data) | Under $100M | $100M to $1B | $1B to $10B | $10B to $250B | Over $250B | All | Source |
|---|---|---|---|---|---|---|---|
| June 30, 2016 | 1,637 | 3,690 | 619 | 102 | 10 | 6,058 | FDIC QBP |
| June 30, 2017 | 1,471 | 3,564 | 631 | 112 | 9 | 5,787 | FDIC QBP |
| June 30, 2018 | 1,372 | 3,399 | 637 | 125 | 9 | 5,542 | FDIC QBP |
| June 30, 2019 | 1,230 | 3,281 | 651 | 132 | 9 | 5,303 | FDIC QBP |
| June 30, 2020 | 1,010 | 3,153 | 755 | 135 | 13 | 5,066 | FDIC QBP |
| June 30, 2021 | 870 | 3,103 | 817 | 147 | 13 | 4,950 | FDIC QBP |
| June 30, 2022 | 785 | 3,010 | 817 | 146 | 13 | 4,771 | FDIC QBP |
| June 30, 2023 | 733 | 2,920 | 836 | 142 | 14 | 4,645 | FDIC QBP |
| June 30, 2024 | 686 | 2,830 | 867 | 141 | 14 | 4,538 | FDIC QBP |
| June 30, 2025 | 623 | 2,754 | 890 | 141 | 13 | 4,421 | FDIC QBP |
| June 30, 2026 | 543 | 2,647 | 890 | 140 | 18 | 4,238 | FDIC QBP |
Share of insured bank assets held by each tier:
| Date (FDIC data) | Under $100M | $100M to $1B | $1B to $10B | $10B to $250B | Over $250B | All insured bank assets | Source |
|---|---|---|---|---|---|---|---|
| June 30, 2016 | 0.6% | 7.1% | 10.4% | 29.6% | 52.3% | $16.53 trillion | FDIC QBP |
| June 30, 2017 | 0.5% | 6.8% | 10.3% | 31.8% | 50.6% | $17.07 trillion | FDIC QBP |
| June 30, 2018 | 0.5% | 6.3% | 9.7% | 33.9% | 49.5% | $17.53 trillion | FDIC QBP |
| June 30, 2019 | 0.4% | 6.0% | 9.4% | 34.4% | 49.8% | $18.27 trillion | FDIC QBP |
| June 30, 2020 | 0.3% | 5.2% | 9.6% | 28.8% | 56.1% | $21.14 trillion | FDIC QBP |
| June 30, 2021 | 0.2% | 4.9% | 9.4% | 29.6% | 55.8% | $22.77 trillion | FDIC QBP |
| June 30, 2022 | 0.2% | 4.7% | 9.2% | 29.9% | 55.9% | $23.72 trillion | FDIC QBP |
| June 30, 2023 | 0.2% | 4.6% | 9.8% | 27.6% | 57.8% | $23.46 trillion | FDIC QBP |
| June 30, 2024 | 0.2% | 4.5% | 10.1% | 27.5% | 57.7% | $23.89 trillion | FDIC QBP |
| June 30, 2025 | 0.2% | 4.2% | 10.0% | 27.8% | 57.8% | $24.99 trillion | FDIC QBP |
| June 30, 2026 | 0.1% | 3.9% | 9.4% | 22.9% | 63.7% | $26.46 trillion | FDIC QBP |
- According to the FDIC, the tier under $100 million lost the most banks, from 1,637 to 543. It shrank in every year shown.
- In FDIC data, the tier from $1 billion to $10 billion grew, from 619 banks to 890, and the tier from $10 billion to $250 billion went from 102 banks to 140, while its share of assets moved from 29.6% to 22.9%.
- The top tier's share of assets rose in six of the ten years shown.
The FDIC's tiers are fixed dollar amounts. A bank that grows, or merges with another, moves up through them, so a tier gains banks without any bank being founded and loses banks without any closing. The count table shows where banks sit, not how many were formed or closed; for that, see the pages on mergers and new charters below.
Assets, deposits and offices are spread differently
According to FDIC data, the banks under $10 billion hold 42.0% of US bank offices but 13.4% of bank assets and 14.2% of deposits. The banks above $250 billion hold 63.7% of the assets and 33.0% of the offices, according to the FDIC. In FDIC data, each tier below $10 billion holds a larger share of the country's bank offices than of its bank assets, and the top tier holds the reverse.
The tiers are not the FDIC's definition of a community bank, which rests on lending, deposits and a local office network as well as size; the community bank ranking explains it.
What this means for technology buyers
Size decides much of how a bank buys technology: whether it builds or buys, whether it runs systems itself or through a provider, and how many vendors it can manage at once. According to FDIC data, most banks sit in the tiers below $10 billion, while most of the assets sit in the top tier. These guides compare the options side by side:
- Cloud-based core banking systems: what a move off a legacy core involves, and who can take it on.
- Mobile banking apps for regional banks: digital channel platforms for banks below money-center scale.
- Deposit management platforms: for banks competing to keep and grow core deposits.
- Financial BI and dashboarding for bank executives: reporting on the balance sheet, by business line and against peers.
Planning the change before choosing the vendor? The Retail Bank Business Capability Model maps what a bank does, whatever its size.
More from Finantrix Atlas
- Largest banks in the US, ranked by total assets
- Largest community banks in the US
- US bank mergers of the past year
- New banks: de novo charters
- Banks with the most branches
How this list was built
The universe on each date is every FDIC-insured commercial bank and savings institution that filed a Call Report for that quarter, read from the financial reports in the FDIC's BankFind Suite. Those reports keep a quarter's filers after a charter ends, so a bank that has merged away since is still counted on the dates it filed; 38 banks filed for June 30, 2026 and have closed since. Uninsured filers, such as trust companies, and insured US branches of foreign banks are left out, as the Quarterly Banking Profile leaves them out; on June 30, 2026 there were 75 of them.
Each bank is placed in a tier by its total assets on that date, using the five asset-size groups of the FDIC's Quarterly Banking Profile. The QBP's time series, the edition for the second quarter of 2026, prints the number of institutions and the share of industry assets in each group for every quarter. On each of the eleven dates shown, every tier's bank count here equals the QBP's, and every tier's share of assets equals it to the two decimals the QBP prints. No bank's assets sit exactly on a tier bound, so the reconciliation does not depend on which side of a bound such a bank would fall.
The QBP does not print deposits or offices by tier. Those figures are summed from the same Call Reports, and each year's sums equal BankFind's own server-side totals for the quarter.
Limits
- Banks, not holding companies. A group that owns several charters appears once per charter, so a large group can have charters in more than one tier.
- Insured US banks only. Credit unions, uninsured trust companies and US branches of foreign banks are not counted.
- Fixed dollar tiers. The bounds are not adjusted for inflation or for the growth of the industry, so the same bank can move up a tier without any change in its business.
- One quarter a year. Each year is read at the same quarter-end, June 30, 2026 for the latest. A bank's tier can change between filings.
- Offices are not customers. The office count is US offices as each bank reports them; it does not show digital reach or where customers live.
Cite this
Free to quote, cite and republish, including the chart, with credit to Finantrix Atlas and a link to this page.
The 18 US banks with more than $250 billion in assets hold 63.7% of FDIC-insured bank assets, while the 4,080 banks under $10 billion hold 13.4%, according to a Finantrix Atlas analysis of FDIC data for June 30, 2026.
96% of FDIC-insured US banks have less than $10 billion in assets; they hold 13.4% of bank assets and 42.0% of bank offices, according to Finantrix Atlas, from FDIC data.
Suggested citation: Finantrix Atlas, "US Banks by Size: How Many in Each Asset Tier," data as of June 30, 2026, from FDIC Call Reports and the FDIC Quarterly Banking Profile. https://www.finantrix.com/articles/banks-by-asset-tier
Embed the chart:
<a href="https://www.finantrix.com/articles/banks-by-asset-tier"><img src="https://www.finantrix.com/atlas/banks-by-asset-tier.png" alt="Share of US bank assets by bank size tier, from FDIC data, by Finantrix Atlas"></a>
<p>Chart: <a href="https://www.finantrix.com/articles/banks-by-asset-tier">Finantrix Atlas</a>, from FDIC Call Reports.</p>
Frequently asked questions
Q: How many banks are there in the US? A: 4,238 FDIC-insured banks filed a Call Report for June 30, 2026, according to the FDIC, down from 6,058 on June 30, 2016.
Q: How many US banks have more than $250 billion in assets? A: 18, according to FDIC data for June 30, 2026, and together they hold 63.7% of insured bank assets.
Q: How many US banks have less than $10 billion in assets? A: 4,080, or 96% of all FDIC-insured banks, according to FDIC data for June 30, 2026, and they hold 13.4% of bank assets.
Q: What are the FDIC's bank asset size groups? A: The FDIC's Quarterly Banking Profile groups insured banks into five tiers by total assets: less than $100 million, $100 million to $1 billion, $1 billion to $10 billion, $10 billion to $250 billion and more than $250 billion.
Q: Is a community bank any bank under $10 billion? A: No. The FDIC defines community banks by their lending, deposits and office network as well as their size, so the asset tiers on this page and the FDIC's community bank count are different measures.
Download the data
The 55 rows on this page (CSV), free. The full dataset has all 55,319 rows, as of June 30, 2026; we email you a link.
Frequently Asked Questions
How many banks are there in the US?
4,238 FDIC-insured banks filed a Call Report for June 30, 2026, according to the FDIC, down from 6,058 on June 30, 2016.
How many US banks have more than $250 billion in assets?
18, according to FDIC data for June 30, 2026, and together they hold 63.7% of insured bank assets.
How many US banks have less than $10 billion in assets?
4,080, or 96% of all FDIC-insured banks, according to FDIC data for June 30, 2026, and they hold 13.4% of bank assets.
What are the FDIC's bank asset size groups?
The FDIC's Quarterly Banking Profile groups insured banks into five tiers by total assets: less than $100 million, $100 million to $1 billion, $1 billion to $10 billion, $10 billion to $250 billion and more than $250 billion.
Is a community bank any bank under $10 billion?
No. The FDIC defines community banks by their lending, deposits and office network as well as their size, so the asset tiers on this page and the FDIC's community bank count are different measures.