
Key Takeaways
- Beacon Bank and Trust grew fastest of the 1,000 FDIC-insured banks that had at least $1.0 billion in assets a year earlier: 260.3%, from $6.2 billion to $22.2 billion.
- Twelve of the twenty-five fastest-growing absorbed at least one other bank's charter during the year, according to the FDIC's structure-change records; one bought branches from another institution.
- The fastest-growing bank that neither absorbed a charter nor bought branches in the year was Pibank, up 86.2%, according to FDIC data.
- According to FDIC data, the assets of all insured institutions changed by +5.9% over the same year, and the median bank above the floor by +5.1%.
Twelve of the twenty-five fastest-growing absorbed at least one other bank's charter during the year, according to the FDIC's structure-change records; one bought branches from another institution. Among FDIC-insured banks that started the year to June 30, 2026 with at least $1.0 billion, Beacon Bank and Trust grew its total assets the most, 260.3%, from $6.2 billion to $22.2 billion. It absorbed Bank Rhode Island, Berkshire Bank and PCSB Bank during the year; measured against the combined assets of the bank and those charters a year earlier, its assets changed by -7.0%, according to the FDIC's records. The fastest-growing bank that neither absorbed a charter nor bought branches in the year was Pibank, up 86.2%, according to FDIC data. Over the same year, the assets of all insured institutions changed by +5.9%, according to FDIC data.
This ranking keeps banks that absorbed another charter on their reported growth, because a merger is real growth of the charter, and shows beside each one what it absorbed and how fast it grew measured against the combined assets a year earlier.
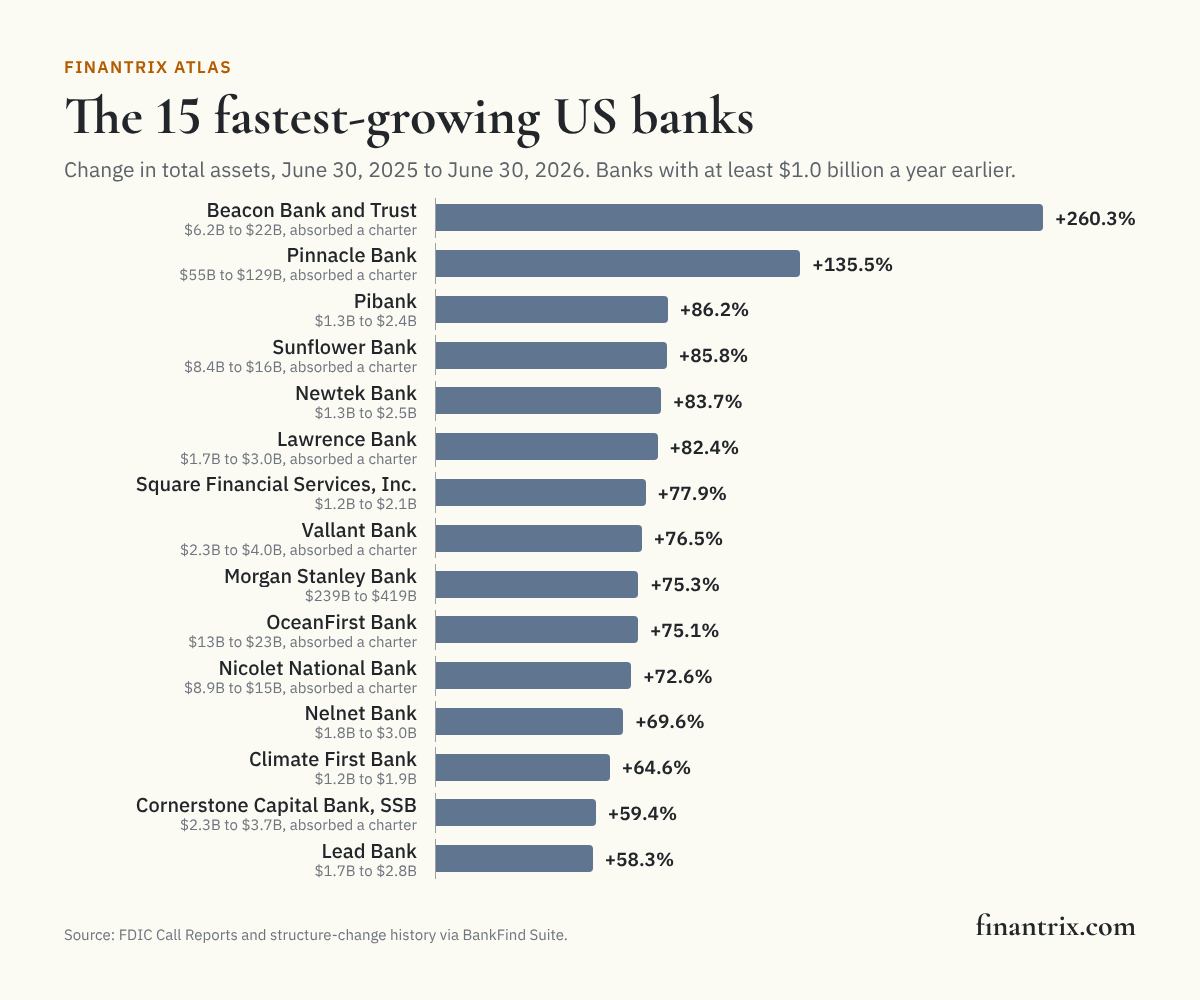
The 25 fastest-growing US banks
Ranked by the change in total assets from June 30, 2025 to June 30, 2026, among the 1,000 insured banks that held at least $1.0 billion on June 30, 2025. Each row is one bank charter. "Absorbed in the year" lists the charters that ended inside the bank in the year, from the FDIC's structure-change records, and says when the bank bought branches from another institution.
| Rank | Bank | Headquarters | Assets, June 30, 2025 | Assets, June 30, 2026 | Growth | Absorbed in the year | Growth with absorbed charters combined | Source |
|---|---|---|---|---|---|---|---|---|
| 1 | Beacon Bank and Trust | Boston, MA | $6.2 billion | $22.2 billion | +260.3% | Bank Rhode Island, Berkshire Bank and PCSB Bank | -7.0% | FDIC |
| 2 | Pinnacle Bank | Nashville, TN | $54.7 billion | $129 billion | +135.5% | Synovus Bank | +11.4% | FDIC |
| 3 | Pibank | Miami, FL | $1.3 billion | $2.4 billion | +86.2% | none | FDIC | |
| 4 | Sunflower Bank | Dallas, TX | $8.4 billion | $15.7 billion | +85.8% | First Foundation Bank | -21.7% | FDIC |
| 5 | Newtek Bank | Miami, FL | $1.3 billion | $2.5 billion | +83.7% | none | FDIC | |
| 6 | Lawrence Bank | Nashville, TN | $1.7 billion | $3.0 billion | +82.4% | F&M Bank | -6.8% | FDIC |
| 7 | Square Financial Services, Inc. | Salt Lake City, UT | $1.2 billion | $2.1 billion | +77.9% | none | FDIC | |
| 8 | Vallant Bank | Elberton, GA | $2.3 billion | $4.0 billion | +76.5% | Morris Bank | +4.6% | FDIC |
| 9 | Morgan Stanley Bank | Salt Lake City, UT | $239 billion | $419 billion | +75.3% | none | FDIC | |
| 10 | OceanFirst Bank | Toms River, NJ | $13.2 billion | $23.2 billion | +75.1% | Flushing Bank | +5.3% | FDIC |
| 11 | Nicolet National Bank | Green Bay, WI | $8.9 billion | $15.4 billion | +72.6% | MidWestOne Bank | +2.1% | FDIC |
| 12 | Nelnet Bank | Draper, UT | $1.8 billion | $3.0 billion | +69.6% | none | FDIC | |
| 13 | Climate First Bank | Saint Petersburg, FL | $1.2 billion | $1.9 billion | +64.6% | none | FDIC | |
| 14 | Cornerstone Capital Bank, SSB | Houston, TX | $2.3 billion | $3.7 billion | +59.4% | Peoples Bank | +6.6% | FDIC |
| 15 | Lead Bank | Kansas City, MO | $1.7 billion | $2.8 billion | +58.3% | none | FDIC | |
| 16 | SoFi Bank | Cottonwood Heights, UT | $36.3 billion | $56.8 billion | +56.6% | none | FDIC | |
| 17 | Chain Bridge Bank | McLean, VA | $1.4 billion | $2.2 billion | +51.7% | none | FDIC | |
| 18 | Cornerstone Bank | Spencer, MA | $1.7 billion | $2.6 billion | +49.0% | Athol Savings Bank | +6.8% | FDIC |
| 19 | Safra National Bank of New York | New York, NY | $10.8 billion | $15.7 billion | +45.3% | none | FDIC | |
| 20 | Needham Bank | Needham, MA | $5.1 billion | $7.4 billion | +44.7% | BankProv | +11.2% | FDIC |
| 21 | Equity Bank | Andover, KS | $5.4 billion | $7.7 billion | +43.9% | NBC OKLAHOMA and Frontier Bank | +0.7% | FDIC |
| 22 | Fifth Third Bank | Cincinnati, OH | $209 billion | $299 billion | +42.9% | Comerica Bank and Comerica Bank & Trust; branches bought | +4.1% | FDIC |
| 23 | Toyota Financial Savings Bank | Henderson, NV | $11.8 billion | $16.8 billion | +42.7% | none | FDIC | |
| 24 | Texas Exchange Bank | Crowley, TX | $3.2 billion | $4.5 billion | +42.5% | none | FDIC | |
| 25 | Stride Bank | Enid, OK | $3.8 billion | $5.4 billion | +42.0% | none | FDIC |
Download this table (CSV), free. The full dataset, every insured bank above the floor with what it absorbed, is one email away.
Growth by merger and growth without one
A bank's assets can grow because it takes in more deposits and makes more loans, because it buys another bank, or because it buys branches. The Call Report shows only the total. The FDIC's structure-change history shows the other two: every charter that ended inside another bank, and every branch sale, with the date it took effect.
- Twelve of the twenty-five fastest-growing absorbed at least one other bank's charter during the year, according to the FDIC's structure-change records; one bought branches from another institution.
- The fastest-growing bank that neither absorbed a charter nor bought branches in the year was Pibank, up 86.2%, according to FDIC data.
- The median bank above the floor changed by +5.1%.
The column "growth with absorbed charters combined" adds each absorbed charter's assets a year earlier to the bank's own, and measures growth against that sum. It is a comparison of two figures from the same report date, not an estimate of what the bank would have done alone: the absorbed bank's balance sheet also changed during the year, and branch purchases carry no balance-sheet figure in the history, so they are flagged and not adjusted for.
What this means for technology buyers
Fast growth puts weight on every system a bank runs, and growth by merger adds a conversion: two banks' customers, accounts and products moved onto one set of systems. These guides compare the options side by side:
- Cloud-based core banking systems: what a move off a legacy core involves, and who can take it on.
- Banking-as-a-Service platforms for traditional banks: for banks that grow by offering their charter to fintech partners.
- Commercial loan origination systems: the lending side of balance-sheet growth.
- AML transaction monitoring: monitoring that has to keep pace with more accounts and more transactions.
Planning the change before choosing the vendor? The Core Banking Transformation Toolkit is a bundle of editable project deliverables, from business case to RFP outline, for a bank planning to replace its core.
More from Finantrix Atlas
- US bank mergers of the past year
- Largest banks in the US, ranked by total assets
- Largest community banks in the US
- Largest credit unions in the US
How this list was built
Total assets are read from each institution's Call Report for June 30, 2026 and for June 30, 2025, from the FDIC's BankFind Suite. A bank is ranked if it filed for both dates and held at least $1.0 billion on June 30, 2025; the floor is set on the starting figure so that a small base cannot produce a large percentage, and a bank chartered during the year has no starting figure and is not ranked. Banks that filed for June 30, 2026 and have closed since are included with their reported figures.
Charters absorbed are read from the FDIC's structure-change history: mergers without assistance, mergers between affiliates, absorptions, consolidations and failed banks acquired, effective after June 30, 2025 and on or before June 30, 2026. There were 167 such events in the window. Each one was matched to the surviving bank's record of the same transaction, and no absorbed charter filed a report for June 30, 2026. A structure-change code the page does not classify stops the build.
The total assets in the financial reports were also compared with each listed bank's institution record for June 30, 2026, and they agree. There is no second publisher for this measure: the Federal Reserve's Large Commercial Banks release publishes one quarter at a time.
Limits
- Growth is total assets, as filed. It includes everything that moves a balance sheet: deposits arriving or leaving, loans, securities, cash held at the end of the quarter, and acquisitions. A bank holding more cash on one report date than the other can rank high without changing its business.
- Two dates, one year apart. A bank that grew and then shrank within the year, or the reverse, shows only the net change. The dates of the data are June 30, 2025 and June 30, 2026.
- Banks, not holding companies. A holding company that merges two of its own charters moves assets from one row to another; those are flagged as affiliate mergers in the dataset.
- The combined-growth column is a comparison, not a pro forma. It does not adjust for purchase accounting, for assets sold to complete a deal, or for branch purchases.
- Insured institutions above the floor only. Smaller banks and credit unions are not ranked.
Cite this
Free to quote, cite and republish, including the chart, with credit to Finantrix Atlas and a link to this page.
Beacon Bank and Trust grew its total assets 260.3% in the year to June 30, 2026, the fastest of any FDIC-insured bank with at least $1.0 billion a year earlier, according to a Finantrix Atlas analysis of FDIC Call Reports.
The assets of all FDIC-insured institutions changed by +5.9% in the year to June 30, 2026, according to Finantrix Atlas.
Suggested citation: Finantrix Atlas, "Fastest-Growing US Banks by Assets," data as of June 30, 2026, from FDIC Call Reports and structure-change history. https://www.finantrix.com/articles/fastest-growing-banks
Embed the chart:
<a href="https://www.finantrix.com/articles/fastest-growing-banks"><img src="https://www.finantrix.com/atlas/fastest-growing-banks.png" alt="The fastest-growing US banks by total assets, from Finantrix Atlas"></a>
<p>Chart: <a href="https://www.finantrix.com/articles/fastest-growing-banks">Finantrix Atlas</a>, from FDIC Call Reports.</p>
Frequently asked questions
Q: What is the fastest-growing bank in the US? A: Beacon Bank and Trust, whose total assets grew 260.3% from June 30, 2025 to June 30, 2026, among FDIC-insured banks with at least $1.0 billion a year earlier, according to its Call Reports.
Q: Did the fastest-growing banks grow by acquisition? A: Twelve of the twenty-five fastest-growing absorbed at least one other bank's charter during the year, according to the FDIC's structure-change records; one bought branches from another institution. The table names each charter absorbed and shows growth measured against the combined assets a year earlier.
Q: How fast did US bank assets grow over the year? A: The total assets of all FDIC-insured institutions changed by +5.9% from June 30, 2025 to June 30, 2026, according to FDIC data. The median bank above $1.0 billion changed by +5.1%.
Q: Why is there a size floor? A: A small base turns a modest change into a large percentage. Only banks with at least $1.0 billion in total assets on June 30, 2025 are ranked; the full dataset lists them all.
Download the data
The 25 rows on this page (CSV), free. The full dataset has all 1,000 rows, as of June 30, 2026; we email you a link.
Frequently Asked Questions
What is the fastest-growing bank in the US?
Beacon Bank and Trust, whose total assets grew 260.3% from June 30, 2025 to June 30, 2026, among FDIC-insured banks with at least $1.0 billion a year earlier, according to its Call Reports.
Did the fastest-growing banks grow by acquisition?
Twelve of the twenty-five fastest-growing absorbed at least one other bank's charter during the year, according to the FDIC's structure-change records; one bought branches from another institution. The table names each charter absorbed and shows growth measured against the combined assets a year earlier.
How fast did US bank assets grow over the year?
The total assets of all FDIC-insured institutions changed by +5.9% from June 30, 2025 to June 30, 2026, according to FDIC data. The median bank above $1.0 billion changed by +5.1%.
Why is there a size floor?
A small base turns a modest change into a large percentage. Only banks with at least $1.0 billion in total assets on June 30, 2025 are ranked; the full dataset lists them all.