
Key Takeaways
- According to SEC filings, the 25 non-traded BDCs hold 42% of the $578 billion in BDC assets, more than the 50 BDCs listed on an exchange, which hold 30%.
- Blackstone Private Credit Fund is the largest BDC, with $81.3 billion in total assets, 2.2 times the second largest, according to its SEC filing.
- Of the ten largest BDCs, 6 do not trade on an exchange, according to SEC filings; 106 private BDCs hold 27% of BDC assets.
- Figures are each BDC's total assets in its latest 10-Q or 10-K, mostly as of June 30, 2026, and every one in the table matches the SEC's XBRL data for the quarter.
Non-traded business development companies, whose shares are registered for sale to the public but not listed on any exchange, hold 42% of the $578 billion in BDC assets, more than the 50 BDCs that are listed, according to SEC filings. There are 25 of them. According to the same filings, listed BDCs hold 30%, and 106 private BDCs, neither listed nor registered for public sale, hold 27%.
Blackstone Private Credit Fund is the largest single BDC, with $81.3 billion in total assets, 2.2 times the second largest, Blue Owl Credit Income, according to SEC filings. Of the ten largest BDCs, 6 do not trade on an exchange. Every figure is from the BDC's latest 10-Q or 10-K, mostly as of June 30, 2026.
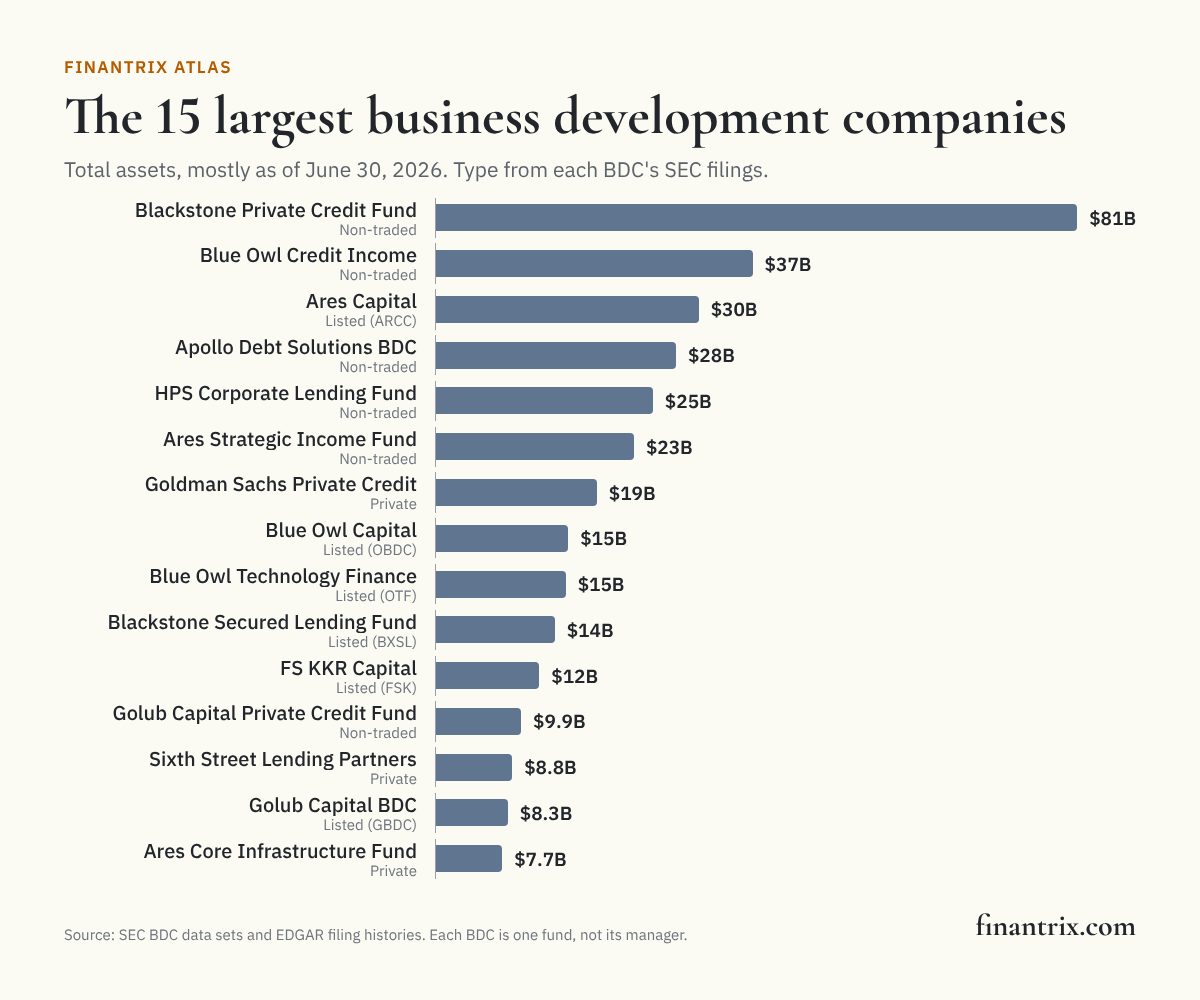
The 50 largest business development companies
Ranked by total assets at the end of each BDC's latest reported quarter. Each row is one BDC, not its manager: the ranking of private credit managers by BDC investments adds up the BDCs each manager runs.
| Rank | BDC | Type | Total assets | Net assets | Investments at fair value | As of | Source |
|---|---|---|---|---|---|---|---|
| 1 | Blackstone Private Credit Fund | Non-traded | $81.3 billion | $42.8 billion | $77.6 billion | June 30, 2026 | SEC |
| 2 | Blue Owl Credit Income | Non-traded | $36.8 billion | $18.4 billion | $35.7 billion | June 30, 2026 | SEC |
| 3 | Ares Capital | Listed (ARCC) | $30.5 billion | $13.9 billion | $29.3 billion | June 30, 2026 | SEC |
| 4 | Apollo Debt Solutions BDC | Non-traded | $27.9 billion | $14.0 billion | $25.4 billion | June 30, 2026 | SEC |
| 5 | HPS Corporate Lending Fund | Non-traded | $25.2 billion | $12.0 billion | $24.2 billion | June 30, 2026 | SEC |
| 6 | Ares Strategic Income Fund | Non-traded | $23.0 billion | $10.2 billion | $21.8 billion | June 30, 2026 | SEC |
| 7 | Goldman Sachs Private Credit | Private | $18.7 billion | $9.2 billion | $18.2 billion | June 30, 2026 | SEC |
| 8 | Blue Owl Capital | Listed (OBDC) | $15.4 billion | $7.0 billion | $15.0 billion | June 30, 2026 | SEC |
| 9 | Blue Owl Technology Finance | Listed (OTF) | $15.1 billion | $7.5 billion | $14.7 billion | June 30, 2026 | SEC |
| 10 | Blackstone Secured Lending Fund | Listed (BXSL) | $13.8 billion | $5.9 billion | $13.4 billion | June 30, 2026 | SEC |
| 11 | FS KKR Capital | Listed (FSK) | $12.0 billion | $5.1 billion § | $11.4 billion | June 30, 2026 | SEC |
| 12 | Golub Capital Private Credit Fund | Non-traded | $9.9 billion | $4.5 billion | $9.6 billion | June 30, 2026 | SEC |
| 13 | Sixth Street Lending Partners | Private | $8.8 billion | $4.5 billion | $8.7 billion | June 30, 2026 | SEC |
| 14 | Golub Capital BDC | Listed (GBDC) | $8.3 billion | $3.7 billion | $8.2 billion | June 30, 2026 | SEC |
| 15 | Ares Core Infrastructure Fund | Private | $7.7 billion | $5.0 billion | $7.3 billion | June 30, 2026 | SEC |
| 16 | Oaktree Strategic Credit Fund | Non-traded | $7.2 billion | $4.3 billion | $6.8 billion | June 30, 2026 | SEC |
| 17 | MSD Investment | Private | $7.2 billion | $3.5 billion | $6.9 billion | June 30, 2026 | SEC |
| 18 | Prospect Capital | Listed (PSEC) | $6.4 billion | $2.9 billion § | $6.3 billion | June 30, 2026 | SEC |
| 19 | North Haven Private Income Fund | Private | $6.3 billion | $3.1 billion | $6.0 billion | June 30, 2026 | SEC |
| 20 | Monroe Capital Income Plus | Private | $6.2 billion | $2.7 billion | $6.0 billion | June 30, 2026 | SEC |
| 21 | Main Street Capital | Listed (MAIN) | $5.9 billion | $3.2 billion | $5.7 billion | June 30, 2026 | SEC |
| 22 | Barings Private Credit | Private | $5.7 billion | $2.8 billion | $5.4 billion | June 30, 2026 | SEC |
| 23 | Blue Owl Technology Income | Non-traded | $5.2 billion | $2.7 billion | $5.1 billion | June 30, 2026 | SEC |
| 24 | TPG Twin Brook Capital Income Fund | Non-traded | $5.1 billion | $2.7 billion | $4.8 billion | June 30, 2026 | SEC |
| 25 | Antares Strategic Credit Fund | Private | $4.7 billion | $2.1 billion | $4.6 billion | June 30, 2026 | SEC |
| 26 | Hercules Capital | Listed (HTGC) | $4.7 billion | $2.3 billion | $4.6 billion | June 30, 2026 | SEC |
| 27 | Franklin BSP Capital | Over the counter (FRBP) | $4.2 billion | $1.8 billion § | $4.1 billion | June 30, 2026 | SEC |
| 28 | StepStone Private Credit Fund | Private | $4.0 billion | $2.8 billion | $3.8 billion | June 30, 2026 | SEC |
| 29 | Morgan Stanley Direct Lending Fund | Listed (MSDL) | $3.7 billion | $1.6 billion | $3.6 billion | June 30, 2026 | SEC |
| 30 | Sixth Street Specialty Lending | Listed (TSLX) | $3.5 billion | $1.5 billion | $3.3 billion | June 30, 2026 | SEC |
| 31 | Nuveen Churchill Private Capital Income Fund | Non-traded | $3.4 billion | $1.5 billion | $3.3 billion | June 30, 2026 | SEC |
| 32 | Goldman Sachs BDC | Listed (GSBD) | $3.3 billion | $1.4 billion | $3.2 billion | June 30, 2026 | SEC |
| 33 | T. Rowe Price OHA Select Private Credit Fund | Non-traded | $3.2 billion | $1.6 billion | $3.1 billion | June 30, 2026 | SEC |
| 34 | Stone Point Credit | Private | $3.1 billion | $1.4 billion | $3.0 billion | June 30, 2026 | SEC |
| 35 | Diameter Credit Co. | Private | $3.0 billion | $1.5 billion | $2.8 billion | June 30, 2026 | SEC |
| 36 | Midcap Financial Investment | Listed (MFIC) | $2.9 billion | $1.1 billion | $2.8 billion | June 30, 2026 | SEC |
| 37 | Oaktree Specialty Lending | Listed (OCSL) | $2.9 billion | $1.4 billion | $2.7 billion | June 30, 2026 | SEC |
| 38 | Carlyle Credit Solutions | Private | $2.9 billion | $1.7 billion | $2.7 billion | June 30, 2026 | SEC |
| 39 | Trinity Capital | Listed (TRIN) | $2.8 billion | $1.3 billion | $2.7 billion | June 30, 2026 | SEC |
| 40 | Golub Capital BDC 4 | Private | $2.8 billion | $1.2 billion | $2.7 billion | June 30, 2026 | SEC |
| 41 | KKR FS Income Trust | Private | $2.7 billion | $1.7 billion | $2.6 billion | June 30, 2026 | SEC |
| 42 | BlackRock Private Credit Fund | Non-traded | $2.7 billion | $1.6 billion | $2.5 billion | June 30, 2026 | SEC |
| 43 | Pennantpark Floating Rate Capital | Listed (PFLT) | $2.6 billion | $1.0 billion | $2.5 billion | June 30, 2026 | SEC |
| 44 | Bain Capital Specialty Finance | Listed (BCSF) | $2.6 billion | $1.1 billion | $2.4 billion | June 30, 2026 | SEC |
| 45 | Fidelity Private Credit Fund | Non-traded | $2.6 billion | $1.3 billion | $2.5 billion | June 30, 2026 | SEC |
| 46 | Barings BDC | Listed (BBDC) | $2.6 billion | $1.1 billion | $2.5 billion | June 30, 2026 | SEC |
| 47 | SLR Investment | Listed (SLRC) | $2.6 billion | $982 million | $2.1 billion | June 30, 2026 | SEC |
| 48 | Carlyle Secured Lending | Listed (CGBD) | $2.4 billion | $1.1 billion | $2.4 billion | June 30, 2026 | SEC |
| 49 | Bain Capital Private Credit | Non-traded | $2.4 billion | $1.1 billion | $2.2 billion | June 30, 2026 | SEC |
| 50 | New Mountain Finance | Listed (NMFC) | $2.4 billion | $1.0 billion § | $2.3 billion | June 30, 2026 | SEC |
Download this table (CSV), free. The full dataset, every BDC with its type, assets, liabilities, net assets, file number and filing, is one email away.
§ The net assets the BDC reports are less than its total assets minus its total liabilities, as filed. The table shows the reported figure.
Listed, non-traded and private
How a business development company's shares reach investors leaves a different record at the SEC for each type. The type on this page is read from those records, not from the name: 10 BDCs with "private credit" in their names are registered for sale to the public.
- Listed: the shares trade on a US exchange. The SEC's ticker file and the BDC's own cover page both name the exchange.
- Non-traded: the shares are registered with the SEC on Form N-2 for sale to the public, but are not listed on an exchange.
- Over the counter: not listed on an exchange, but the SEC's ticker file shows the shares quoted over the counter. According to SEC filings, there are 3, holding 0.7% of BDC assets.
- Private: the shares are neither listed nor registered for sale to the public. A private BDC still files the same quarterly reports with the SEC; 83 of the 106 have reported a private placement on Form D.
| Type | BDCs | Total assets | Share of BDC assets | In the largest 50 | Source |
|---|---|---|---|---|---|
| Non-traded | 25 | $243 billion | 42.1% | 14 | SEC |
| Listed | 50 | $174 billion | 30.2% | 21 | SEC |
| Private | 106 | $156 billion | 27.0% | 14 | SEC |
| Over the counter | 3 | $4.2 billion | 0.7% | 1 | SEC |
- The median BDC holds $1.0 billion in total assets, according to SEC filings; the 50 in the table hold 81% of all BDC assets.
- Blackstone Private Credit Fund alone holds 14% of all BDC assets, according to its SEC filing.
What this means for technology buyers
A BDC runs a loan book that a bank would recognize, and a non-traded or private BDC also reports to investors who cannot sell on an exchange. These guides compare the options:
- Private credit loan management and servicing: the loan book, from drawdown to payoff.
- Loan servicing platforms for specialty finance: servicing at volume for non-bank lenders.
- Investor relations and reporting platforms for alternative managers: statements, portals and reporting for a fund's investors.
Mapping the business? The Private Equity Capability Model sets out what a private markets manager does, from fundraising to portfolio monitoring.
More from Finantrix Atlas
- Largest private credit managers by BDC investments
- Largest private fund managers
- Who administers private funds
How this list was built
The SEC publishes the financial data from every BDC filing each month. The universe is every BDC in the data sets from May 2026 to September 2026, at its latest 10-Q or 10-K: 184 BDCs. Every BDC files quarterly, so that window holds each one's latest report, and every BDC that filed in the four months before it is accounted for, by a withdrawn election, a deregistration, or total assets too small to reach the table.
Total assets, total liabilities, net assets and investments at fair value are the figures each BDC tagged for its period end. The 50 table rows at the most common period end were checked against the SEC's separate XBRL data for the quarter (CY2026Q2I), and each matches to the dollar.
A BDC is listed if the SEC's company ticker file names it on a US exchange; its own cover page must agree, and does for every BDC. It is quoted over the counter if the ticker file lists it there and on no exchange. It is non-traded if it has no ticker and has filed a Form N-2 registration that took effect, shown by a prospectus or the SEC's notice of effectiveness. Every other BDC is private, and each of those has a Form 10 registration or a Form D notice on EDGAR.
Limits
- BDCs only. A manager's private credit also sits in private funds and separate accounts, which file no financial statements with the SEC. The manager ranking says more.
- Total assets include borrowed money. A BDC can borrow against its portfolio, so total assets are larger than the investors' money in it. Net assets are shown beside them.
- Fair value, as reported. Investments are valued by each BDC under its own procedures; undrawn commitments are not included.
- The type is a rule. It is read from EDGAR filings, as described above, and a BDC that lists its shares or registers an offering changes type when the page is next refreshed.
- One quarter, mostly. The date of the data is June 30, 2026 for most BDCs; 5 of the 184 report a different period end, shown in the table and the dataset.
Cite this
Free to quote, cite and republish, including the chart, with credit to Finantrix Atlas and a link to this page.
Non-traded business development companies hold 42% of the $578 billion in BDC assets, more than listed BDCs, according to a Finantrix Atlas analysis of SEC filings as of June 30, 2026.
The largest business development company, Blackstone Private Credit Fund, reports $81.3 billion in total assets, according to Finantrix Atlas.
Suggested citation: Finantrix Atlas, "Largest Business Development Companies," as of June 30, 2026, from SEC BDC data sets and EDGAR filings. https://www.finantrix.com/articles/largest-bdcs
Embed the chart:
<a href="https://www.finantrix.com/articles/largest-bdcs"><img src="https://www.finantrix.com/atlas/largest-bdcs.png" alt="The largest business development companies by total assets, from Finantrix Atlas"></a>
<p>Chart: <a href="https://www.finantrix.com/articles/largest-bdcs">Finantrix Atlas</a>, from SEC filings.</p>
Frequently asked questions
Q: What is the largest BDC? A: Blackstone Private Credit Fund, with $81.3 billion in total assets as of June 30, 2026, according to its SEC filing.
Q: How many business development companies are there? A: 184 filed financial statements with the SEC in the five months to September 2026: 50 listed, 25 non-traded, 106 private and 3 quoted over the counter, according to SEC filings.
Q: What is a non-traded BDC? A: A business development company whose shares are registered with the SEC for sale to the public but are not listed on an exchange. Non-traded BDCs hold 42% of BDC assets, according to SEC filings.
Q: What is a private BDC? A: A business development company whose shares are neither listed on an exchange nor registered for sale to the public. The 106 private BDCs hold 27% of BDC assets, according to SEC filings.
Download the data
Two CSV files, free: the 50 rows on this page, and the full dataset of all 184 rows, as of June 30, 2026.
Frequently Asked Questions
What is the largest BDC?
Blackstone Private Credit Fund, with $81.3 billion in total assets as of June 30, 2026, according to its SEC filing.
How many business development companies are there?
184 filed financial statements with the SEC in the five months to September 2026: 50 listed, 25 non-traded, 106 private and 3 quoted over the counter, according to SEC filings.
What is a non-traded BDC?
A business development company whose shares are registered with the SEC for sale to the public but are not listed on an exchange. Non-traded BDCs hold 42% of BDC assets, according to SEC filings.
What is a private BDC?
A business development company whose shares are neither listed on an exchange nor registered for sale to the public. The 106 private BDCs hold 27% of BDC assets, according to SEC filings.