
Key Takeaways
- UBS ATS traded the most dollar volume of any US equity ATS in the 13 weeks to September 18, 2026, $1.72 trillion, according to FINRA data.
- UBS ATS and Intelligent Cross LLC together handle 27% of equity ATS dollar volume reported to FINRA, and the largest ten 72%.
- According to FINRA, the 45 equity ATSs traded $12.40 trillion over the period, an average of $5,743 per trade.
- The SEC's list of Form ATS filers names 81 ATSs, most of which trade bonds, private shares and other securities rather than equities.
UBS ATS traded more dollar volume than any other US equity alternative trading system in the 13 weeks to September 18, 2026: $1.72 trillion, according to FINRA. Intelligent Cross LLC is close behind, and the two together handle 27% of equity ATS dollar volume. Sigma X2 is third.
Every figure is from the weekly volume each ATS reports to FINRA, from June 22, 2026 to September 18, 2026.
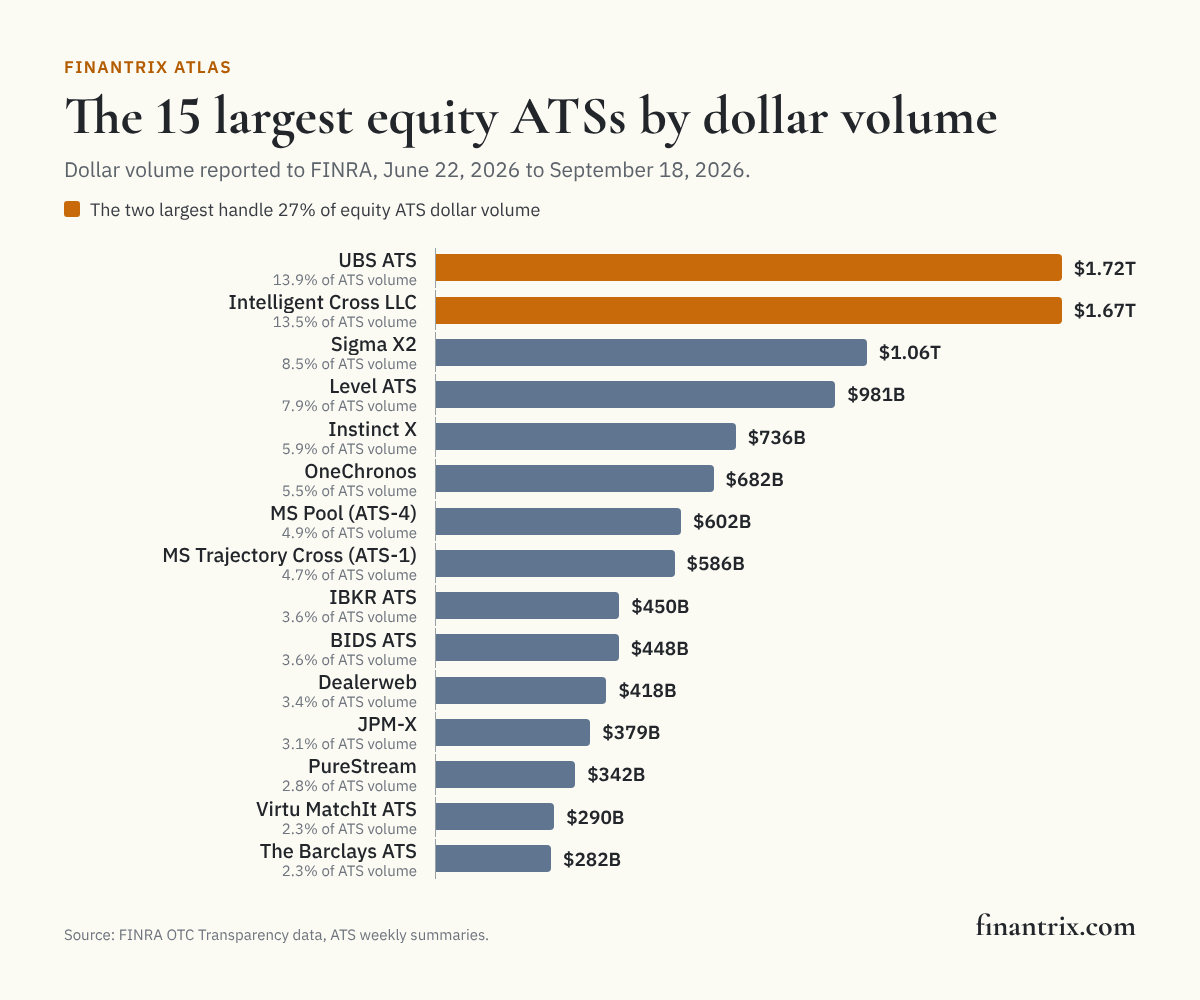
The 30 largest equity ATSs
Alternative trading systems, many of them the venues known as dark pools, match buy and sell orders outside the public exchanges. They are ranked here by the dollar value of the trades they executed. The MPID is the identifier each ATS reports under.
| Rank | ATS | MPID | Dollar volume | Share of equity ATS dollar volume | Shares | Trades | Average trade | Source |
|---|---|---|---|---|---|---|---|---|
| 1 | UBS ATS | UBSA | $1.72 trillion | 13.9% | 19,468,475,014 | 265,869,654 | $6,467 | FINRA |
| 2 | Intelligent Cross LLC | INCR | $1.67 trillion | 13.5% | 24,012,536,759 | 325,405,737 | $5,135 | FINRA |
| 3 | Sigma X2 | SGMT | $1.06 trillion | 8.5% | 11,579,438,387 | 203,371,851 | $5,202 | FINRA |
| 4 | Level ATS | EBXL | $981 billion | 7.9% | 13,326,388,581 | 328,660,111 | $2,984 | FINRA |
| 5 | Instinct X | MLIX | $736 billion | 5.9% | 9,818,348,432 | 100,262,529 | $7,340 | FINRA |
| 6 | OneChronos | CGXS | $682 billion | 5.5% | 7,711,554,157 | 79,545,328 | $8,572 | FINRA |
| 7 | MS Pool (ATS-4) | MSPL | $602 billion | 4.9% | 8,054,875,430 | 42,030,246 | $14,320 | FINRA |
| 8 | MS Trajectory Cross (ATS-1) | MSTX | $586 billion | 4.7% | 9,834,791,390 | 302,779,361 | $1,935 | FINRA |
| 9 | IBKR ATS | IATS | $450 billion | 3.6% | 4,603,618,767 | 35,821,372 | $12,566 | FINRA |
| 10 | BIDS ATS | BIDS | $448 billion | 3.6% | 6,737,286,590 | 9,777,611 | $45,869 | FINRA |
| 11 | Dealerweb | DLTA | $418 billion | 3.4% | 618,079,588 | 5,339 | $78 million | FINRA |
| 12 | JPM-X | JPMX | $379 billion | 3.1% | 4,204,113,219 | 45,400,387 | $8,346 | FINRA |
| 13 | PureStream | PURE | $342 billion | 2.8% | 4,192,545,680 | 130,159,228 | $2,627 | FINRA |
| 14 | Virtu MatchIt ATS | KCGM | $290 billion | 2.3% | 3,799,342,410 | 34,188,507 | $8,492 | FINRA |
| 15 | The Barclays ATS | LATS | $282 billion | 2.3% | 3,536,490,083 | 32,638,642 | $8,655 | FINRA |
| 16 | BOATS | BLUE | $274 billion | 2.2% | 6,347,643,091 | 55,416,173 | $4,947 | FINRA |
| 17 | JPB-X | JPBX | $255 billion | 2.1% | 3,609,334,778 | 44,999,531 | $5,657 | FINRA |
| 18 | POSIT | ITGP | $228 billion | 1.8% | 3,489,114,126 | 13,877,681 | $16,432 | FINRA |
| 19 | CBX | ICBX | $221 billion | 1.8% | 2,621,210,105 | 28,917,005 | $7,651 | FINRA |
| 20 | CrossStream | XSTM | $180 billion | 1.5% | 3,086,270,625 | 12,539,305 | $14,395 | FINRA |
| 21 | BNPP Cortex ATS | BNPX | $169 billion | 1.4% | 1,738,725,695 | 20,309,948 | $8,342 | FINRA |
| 22 | Citi-One ATS | ONEC | $111 billion | 0.9% | 1,176,110,756 | 10,727,400 | $10,327 | FINRA |
| 23 | Liquidnet H2O ATS | LQNA | $71.4 billion | 0.6% | 944,856,961 | 2,567,025 | $27,817 | FINRA |
| 24 | MS RPool (ATS-6) | MSRP | $68.7 billion | 0.6% | 1,095,395,629 | 12,237,067 | $5,615 | FINRA |
| 25 | Bruce Markets, LLC | BOSS | $45.2 billion | 0.4% | 890,626,962 | 8,765,353 | $5,162 | FINRA |
| 26 | Instinet BlockCross | BLKX | $32.2 billion | 0.3% | 485,124,710 | 132,861 | $242,286 | FINRA |
| 27 | AlphaX US | ALPX | $26.3 billion | 0.2% | 295,977,238 | 3,310,457 | $7,942 | FINRA |
| 28 | Liquidnet Negotiation ATS | LQNT | $19.9 billion | 0.2% | 255,093,026 | 9,471 | $2 million | FINRA |
| 29 | IBKR EOS ATS | IEOS | $13.0 billion | 0.1% | 216,799,613 | 1,710,921 | $7,600 | FINRA |
| 30 | OTC Link ECN ATS | OTCX | $12.7 billion | 0.1% | 1,541,808,860 | 2,755,594 | $4,618 | FINRA |
Download this table (CSV), free. The full dataset, every equity ATS with its volume by tier, is one email away.
How ATS trading divides
- The largest ten equity ATSs handle 72% of equity ATS dollar volume reported to FINRA, and the 30 in the table 99.8%.
- The 45 equity ATSs executed 2,159,782,831 trades worth $12.40 trillion in all, an average of $5,743 a trade, according to FINRA.
- The most widely traded stocks, FINRA's first tier, account for 83% of the dollar volume.
- The SEC's list of ATSs that file Form ATS, as of September 30, 2026, names 81. Most trade bonds, Treasuries, private company shares or securities loans; some also trade over-the-counter equities and appear in the ranking above.
What this means for technology buyers
Where an order executes, and at what cost, is decided by the routing and analytics a firm runs. These guides compare the options:
- Equity trading platforms for broker-dealers: the order and execution systems behind ATS routing.
- Transaction cost analysis tools: measuring what a venue choice costs.
- Clearing and settlement systems for broker-dealers: settling what an ATS matches.
Mapping the business? The Investment Banking Capability Model sets out the trading and execution capabilities a broker-dealer runs, and the Investment Banking Value Streams show how that work runs end to end.
More from Finantrix Atlas
- Largest futures commission merchants
- Largest broker-dealer firms in the US
- Largest institutional investors by reported holdings
How this list was built
FINRA publishes each equity ATS's weekly trades, shares and dollar volume for three groups of securities: the most widely traded listed stocks two weeks after the week, and other listed stocks and OTC equities four weeks after. The window is the 13 weeks ending at the latest week for which all three are published, so every ATS is measured on the same complete set. Every ATS that trades NMS stocks or OTC equities must report this data, so the ranking covers all of them.
Limits
- Volume, not quality. Dollar volume says how much trading an ATS handles, not what its fills cost or who trades there.
- Block venues look different. An ATS built for large blocks, often of exchange-traded funds, executes few trades of great size, as the average trade column shows.
- ATSs, not firms. One broker-dealer can run more than one ATS, and each is ranked on its own.
- ATSs only. Single-dealer platforms and wholesaler internalization are also off-exchange but are not ATSs, so they are not here.
- A quarter of data. Volume shifts with markets and with routing decisions, so a different 13-week window would rank some ATSs differently.
Cite this
Free to quote, cite and republish, including the chart, with credit to Finantrix Atlas and a link to this page.
UBS ATS traded $1.72 trillion in the 13 weeks to September 18, 2026, the most of any US equity ATS, according to a Finantrix Atlas analysis of FINRA data.
Two equity ATSs handle 27% of the dollar volume reported to FINRA by US equity ATSs, according to Finantrix Atlas.
Suggested citation: Finantrix Atlas, "Largest Equity ATSs (Dark Pools) by Dollar Volume," June 22, 2026 to September 18, 2026, from FINRA OTC Transparency data. https://www.finantrix.com/articles/alternative-trading-systems
Embed the chart:
<a href="https://www.finantrix.com/articles/alternative-trading-systems"><img src="https://www.finantrix.com/atlas/alternative-trading-systems.png" alt="The largest US equity ATSs by dollar volume, from Finantrix Atlas"></a>
<p>Chart: <a href="https://www.finantrix.com/articles/alternative-trading-systems">Finantrix Atlas</a>, from FINRA data.</p>
Frequently asked questions
Q: What is an alternative trading system? A: A trading venue registered with the SEC as a broker-dealer rather than as an exchange, which matches orders from its subscribers. Equity ATSs that do not display quotes are commonly called dark pools.
Q: What is the largest dark pool? A: Among US equity ATSs, UBS ATS, with $1.72 trillion in dollar volume in the 13 weeks to September 18, 2026, according to FINRA data.
Q: How many ATSs are there? A: According to FINRA data, 45 equity ATSs reported trades in the period. The SEC's list of Form ATS filers names 81, most of which trade other securities; some of those also report equity trades and are counted in both.
Download the data
The 30 rows on this page (CSV), free. The full dataset has all 45 rows, as of September 18, 2026; we email you a link.
Frequently Asked Questions
What is an alternative trading system?
A trading venue registered with the SEC as a broker-dealer rather than as an exchange, which matches orders from its subscribers. Equity ATSs that do not display quotes are commonly called dark pools.
What is the largest dark pool?
Among US equity ATSs, UBS ATS, with $1.72 trillion in dollar volume in the 13 weeks to September 18, 2026, according to FINRA data.
How many ATSs are there?
According to FINRA data, 45 equity ATSs reported trades in the period. The SEC's list of Form ATS filers names 81, most of which trade other securities; some of those also report equity trades and are counted in both.