
Key Takeaways
- Federally insured US credit unions paid dividends and interest on deposits at an annual rate of $38.0 billion in the first six months of 2026, 1.81% of average deposits, according to NCUA data.
- Among credit unions of $1.0 billion or more, the median cost of deposits was 1.79%; Zeal paid the least, 0.36%, and State Farm the most, 4.04%.
- Share certificates were 29% of credit union deposits on June 30, 2026, according to the NCUA; the large credit unions that paid the most hold a median 37% of deposits in them.
- Navy Federal, the largest credit union, paid 1.77% of its average deposits at an annual rate, according to NCUA data.
Federally insured US credit unions paid dividends and interest on members' deposits at an annual rate of $38.0 billion in the first six months of 2026, 1.81% of their average deposits, according to NCUA Call Report data. Among the 25 largest credit unions the cost ranged from 1.13% to 3.17%, and Navy Federal, the largest, paid 1.77%.
The cost of deposits is what a credit union pays on its members' savings, checking, money market and certificate balances. Across all credit unions it was 90% of interest expense in 2026 to date, according to NCUA data; the rest is mostly interest on borrowed money.
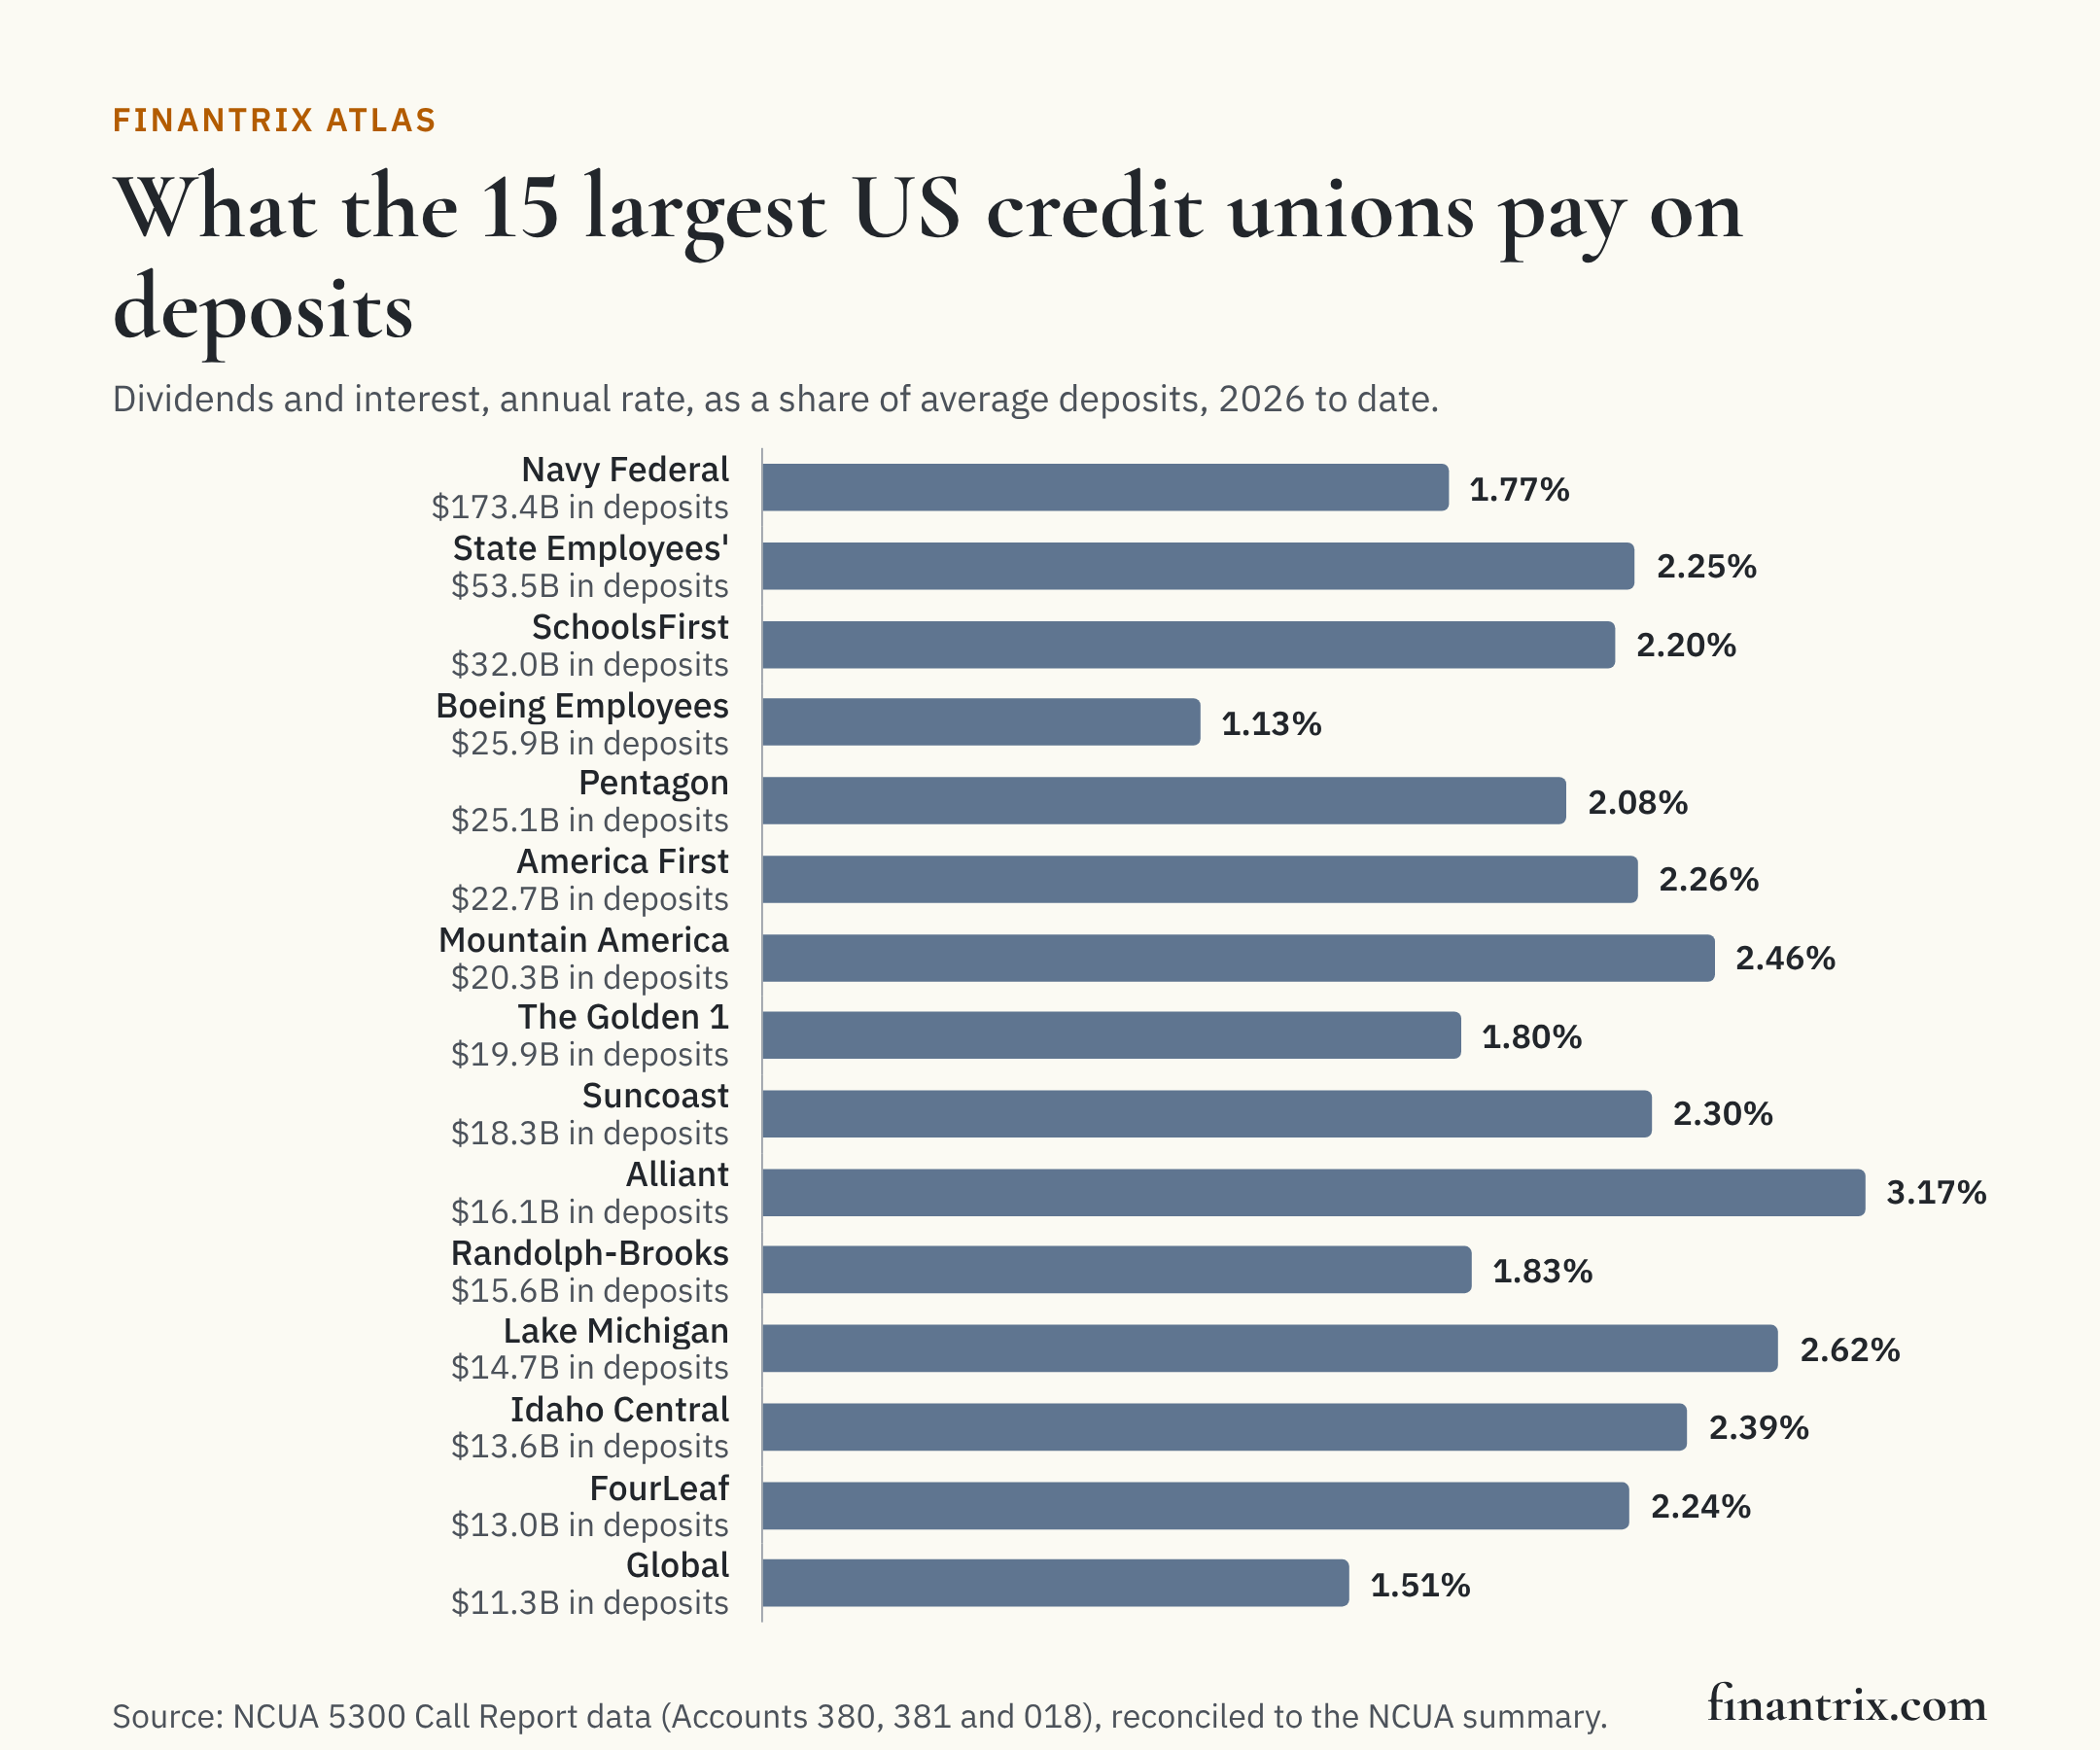
The 25 largest credit unions
The largest credit unions by shares and deposits on June 30, 2026, with what each paid on them in the year to date at an annual rate, as a share of average deposits. "Certificates" is the share of deposits held in share certificates, term accounts like a bank CD. Names are as the NCUA lists them, which usually leaves out "Credit Union".
| Rank by deposits | Credit union | Headquarters | Cost of deposits | Paid on deposits, annual rate | Shares and deposits | Certificates, share of deposits | Source |
|---|---|---|---|---|---|---|---|
| 1 | Navy Federal | Vienna, VA | 1.77% | $3.0 billion | $173 billion | 34% | NCUA |
| 2 | State Employees' | Raleigh, NC | 2.25% | $1.2 billion | $53.5 billion | 32% | NCUA |
| 3 | SchoolsFirst | Tustin, CA | 2.20% | $686 million | $32.0 billion | 39% | NCUA |
| 4 | Boeing Employees | Tukwila, WA | 1.13% | $292 million | $25.9 billion | 11% | NCUA |
| 5 | Pentagon | McLean, VA | 2.08% | $522 million | $25.1 billion | 32% | NCUA |
| 6 | First Technology | San Jose, CA | n/a | $466 million | $24.2 billion | 21% | NCUA |
| 7 | America First | Riverdale, UT | 2.26% | $491 million | $22.7 billion | 30% | NCUA |
| 8 | Mountain America | Sandy, UT | 2.46% | $488 million | $20.3 billion | 34% | NCUA |
| 9 | The Golden 1 | Sacramento, CA | 1.80% | $353 million | $19.9 billion | 32% | NCUA |
| 10 | Suncoast | Tampa, FL | 2.30% | $409 million | $18.3 billion | 36% | NCUA |
| 11 | Alliant | Chicago, IL | 3.17% | $512 million | $16.1 billion | 35% | NCUA |
| 12 | Wings | Colorado Springs, CO | n/a | $283 million | $16.0 billion | 25% | NCUA |
| 13 | Randolph-Brooks | Live Oak, TX | 1.83% | $282 million | $15.6 billion | 26% | NCUA |
| 14 | Lake Michigan | Caledonia, MI | 2.62% | $371 million | $14.7 billion | 29% | NCUA |
| 15 | Idaho Central | Chubbuck, ID | 2.39% | $314 million | $13.6 billion | 33% | NCUA |
| 16 | FourLeaf | Bethpage, NY | 2.24% | $288 million | $13.0 billion | 26% | NCUA |
| 17 | Global | Anchorage, AK | 1.51% | $171 million | $11.3 billion | 26% | NCUA |
| 18 | Security Service | San Antonio, TX | 1.98% | $220 million | $11.2 billion | 45% | NCUA |
| 19 | VyStar | Jacksonville, FL | 1.42% | $158 million | $11.2 billion | 27% | NCUA |
| 20 | United Nations | Long Island City, NY | 1.35% | $127 million | $9.6 billion | 36% | NCUA |
| 21 | Redwood | Santa Rosa, CA | 2.01% | $178 million | $9.3 billion | 31% | NCUA |
| 22 | Desert Financial | Phoenix, AZ | 1.88% | $164 million | $8.9 billion | 18% | NCUA |
| 23 | GreenState | North Liberty, IA | 2.82% | $246 million | $8.7 billion | 45% | NCUA |
| 24 | MIDFLORIDA | Lakeland, FL | 1.90% | $153 million | $8.6 billion | 18% | NCUA |
| 25 | Eastman | Kingsport, TN | 2.35% | $200 million | $8.6 billion | 46% | NCUA |
First Technology, Wings are shown with no cost, because deposits moved by more than 25% between the two dates.
Download this table (CSV), free. The full dataset, every federally insured credit union with its dividends, interest, deposits at both dates and certificates, is one email away.
The lowest cost of deposits among credit unions of $1.0 billion or more
Among the 463 credit unions with $1.0 billion or more in assets that are within the deposit-change rule, the median cost of deposits was 1.79%. These 25 paid the least; Zeal paid 0.36%.
| Rank | Credit union | Headquarters | Cost of deposits | Shares and deposits | Certificates, share of deposits |
|---|---|---|---|---|---|
| 1 | Zeal | Livonia, MI | 0.36% | $844 million | 7% |
| 2 | First Community | Coquille, OR | 0.48% | $1.6 billion | 16% |
| 3 | South Carolina | North Charleston, SC | 0.48% | $2.1 billion | 6% |
| 4 | University of Michigan | Ann Arbor, MI | 0.66% | $1.1 billion | 12% |
| 5 | Wescom Central | Pasadena, CA | 0.67% | $4.3 billion | 14% |
| 6 | Water and Power Community | Los Angeles, CA | 0.70% | $826 million | 18% |
| 7 | Credit Union One | Ferndale, MI | 0.71% | $1.6 billion | 16% |
| 8 | Los Angeles | Glendale, CA | 0.80% | $1.1 billion | 25% |
| 9 | Credit Union 1 | Anchorage, AK | 0.81% | $1.4 billion | 18% |
| 10 | University | Austin, TX | 0.83% | $3.5 billion | 18% |
| 11 | Arrowhead | Rancho Cucamonga, CA | 0.87% | $2.4 billion | 21% |
| 12 | BluPeak | San Diego, CA | 0.88% | $998 million | 21% |
| 13 | One Nevada | Las Vegas, NV | 0.89% | $1.2 billion | 10% |
| 14 | Altura | Riverside, CA | 0.90% | $2.4 billion | 21% |
| 15 | City & County | Saint Paul, MN | 0.95% | $1.0 billion | 23% |
| 16 | Polish & Slavic | Brooklyn, NY | 0.96% | $2.5 billion | 22% |
| 17 | The Police | San Bruno, CA | 0.96% | $926 million | 22% |
| 18 | Velocity | Austin, TX | 0.98% | $872 million | 18% |
| 19 | California Coast | San Diego, CA | 0.99% | $3.1 billion | 34% |
| 20 | Michigan First | Lathrup Village, MI | 0.99% | $1.1 billion | 12% |
| 21 | 1st Advantage | Yorktown, VA | 1.00% | $896 million | 22% |
| 22 | 4Front | Traverse City, MI | 1.01% | $930 million | 16% |
| 23 | Educational | Miami, FL | 1.04% | $1.6 billion | 23% |
| 24 | Vantage | Saint Charles, MO | 1.04% | $1.1 billion | 12% |
| 25 | San Diego County | San Diego, CA | 1.05% | $7.8 billion | 29% |
The highest cost of deposits among credit unions of $1.0 billion or more
These 25 paid the most on their deposits, from 4.04% at State Farm down to 2.65%. Their median certificate share is 37%, against 18% for the 25 that paid the least.
| Rank | Credit union | Headquarters | Cost of deposits | Shares and deposits | Certificates, share of deposits |
|---|---|---|---|---|---|
| 1 | State Farm | Bloomington, IL | 4.04% | $5.0 billion | 0% |
| 2 | Lafayette | Rockville, MD | 3.58% | $1.8 billion | 55% |
| 3 | USALLIANCE | Rye, NY | 3.25% | $2.6 billion | 45% |
| 4 | Star One | Sunnyvale, CA | 3.23% | $8.4 billion | 6% |
| 5 | Self Reliance Financial | New York, NY | 3.22% | $1.7 billion | 58% |
| 6 | Alliant | Chicago, IL | 3.17% | $16.1 billion | 35% |
| 7 | Quorum | Purchase, NY | 3.12% | $1.1 billion | 32% |
| 8 | EFCU Financial | Baton Rouge, LA | 3.09% | $1.1 billion | 51% |
| 9 | Leaders | Jackson, TN | 3.06% | $1.2 billion | 30% |
| 10 | Chevron | Concord, CA | 3.06% | $4.7 billion | 34% |
| 11 | Connexus | Wausau, WI | 3.00% | $3.6 billion | 48% |
| 12 | Vibrant | Moline, IL | 2.92% | $959 million | 37% |
| 13 | Dow | Midland, MI | 2.88% | $2.3 billion | 36% |
| 14 | General Electric | Cincinnati, OH | 2.87% | $3.5 billion | 52% |
| 15 | NASA | Upper Marlboro, MD | 2.86% | $4.7 billion | 58% |
| 16 | Rockland | Rockland, MA | 2.86% | $3.3 billion | 37% |
| 17 | GreenState | North Liberty, IA | 2.82% | $8.7 billion | 45% |
| 18 | Connecticut State Employees | Hartford, CT | 2.73% | $2.5 billion | 25% |
| 19 | All In | Daleville, AL | 2.70% | $3.3 billion | 48% |
| 20 | Utah First | Salt Lake City, UT | 2.70% | $929 million | 22% |
| 21 | United States Senate | Alexandria, VA | 2.69% | $1.4 billion | 47% |
| 22 | Communication | Oklahoma City, OK | 2.69% | $2.1 billion | 58% |
| 23 | Caltech Employees | La Canada, CA | 2.67% | $1.6 billion | 0% |
| 24 | Hughes | Tucson, AZ | 2.66% | $2.4 billion | 43% |
| 25 | American Airlines | Fort Worth, TX | 2.65% | $8.3 billion | 31% |
Where the money goes
According to NCUA data, credit unions paid $32.6 billion a year in share dividends and $5.4 billion in interest on deposits, a line the Call Report collects from state-chartered credit unions only, both at an annual rate in 2026 to date. They held $2.13 trillion in shares and deposits on June 30, 2026, $611 billion of it, 29%, in share certificates.
What this means for technology buyers
Deposit pricing is set product by product and paid account by account, and a credit union that wants to change what it pays needs to see the mix it holds, model a rate change before making it, and run the promotions it decides on. These guides compare the options side by side:
- Deposit management platforms: products, rates and account servicing.
- Core banking systems: where share and certificate accounts are held and paid.
- Treasury and liquidity management: funding cost and liquidity across the balance sheet.
- Financial BI and dashboarding for executives: tracking cost of funds against plan.
Planning the change before choosing the vendor? The Banking and Payments Capability Matrix maps deposit products and pricing as a credit union shares them with a retail bank.
More from Finantrix Atlas
- Largest credit unions in the US, ranked by assets
- US banks by net interest margin
- Credit unions by net worth ratio
- Largest credit unions by members
How this list was built
The universe is every federal credit union and federally insured state-chartered credit union in the NCUA's quarterly Call Report data for June 30, 2026. What a credit union paid is Account 380 (dividends on shares) plus Account 381 (interest on deposits), both year to date. They are put at an annual rate by multiplying by twelve over the six months elapsed, the same convention the NCUA uses for income in its own summary. Average deposits are the mean of total shares and deposits (Account 018) on December 31, 2025 and on June 30, 2026. Certificates are Account 908C.
A credit union that merged with another during the year reports a year's expense that matches neither balance. So the ranked tables leave out any credit union whose deposits moved by more than 25% between the two dates, or that filed no report for December 31, 2025. They also leave out the 4 credit unions whose reported dividends and interest on deposits exceed their total interest expense, a filing that cannot be read either way (1 of them of $1.0 billion or more). In all, 8 of the 471 credit unions of $1.0 billion or more are left out of the ranked tables; every one is in the dataset with its figures.
The NCUA separately publishes a Quarterly Credit Union Data Summary from the same filings. Both quarters here reproduce its count of credit unions and total deposits, and the current one its share dividends, interest on deposits, total interest expense and share certificates, to the rounding the summary prints.
Limits
- An average, not a rate sheet. The figure is what a credit union paid across all its deposits. It is not the rate on any account, and a member's rate depends on the product and balance.
- Two balances make the average. Deposits that rose and fell within the half year are not captured by a two-point average.
- Year to date. 2026 so far, at an annual rate; a rate change late in the period shows only in part.
- Federally insured only. Privately insured credit unions and banks are not in it. One publisher, June 30, 2026.
Cite this
Free to quote, cite and republish, including the chart, with credit to Finantrix Atlas and a link to this page.
Federally insured US credit unions paid 1.81% of their average deposits in dividends and interest at an annual rate in 2026 to date, according to a Finantrix Atlas analysis of NCUA Call Report data for June 30, 2026.
Suggested citation: Finantrix Atlas, "US Credit Unions by Cost of Deposits," data as of June 30, 2026, from NCUA Call Report data. https://www.finantrix.com/articles/credit-union-deposit-costs
Embed the chart:
<a href="https://www.finantrix.com/articles/credit-union-deposit-costs"><img src="https://www.finantrix.com/atlas/credit-union-deposit-costs.png?v=2026-06-30" alt="What the largest US credit unions pay on deposits, from Finantrix Atlas"></a>
<p>Chart: <a href="https://www.finantrix.com/articles/credit-union-deposit-costs">Finantrix Atlas</a>, from NCUA Call Report data.</p>
Frequently asked questions
Q: How much do credit unions pay on deposits? A: 1.81% of average deposits at an annual rate in 2026 to date, or $38.0 billion a year in dividends and interest at that rate, according to NCUA data for all federally insured credit unions.
Q: Which large credit union pays the most on deposits? A: Among credit unions of $1.0 billion or more, State Farm, at 4.04% of average deposits, according to its Call Report filed with the NCUA.
Q: Do the credit unions that pay more on deposits hold more certificates? A: Among credit unions of $1.0 billion or more, the 25 that paid the most hold a median 37% of deposits in share certificates, against 18% for the 25 that paid the least, according to NCUA data.
Q: What is the difference between dividends and interest at a credit union? A: The Call Report records what a credit union pays on shares as dividends, and, for state-chartered credit unions only, interest on deposits as a separate line. This page adds the two.
Download the data
Two CSV files, free: the 25 rows on this page, and the full dataset of all 4,214 rows, as of June 30, 2026.
Frequently Asked Questions
How much do credit unions pay on deposits?
1.81% of average deposits at an annual rate in 2026 to date, or $38.0 billion a year in dividends and interest at that rate, according to NCUA data for all federally insured credit unions.
Which large credit union pays the most on deposits?
Among credit unions of $1.0 billion or more, State Farm, at 4.04% of average deposits, according to its Call Report filed with the NCUA.
Do the credit unions that pay more on deposits hold more certificates?
Among credit unions of $1.0 billion or more, the 25 that paid the most hold a median 37% of deposits in share certificates, against 18% for the 25 that paid the least, according to NCUA data.
What is the difference between dividends and interest at a credit union?
The Call Report records what a credit union pays on shares as dividends, and, for state-chartered credit unions only, interest on deposits as a separate line. This page adds the two.