
Key Takeaways
- FDIC-insured US banks held net loans equal to 66.2% of their deposits on June 30, 2026, according to FDIC data, and the median bank with $1 billion or more in assets reported 86.3%.
- 135 of the 1,048 banks of that size lent more than they held in deposits, funding the rest by borrowing or capital.
- John Deere Financial, f.s.b. reports the highest ratio, 314.1%, according to the FDIC.
- The ratio is the FDIC's own: net loans and leases as a percent of total deposits.
FDIC-insured US banks held net loans and leases equal to 66.2% of their deposits on June 30, 2026, according to FDIC data: $13.71 trillion in loans against $20.72 trillion in deposits. Among the 1,048 banks with $1 billion or more in assets, the median ratio was 86.3%, and 135 lent more than they held in deposits. John Deere Financial, f.s.b. reports the highest ratio, 314.1%, followed by Beal Bank USA at 235.7% and Square Financial Services, Inc. at 230.0%.
The loan-to-deposit ratio compares what a bank has lent with the deposits it holds. To lend more than its deposits, a bank funds the difference by borrowing, for example from a Federal Home Loan Bank, or from capital. A low ratio means deposits are held in cash and securities instead of loans.
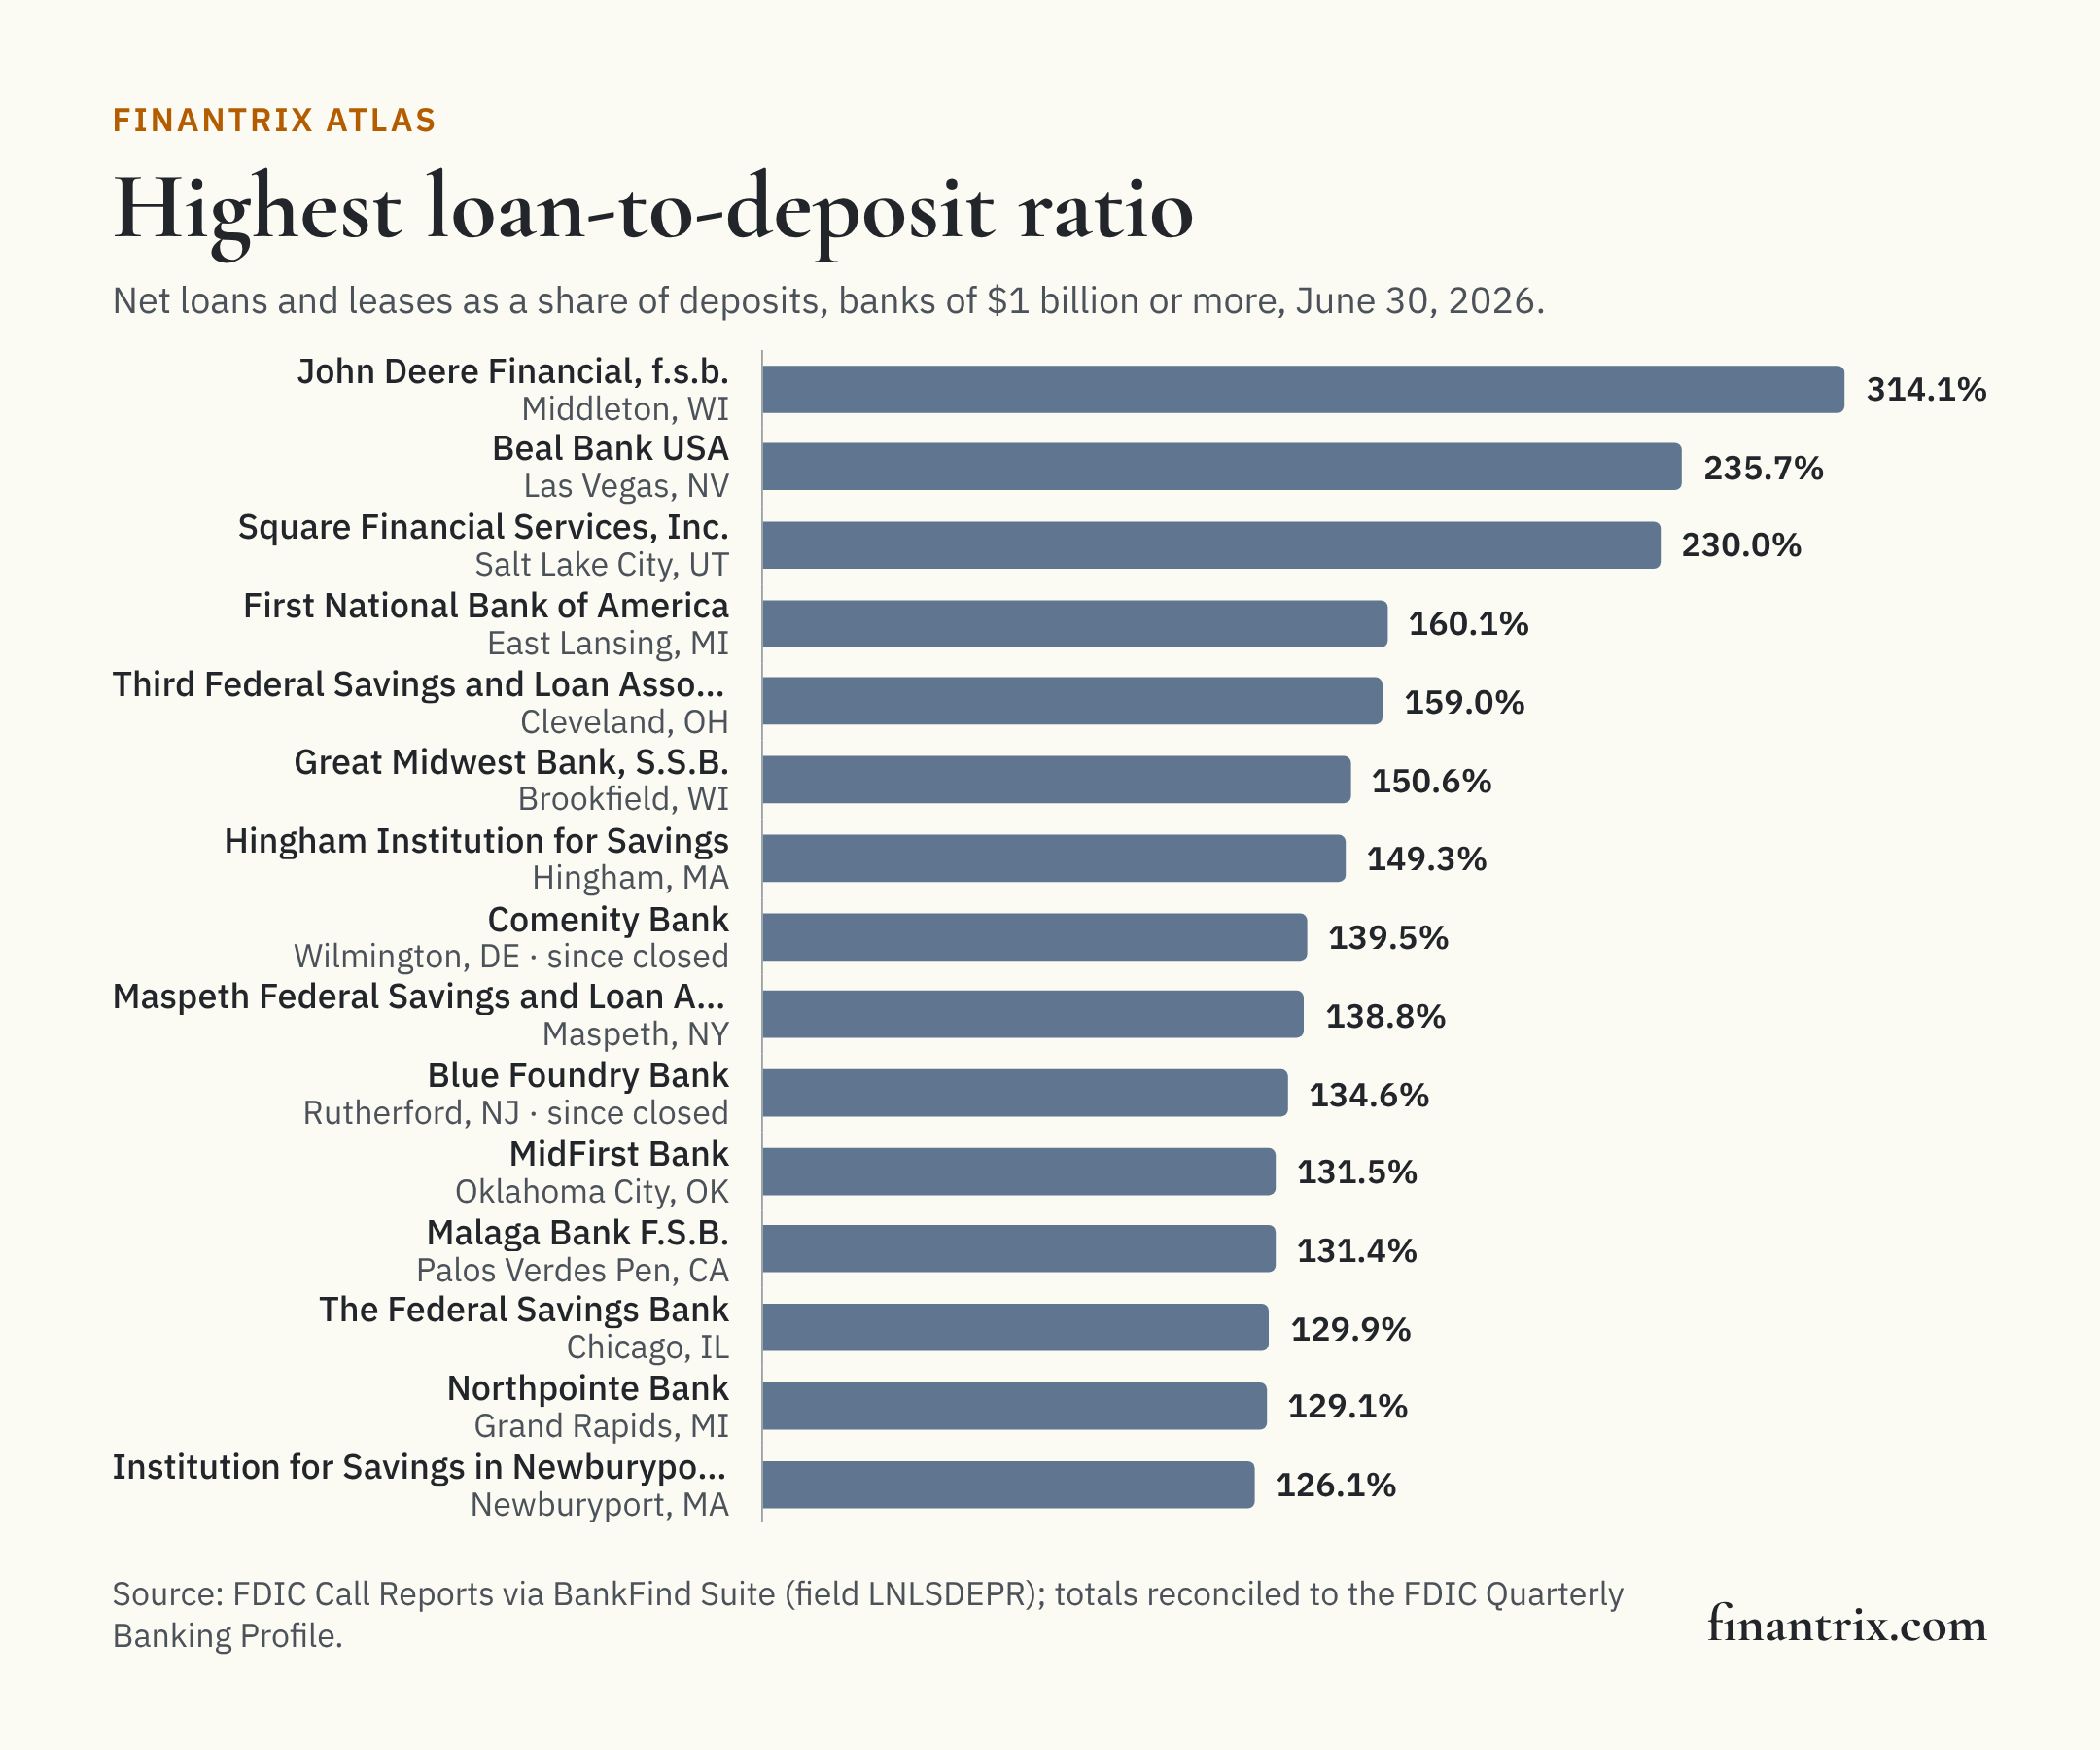
The 50 banks with the highest loan-to-deposit ratio
Ranked by loan-to-deposit ratio, as the FDIC computes it, on June 30, 2026, among banks with $1 billion or more in assets. Each row is one bank charter, with the loans and deposits behind its ratio and its Federal Home Loan Bank advances as a share of assets. The ratio needed to make this list is 107.7% or higher.
| Rank | Bank | Headquarters | Loan-to-deposit ratio | Net loans and leases | Deposits | FHLB advances, share of assets | Total assets | Source |
|---|---|---|---|---|---|---|---|---|
| 1 | John Deere Financial, f.s.b. | Middleton, WI | 314.1% | $4.9 billion | $1.6 billion | 0.0% | $4.9 billion | FDIC |
| 2 | Beal Bank USA | Las Vegas, NV | 235.7% | $3.9 billion | $1.7 billion | 30.8% | $11.0 billion | FDIC |
| 3 | Square Financial Services, Inc. | Salt Lake City, UT | 230.0% | $1.3 billion | $559 million | 0.0% | $2.1 billion | FDIC |
| 4 | First National Bank of America | East Lansing, MI | 160.1% | $6.2 billion | $3.9 billion | 34.2% | $6.8 billion | FDIC |
| 5 | Third Federal Savings and Loan Association of Cleveland | Cleveland, OH | 159.0% | $16.2 billion | $10.2 billion | 31.3% | $18.1 billion | FDIC |
| 6 | Great Midwest Bank, S.S.B. | Brookfield, WI | 150.6% | $935 million | $621 million | 24.6% | $1.1 billion | FDIC |
| 7 | Hingham Institution for Savings | Hingham, MA | 149.3% | $3.9 billion | $2.6 billion | 30.8% | $4.6 billion | FDIC |
| 8 | Comenity Bank ‡ | Wilmington, DE | 139.5% | $5.6 billion | $4.0 billion | 0.0% | $7.4 billion | FDIC |
| 9 | Maspeth Federal Savings and Loan Association | Maspeth, NY | 138.8% | $1.9 billion | $1.4 billion | 0.0% | $2.2 billion | FDIC |
| 10 | Blue Foundry Bank ‡ | Rutherford, NJ | 134.6% | $1.7 billion | $1.2 billion | 18.7% | $1.9 billion | FDIC |
| 11 | MidFirst Bank | Oklahoma City, OK | 131.5% | $33.3 billion | $25.3 billion | 30.5% | $42.8 billion | FDIC |
| 12 | Malaga Bank F.S.B. | Palos Verdes Pen, CA | 131.4% | $1.2 billion | $942 million | 17.6% | $1.4 billion | FDIC |
| 13 | The Federal Savings Bank | Chicago, IL | 129.9% | $962 million | $741 million | 12.0% | $1.1 billion | FDIC |
| 14 | Northpointe Bank | Grand Rapids, MI | 129.1% | $6.8 billion | $5.3 billion | 19.0% | $7.5 billion | FDIC |
| 15 | Institution for Savings in Newburyport and Its Vicinity | Newburyport, MA | 126.1% | $4.2 billion | $3.4 billion | 26.0% | $5.6 billion | FDIC |
| 16 | Ponce Bank | Bronx, NY | 126.1% | $2.9 billion | $2.3 billion | 17.8% | $3.5 billion | FDIC |
| 17 | NorthEast Community Bank | White Plains, NY | 123.9% | $1.9 billion | $1.5 billion | 0.0% | $2.1 billion | FDIC |
| 18 | WaterStone Bank, SSB | Wauwatosa, WI | 123.7% | $1.8 billion | $1.5 billion | 18.0% | $2.3 billion | FDIC |
| 19 | Gateway First Bank | Jenks, OK | 123.4% | $1.6 billion | $1.3 billion | 19.1% | $2.1 billion | FDIC |
| 20 | Financial Federal Bank | Memphis, TN | 122.0% | $1.1 billion | $880 million | 10.9% | $1.1 billion | FDIC |
| 21 | Industrial and Commercial Bank of China USA | New York, NY | 122.0% | $2.7 billion | $2.2 billion | 1.0% | $2.9 billion | FDIC |
| 22 | Northeast Bank | Portland, ME | 121.5% | $4.5 billion | $3.7 billion | 16.0% | $5.2 billion | FDIC |
| 23 | Olympia Federal Savings and Loan Association | Olympia, WA | 120.9% | $858 million | $710 million | 18.5% | $1.0 billion | FDIC |
| 24 | United Bankers' Bank | Richfield, MN | 120.6% | $767 million | $636 million | 3.8% | $1.1 billion | FDIC |
| 25 | Merchants Bank of Indiana | Carmel, IN | 120.5% | $17.3 billion | $14.3 billion | 19.9% | $21.2 billion | FDIC |
| 26 | Ixonia Bank | Ixonia, WI | 119.4% | $812 million | $680 million | 18.9% | $1.1 billion | FDIC |
| 27 | Saco & Biddeford Savings Institution | Saco, ME | 118.7% | $1.2 billion | $1.0 billion | 21.6% | $1.5 billion | FDIC |
| 28 | Capitol Federal Savings Bank | Topeka, KS | 118.1% | $8.2 billion | $6.9 billion | 16.9% | $9.7 billion | FDIC |
| 29 | Credit One Bank | Las Vegas, NV | 117.2% | $1.7 billion | $1.4 billion | 0.0% | $2.4 billion | FDIC |
| 30 | Kish Bank | Belleville, PA | 116.5% | $1.8 billion | $1.5 billion | 12.0% | $2.1 billion | FDIC |
| 31 | Bankers' Bank | Madison, WI | 116.2% | $1.1 billion | $952 million | 19.4% | $1.5 billion | FDIC |
| 32 | North American Savings Bank, F.S.B. | Grandview, MO | 116.2% | $2.2 billion | $1.9 billion | 27.8% | $3.2 billion | FDIC |
| 33 | Everett Co-operative Bank | Everett, MA | 115.8% | $1.4 billion | $1.2 billion | 17.1% | $1.7 billion | FDIC |
| 34 | Celtic Bank | Salt Lake City, UT | 115.4% | $4.5 billion | $3.9 billion | 8.4% | $5.3 billion | FDIC |
| 35 | Stearns Bank | Saint Cloud, MN | 114.8% | $2.7 billion | $2.4 billion | 5.2% | $3.3 billion | FDIC |
| 36 | Bank of Washington | Washington, MO | 113.7% | $1.0 billion | $888 million | 9.1% | $1.1 billion | FDIC |
| 37 | Parke Bank | Sewell, NJ | 113.3% | $2.0 billion | $1.8 billion | 7.1% | $2.3 billion | FDIC |
| 38 | Provident Savings Bank, F.S.B. | Riverside, CA | 112.6% | $1.0 billion | $917 million | 13.0% | $1.2 billion | FDIC |
| 39 | Salem Five Cents Savings Bank | Salem, MA | 111.7% | $6.8 billion | $6.0 billion | 18.0% | $8.8 billion | FDIC |
| 40 | Metro City Bank | Doraville, GA | 111.5% | $3.9 billion | $3.5 billion | 8.4% | $4.5 billion | FDIC |
| 41 | River Bank | Stoddard, WI | 111.3% | $841 million | $756 million | 12.8% | $1.0 billion | FDIC |
| 42 | First General Bank | Rowland Heights, CA | 111.1% | $931 million | $838 million | 0.0% | $1.2 billion | FDIC |
| 43 | Medallion Bank | Salt Lake City, UT | 111.1% | $2.6 billion | $2.3 billion | 0.0% | $2.8 billion | FDIC |
| 44 | Kennebec Savings Bank | Augusta, ME | 110.8% | $1.6 billion | $1.4 billion | 10.3% | $1.9 billion | FDIC |
| 45 | Chelsea Groton Bank | Groton, CT | 110.4% | $1.3 billion | $1.2 billion | 10.6% | $1.8 billion | FDIC |
| 46 | American State Bank | Sioux Center, IA | 109.7% | $1.3 billion | $1.2 billion | 4.4% | $1.4 billion | FDIC |
| 47 | Cornerstone Capital Bank, SSB | Houston, TX | 109.3% | $2.6 billion | $2.4 billion | 0.0% | $3.7 billion | FDIC |
| 48 | 1st Security Bank of Washington | Mountlake Terrac, WA | 107.9% | $2.7 billion | $2.5 billion | 8.5% | $3.2 billion | FDIC |
| 49 | Cambridge Savings Bank | Cambridge, MA | 107.7% | $5.8 billion | $5.4 billion | 11.6% | $7.0 billion | FDIC |
| 50 | First Federal Savings and Loan Association of Lakewood | Lakewood, OH | 107.7% | $2.4 billion | $2.2 billion | 15.3% | $2.9 billion | FDIC |
‡ Closed after June 30, 2026: Comenity Bank (Wilmington, DE) on October 1, 2026; Blue Foundry Bank (Rutherford, NJ) on July 13, 2026. The FDIC records the end of the charter; the figures shown are those it reported for June 30, 2026.
Download this table (CSV), free. The full dataset, every bank of $1 billion or more with its loans, deposits, FHLB advances and identifiers, is one email away.
The lowest ratios
The banks of $1 billion or more that lend the least of their deposits, among those that report any loans. Charles Schwab Premier Bank, SSB reports 0.0%. The list includes banks owned by brokerage firms, a bank owned by a prepaid card company, and custody and trust banks, alongside community banks.
| Rank | Bank | Headquarters | Loan-to-deposit ratio | Net loans and leases | Deposits |
|---|---|---|---|---|---|
| 1 | Charles Schwab Premier Bank, SSB | Westlake, TX | 0.0% | $1 million | $24.5 billion |
| 2 | Sumitomo Mitsui Trust Bank (U.S.A.) Limited | Hoboken, NJ | 0.0% | $437,000 | $3.3 billion |
| 3 | Green Dot Bank DBA Bonneville Bank | Provo, UT | 0.7% | $34 million | $5.0 billion |
| 4 | Erebor Bank | Columbus, OH | 1.9% | $77 million | $4.1 billion |
| 5 | Jonesboro State Bank | Jonesboro, LA | 6.2% | $74 million | $1.2 billion |
| 6 | Ameriprise Bank, FSB | Minneapolis, MN | 10.9% | $2.6 billion | $23.9 billion |
| 7 | Bessemer Trust Company | Woodbridge, NJ | 11.2% | $246 million | $2.2 billion |
| 8 | The Bank of New York Mellon | New York, NY | 12.5% | $46.5 billion | $373 billion |
| 9 | Chain Bridge Bank | McLean, VA | 13.5% | $271 million | $2.0 billion |
| 10 | Westamerica Bank | San Rafael, CA | 13.8% | $658 million | $4.8 billion |
| 11 | Bank of Utica | Utica, NY | 14.3% | $153 million | $1.1 billion |
| 12 | State Street Bank and Trust Company | Boston, MA | 16.0% | $52.2 billion | $326 billion |
| 13 | Union County Savings Bank | Elizabeth, NJ | 22.7% | $307 million | $1.3 billion |
| 14 | Mizuho Bank (USA) | New York, NY | 22.9% | $399 million | $1.7 billion |
| 15 | Column | Salt Lake City, UT | 23.3% | $357 million | $1.5 billion |
What this means for technology buyers
A bank's ratio is a funding decision: how much of its lending to support with deposits, and how much with borrowing. The systems behind it gather deposits, forecast cash and measure liquidity day to day. These guides compare the options side by side:
- Deposit management platforms for retail banks: product configuration, pricing and the account lifecycle.
- Financial BI and dashboarding for bank executives: measuring funding and lending by line.
- Mobile banking apps for regional banks: gathering deposits beyond the branch footprint.
Planning the change before choosing the vendor? The Banking and Payments Capability Matrix states what a bank does, from taking deposits to originating credit, so a platform can be placed against the capabilities it supports.
More from Finantrix Atlas
- US banks by net interest margin
- US banks by uninsured deposits
- US banks by brokered deposits
- Largest US banks by deposits
How this list was built
The population is every FDIC-insured commercial bank and savings institution that filed a Call Report for June 30, 2026 with $1 billion or more in total assets, read from the FDIC's BankFind Suite, including banks whose charter has ended since. Banks are ranked by the FDIC field LNLSDEPR, which the FDIC's field definitions describe as loans and lease financing receivables net of unearned income, allowances and reserves as a percent of total deposits. Every bank's ratio equals its net loans and leases over its deposits; nothing on this page recomputes it.
The industry ratio divides net loans and leases by deposits, each summed across the 4,238 institutions in the FDIC's Quarterly Banking Profile, the edition for the second quarter of 2026. Both sums, and the banks' Federal Home Loan Bank advances, equal the lines it prints to the million dollars.
Limits
- One date. The ratio uses balances on June 30, 2026, which move with the season and with large deposits arriving or leaving.
- Net of reserves. Loans are counted after the allowance for credit losses, so a bank with a large reserve shows a lower ratio.
- Business models differ. Lenders funded mainly by borrowing, and banks that hold deposits for others, sit at the extremes for reasons of business mix. A high or low ratio is not a finding about a bank's safety.
- Banks of $1 billion or more, the floor the other Finantrix Atlas ratio pages use.
- Banks, not holding companies. A group with several charters appears once per charter.
Cite this
Free to quote, cite and republish, including the chart, with credit to Finantrix Atlas and a link to this page.
FDIC-insured US banks held net loans equal to 66.2% of their deposits on June 30, 2026, according to a Finantrix Atlas analysis of FDIC data.
Suggested citation: Finantrix Atlas, "US Banks by Loan-to-Deposit Ratio," data as of June 30, 2026, from FDIC Call Reports and the FDIC Quarterly Banking Profile. https://www.finantrix.com/articles/banks-loan-to-deposit-ratio
Embed the chart:
<a href="https://www.finantrix.com/articles/banks-loan-to-deposit-ratio"><img src="https://www.finantrix.com/atlas/banks-loan-to-deposit-ratio.png?v=2026-06-30" alt="The US banks with the highest loan-to-deposit ratio, from FDIC data, by Finantrix Atlas"></a>
<p>Chart: <a href="https://www.finantrix.com/articles/banks-loan-to-deposit-ratio">Finantrix Atlas</a>, from FDIC Call Reports.</p>
Frequently asked questions
Q: What is the average loan-to-deposit ratio for US banks? A: Across all FDIC-insured banks, net loans and leases were 66.2% of deposits on June 30, 2026, according to FDIC data. The median bank with $1 billion or more in assets reported 86.3%.
Q: Which US bank has the highest loan-to-deposit ratio? A: Among banks with $1 billion or more in assets, John Deere Financial, f.s.b., at 314.1% on June 30, 2026, according to FDIC data.
Q: How can a bank lend more than its deposits? A: By funding the difference with borrowing, such as Federal Home Loan Bank advances, or with capital. 135 of the 1,048 banks with $1 billion or more in assets did so on June 30, 2026, according to FDIC data.
Download the data
Two CSV files, free: the 50 rows on this page, and the full dataset of all 1,048 rows, as of June 30, 2026.
Frequently Asked Questions
What is the average loan-to-deposit ratio for US banks?
Across all FDIC-insured banks, net loans and leases were 66.2% of deposits on June 30, 2026, according to FDIC data. The median bank with $1 billion or more in assets reported 86.3%.
Which US bank has the highest loan-to-deposit ratio?
Among banks with $1 billion or more in assets, John Deere Financial, f.s.b., at 314.1% on June 30, 2026, according to FDIC data.
How can a bank lend more than its deposits?
By funding the difference with borrowing, such as Federal Home Loan Bank advances, or with capital. 135 of the 1,048 banks with $1 billion or more in assets did so on June 30, 2026, according to FDIC data.