
Key Takeaways
- Celtic Bank grew its commercial loans fastest of the 418 US banks with at least $1 billion in them a year earlier: +42.7%, from $1.6 billion to $2.3 billion, according to FDIC Call Report data.
- The median bank of that size changed its commercial loans by +3.7% over the year to June 30, 2026.
- Growth is measured against the bank plus every charter it absorbed during the year, so a merger does not count as growth; 1 of the top 25 absorbed at least one.
- Commercial loans here are business loans plus commercial real estate, as the FDIC's Call Report fields record them.
Celtic Bank grew its commercial loans fastest of the 418 US banks that held at least $1 billion in them a year earlier: +42.7%, from $1.6 billion on June 30, 2025 to $2.3 billion on June 30, 2026, according to FDIC Call Report data. Macatawa Bank follows at +42.3% and Morgan Stanley Bank at +41.7%. The median bank of that size changed its commercial loans by +3.7%, and 294 of the 418 grew them.
Commercial loans here are loans to businesses plus commercial real estate: construction and land development, multifamily, nonfarm nonresidential property not occupied by its owner, and other loans to finance commercial real estate. A bank that buys another grows on paper without lending more, so each bank's starting figure includes the commercial loans of every bank charter it absorbed during the year, read from the same date. 1 of the top 25 absorbed at least one.
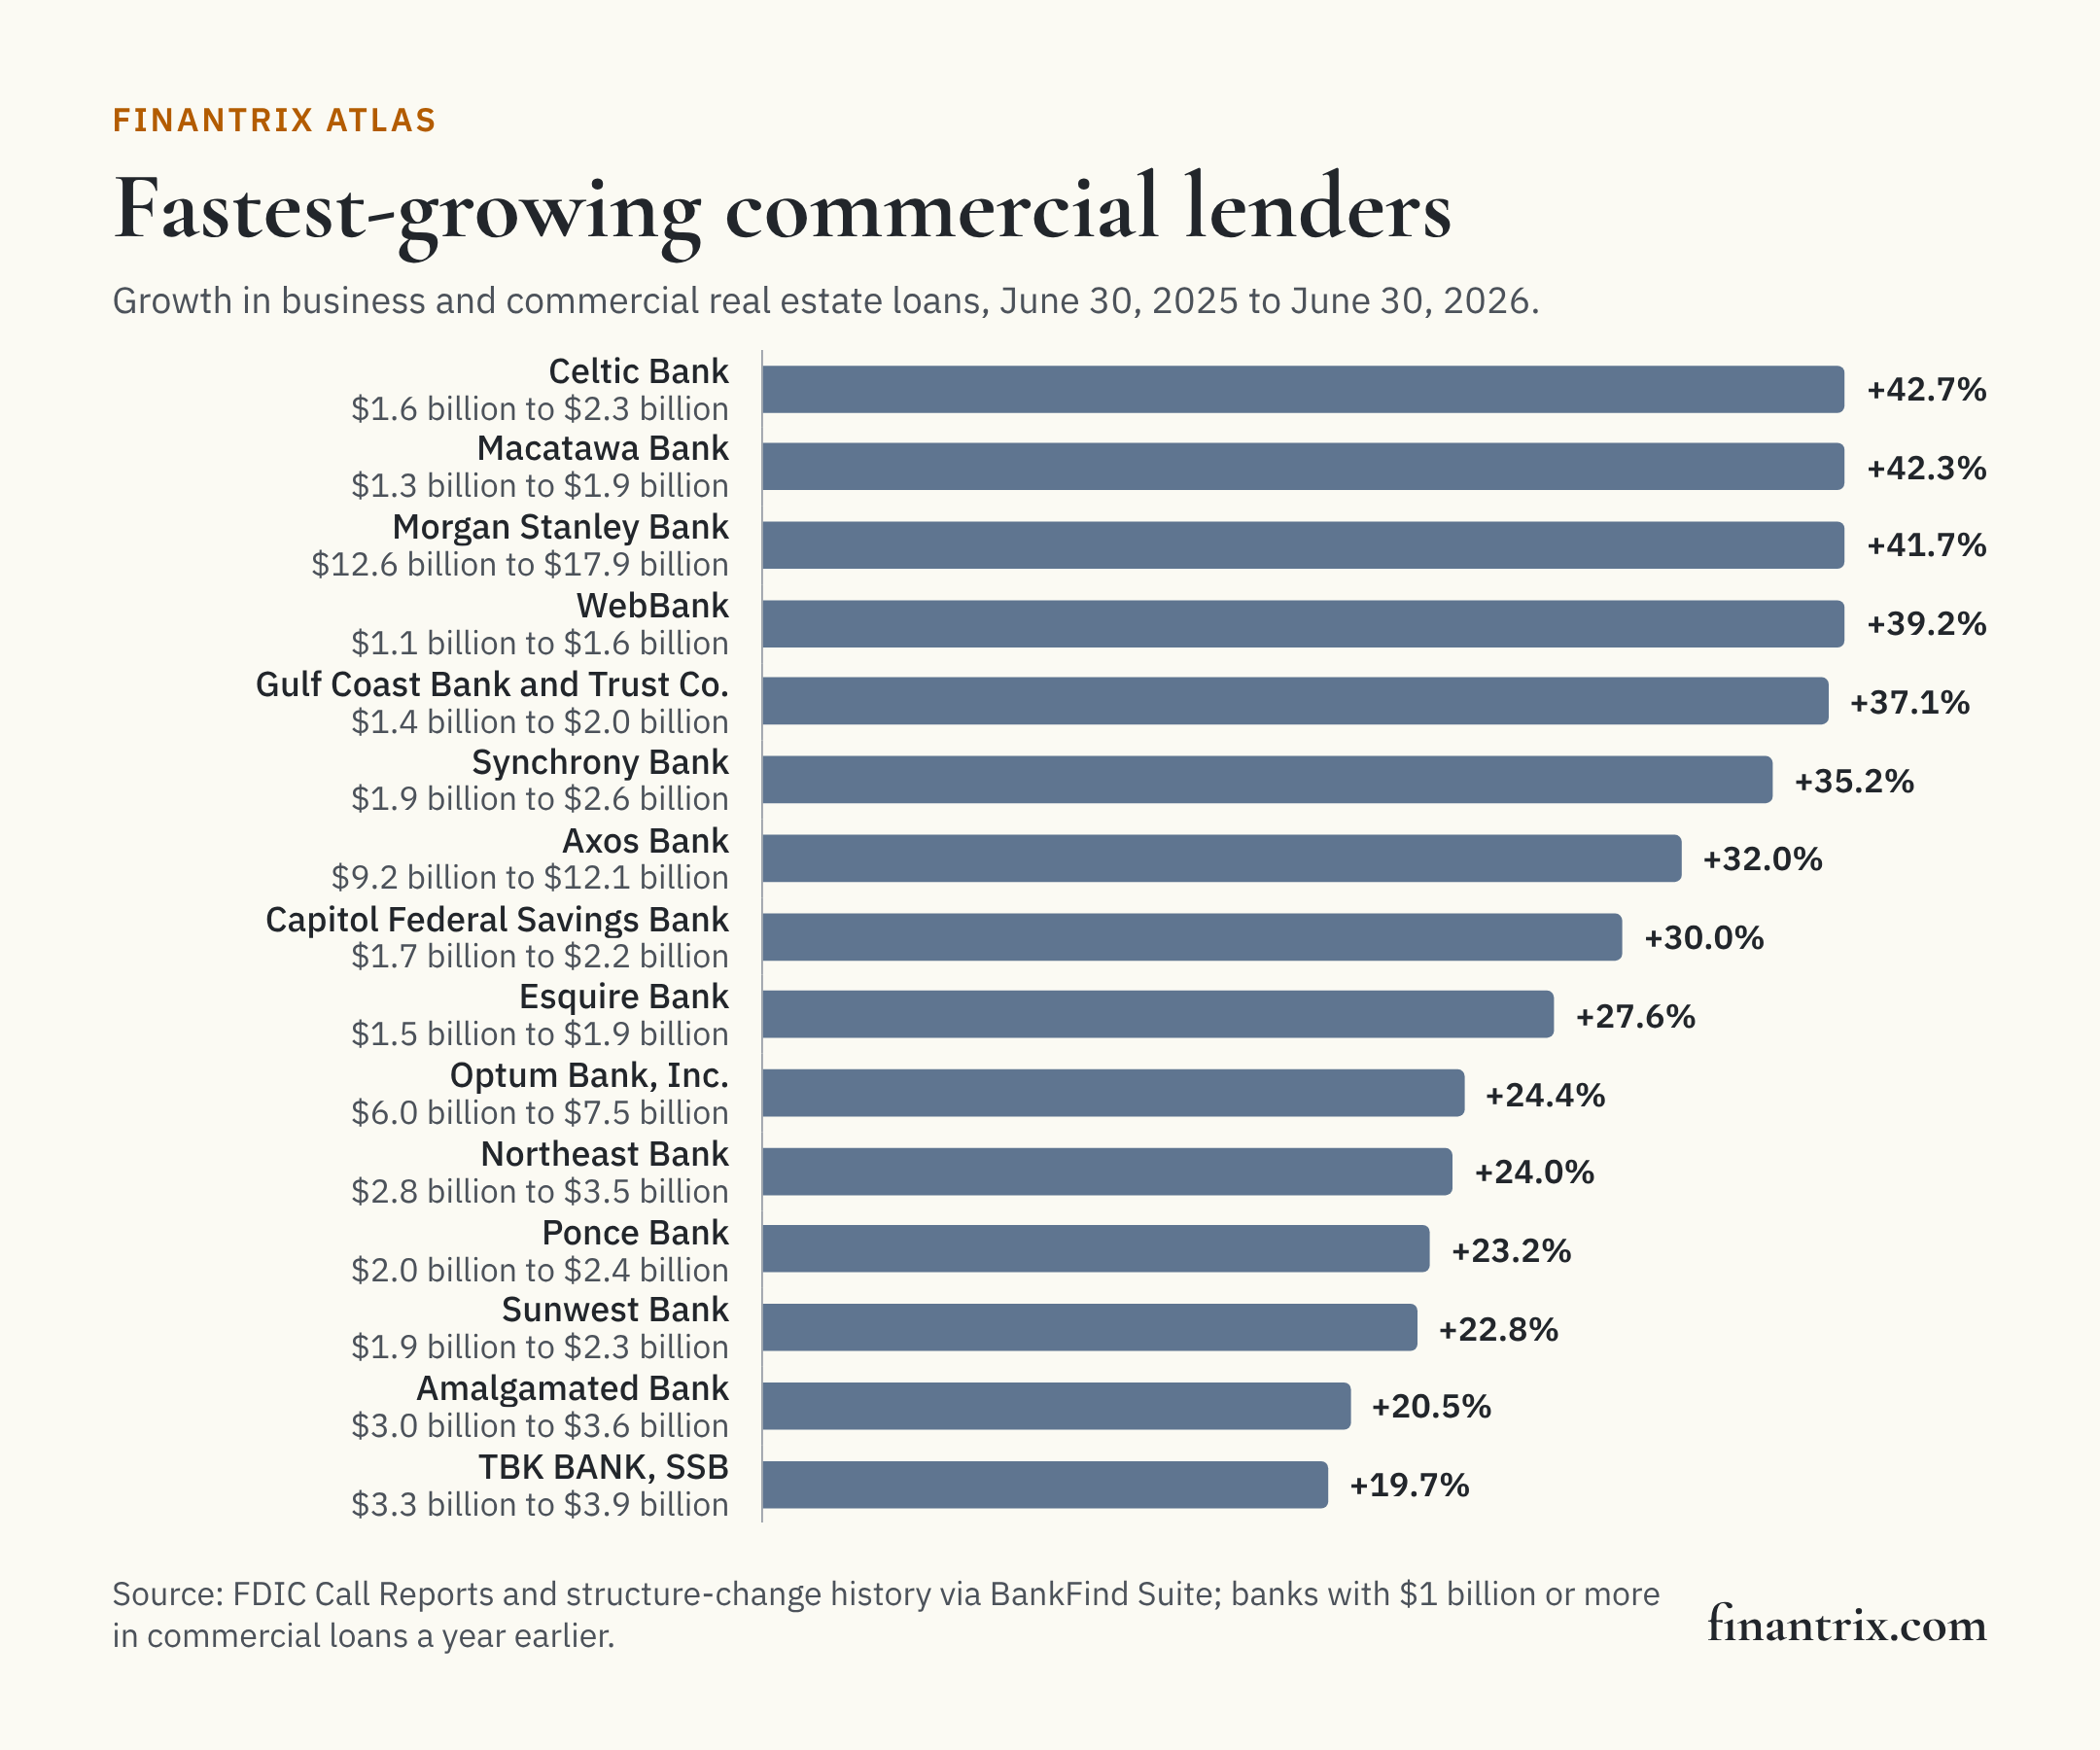
The 25 fastest-growing commercial lenders
Ranked by growth in commercial loans from June 30, 2025 to June 30, 2026, against the bank's own loans plus those of any charter it absorbed. Each row is one bank charter, with business loans and commercial real estate shown separately.
| Rank | Bank | Headquarters | Commercial loans | A year earlier, with absorbed charters | Growth | Business loans | Commercial real estate | Charters absorbed in the year | Source |
|---|---|---|---|---|---|---|---|---|---|
| 1 | Celtic Bank | Salt Lake City, UT | $2.3 billion | $1.6 billion | +42.7% | +44.3% | +14.9% | None | FDIC |
| 2 | Macatawa Bank | Holland, MI | $1.9 billion | $1.3 billion | +42.3% | +42.7% | +41.2% | None | FDIC |
| 3 | Morgan Stanley Bank | Salt Lake City, UT | $17.9 billion | $12.6 billion | +41.7% | +126.1% | +7.9% | None | FDIC |
| 4 | WebBank | Salt Lake City, UT | $1.6 billion | $1.1 billion | +39.2% | +39.3% | +17.5% | None | FDIC |
| 5 | Gulf Coast Bank and Trust Company | New Orleans, LA | $2.0 billion | $1.4 billion | +37.1% | +44.9% | +23.8% | None | FDIC |
| 6 | Synchrony Bank | Draper, UT | $2.6 billion | $1.9 billion | +35.2% | +36.7% | -76.0% | None | FDIC |
| 7 | Axos Bank | San Diego, CA | $12.1 billion | $9.2 billion | +32.0% | +79.6% | +21.6% | None | FDIC |
| 8 | Capitol Federal Savings Bank | Topeka, KS | $2.2 billion | $1.7 billion | +30.0% | +52.7% | +27.3% | None | FDIC |
| 9 | Esquire Bank | Jericho, NY | $1.9 billion | $1.5 billion | +27.6% | +33.5% | +14.5% | None | FDIC |
| 10 | Optum Bank, Inc. | Draper, UT | $7.5 billion | $6.0 billion | +24.4% | +31.5% | +23.3% | None | FDIC |
| 11 | Northeast Bank | Portland, ME | $3.5 billion | $2.8 billion | +24.0% | +56.5% | +22.1% | None | FDIC |
| 12 | Ponce Bank | Bronx, NY | $2.4 billion | $2.0 billion | +23.2% | +53.6% | +22.5% | None | FDIC |
| 13 | Sunwest Bank | Sandy, UT | $2.3 billion | $1.9 billion | +22.8% | +108.0% | +3.1% | None | FDIC |
| 14 | Amalgamated Bank | New York, NY | $3.6 billion | $3.0 billion | +20.5% | +9.2% | +27.7% | None | FDIC |
| 15 | TBK BANK, SSB | Dallas, TX | $3.9 billion | $3.3 billion | +19.7% | +30.5% | -14.3% | None | FDIC |
| 16 | Five Star Bank | Roseville, CA | $3.4 billion | $2.8 billion | +19.5% | +18.3% | +19.5% | None | FDIC |
| 17 | Habib American Bank | New York, NY | $1.5 billion | $1.2 billion | +18.5% | -25.1% | +20.1% | None | FDIC |
| 18 | Ally Bank | Sandy, UT | $38.3 billion | $32.4 billion | +18.5% | +16.6% | +40.3% | None | FDIC |
| 19 | EverBank | Jacksonville, FL | $10.2 billion | $8.6 billion | +18.1% | +34.6% | +15.6% | None | FDIC |
| 20 | Forbright Bank | Potomac, MD | $2.3 billion | $2.0 billion | +17.9% | +5.9% | +28.3% | None | FDIC |
| 21 | Goldman Sachs Bank USA | New York, NY | $46.9 billion | $39.9 billion | +17.7% | +26.1% | +5.4% | None | FDIC |
| 22 | Capital Bank | Rockville, MD | $1.9 billion | $1.6 billion | +17.7% | +23.9% | +14.0% | None | FDIC |
| 23 | Third Coast Bank | Humble, TX | $4.9 billion | $4.1 billion | +17.4% | +25.9% | +10.3% | Keystone Bank, SSB | FDIC |
| 24 | Chemung Canal Trust Company | Elmira, NY | $1.7 billion | $1.4 billion | +16.3% | +12.4% | +17.2% | None | FDIC |
| 25 | Maine Community Bank | Portland, ME | $1.4 billion | $1.2 billion | +16.0% | +5.9% | +18.2% | None | FDIC |
Download this table (CSV), free. The full dataset, every ranked bank with both parts on both dates and the charters it absorbed, is one email away.
What this means for technology buyers
A commercial book that grows quickly puts its weight on origination and credit: more applications to underwrite, more relationships to manage, and more loans to monitor once they are booked. These guides compare the options side by side:
- Commercial loan origination systems: from application to booked loan for business credit.
- Underwriting workflow automation for commercial banks: spreading, credit memos and approvals.
- CRM for commercial banking teams: managing the relationships behind the loans.
Planning the change before choosing the vendor? The Banking and Payments Capability Matrix states what a bank does, from taking deposits to originating credit, so a lending platform can be placed against the capabilities it supports.
More from Finantrix Atlas
- Largest US commercial and industrial lenders
- Largest US commercial real estate lenders
- Banks' CRE concentration against capital
- Fastest-growing US banks
How this list was built
The universe is every FDIC-insured commercial bank and savings institution that filed a Call Report for June 30, 2026 and for June 30, 2025, read from the FDIC's BankFind Suite. Commercial loans are commercial and industrial loans (LNCI) plus the four fields the largest CRE lenders page sums: construction and land development (LNRECONS), multifamily (LNREMULT), nonfarm nonresidential property not occupied by its owner (LNRENROT), and loans to finance commercial real estate not secured by real estate (LNCOMRE).
Charters absorbed during the year come from the FDIC's structure-change history: every event in which another charter ended inside the bank, by merger, consolidation, absorption or the acquisition of a failed bank. Each absorbed charter's commercial loans are read from its own Call Report for June 30, 2025 and added to the bank's starting figure. Only banks whose starting figure was $1 billion or more are ranked, so a small base cannot produce a large percentage.
The FDIC's Quarterly Banking Profile, the edition for the second quarter of 2026, prints business, construction and multifamily loans for the industry. Summed across the same institutions, the banks' figures for June 30, 2026 equal those lines to the million dollars.
Limits
- Branches and loans bought. Loans bought in a pool or with branches from another bank count as growth; the FDIC's records give no balance for them.
- Loans on the books. Loans a bank sold or participated out are not counted, and unused lines are not loans.
- Banks, not holding companies. A group that lends through several charters appears once per charter.
- One year. Growth runs from June 30, 2025 to June 30, 2026.
Cite this
Free to quote, cite and republish, including the chart, with credit to Finantrix Atlas and a link to this page.
Celtic Bank grew its commercial loans +42.7% in the year to June 30, 2026, the fastest of any US bank with at least $1 billion in them, according to a Finantrix Atlas analysis of FDIC data.
Suggested citation: Finantrix Atlas, "Fastest-Growing US Bank Commercial Lenders," June 30, 2025 to June 30, 2026, from FDIC Call Reports and structure-change history. https://www.finantrix.com/articles/fastest-growing-commercial-lenders
Embed the chart:
<a href="https://www.finantrix.com/articles/fastest-growing-commercial-lenders"><img src="https://www.finantrix.com/atlas/fastest-growing-commercial-lenders.png?v=2026-06-30" alt="The fastest-growing commercial lenders among US banks, from FDIC data, by Finantrix Atlas"></a>
<p>Chart: <a href="https://www.finantrix.com/articles/fastest-growing-commercial-lenders">Finantrix Atlas</a>, from FDIC Call Reports.</p>
Frequently asked questions
Q: Which US bank grew its commercial loans the fastest? A: Among banks with at least $1 billion in commercial loans a year earlier, Celtic Bank, up +42.7% in the year to June 30, 2026, according to FDIC data.
Q: How fast are bank commercial loans growing? A: The median bank with $1 billion or more in commercial loans changed them by +3.7% in the year to June 30, 2026, according to FDIC data.
Q: Does growth from a merger count? A: No. Each bank's starting figure includes the commercial loans of every charter it absorbed during the year, so growth from a merger is netted out.
Download the data
Two CSV files, free: the 25 rows on this page, and the full dataset of all 418 rows, as of June 30, 2026.
Frequently Asked Questions
Which US bank grew its commercial loans the fastest?
Among banks with at least $1 billion in commercial loans a year earlier, Celtic Bank, up +42.7% in the year to June 30, 2026, according to FDIC data.
How fast are bank commercial loans growing?
The median bank with $1 billion or more in commercial loans changed them by +3.7% in the year to June 30, 2026, according to FDIC data.
Does growth from a merger count?
No. Each bank's starting figure includes the commercial loans of every charter it absorbed during the year, so growth from a merger is netted out.