
Key Takeaways
- Wells Fargo Bank originated $21.6 billion of multifamily loans in 2025, more than any other HMDA reporter, according to FFIEC HMDA data.
- JPMorgan Chase Bank made the most multifamily loans by count, 3,892, more than the next six lenders combined, according to HMDA filings.
- HMDA reporters originated 43,226 multifamily loans worth $269 billion in 2025, according to the FFIEC, up 30% by dollar volume from 2024.
- Nonbank lenders made 48.8% of multifamily dollar volume in 2025, according to HMDA data; banks made 48.2%.
Wells Fargo Bank originated $21.6 billion of multifamily loans in 2025, more than any other lender reporting under HMDA, ahead of Walker & Dunlop at $20.0 billion, according to FFIEC HMDA data. By number of loans the leader is JPMorgan Chase Bank, with 3,892 at an average of $4.6 million, more than the next six lenders combined, according to the same filings.
HMDA reporters originated 43,226 multifamily loans, on properties of five or more units, worth $269 billion in 2025, according to the FFIEC, up 30% by dollar volume from 2024. The ten largest lenders made 45% of the volume ranked here, according to HMDA filings.
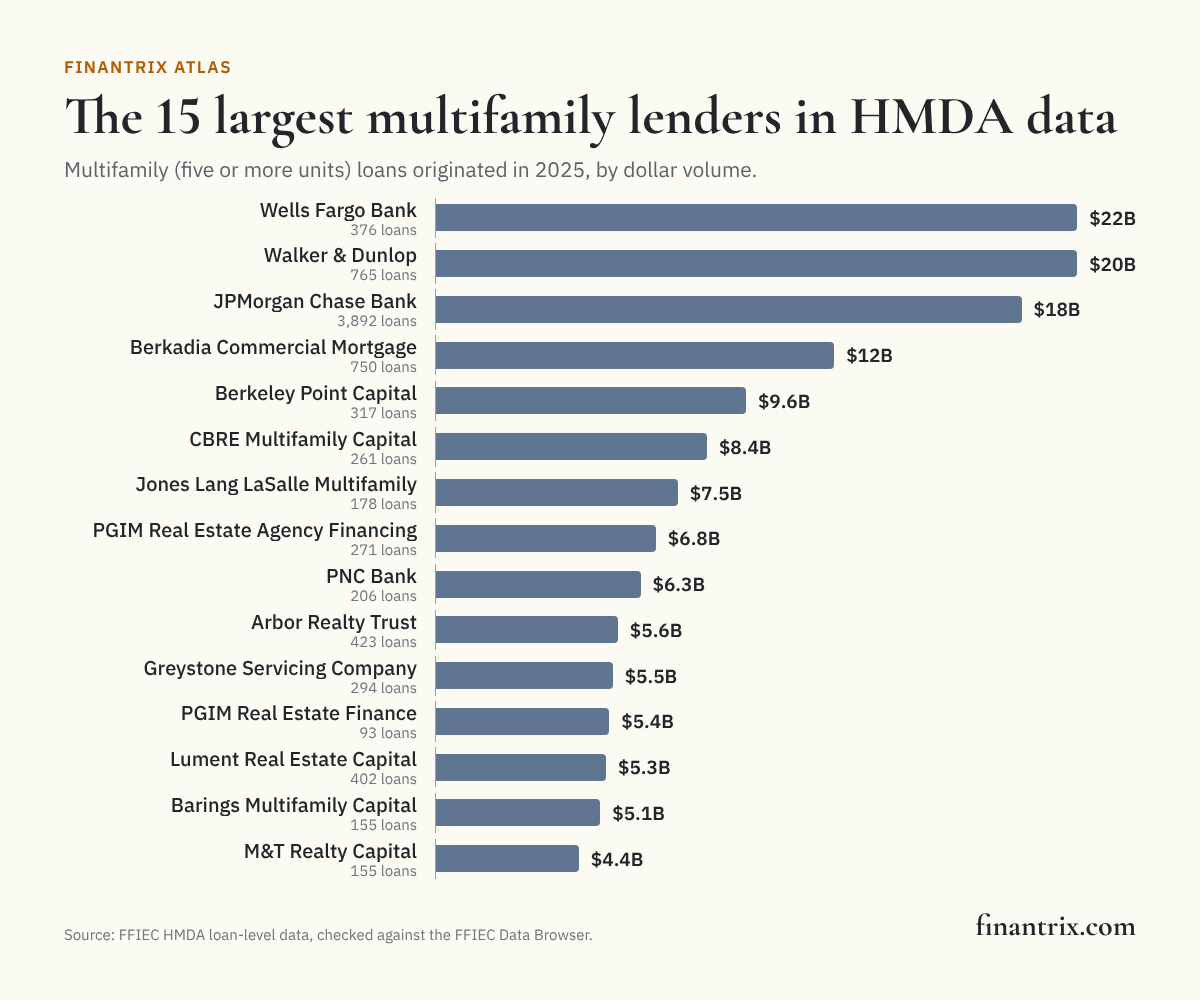
The 25 largest multifamily lenders, 2025
Ranked by the dollar amount of multifamily loans originated in 2025. Each row is one HMDA filer, named as it filed.
| Rank | Lender (as filed) | Type | Multifamily loans originated | Loans | Average loan | 2024 rank | Source |
|---|---|---|---|---|---|---|---|
| 1 | Wells Fargo Bank, National Association | Bank | $21.6 billion | 376 | $57.5 million | 1 | FFIEC |
| 2 | Walker & Dunlop, LLC | Nonbank | $20.0 billion | 765 | $26.1 million | 2 | FFIEC |
| 3 | JPMorgan Chase Bank, National Association ‡ | Bank | $18.1 billion | 3,892 | $4.6 million | 3 | FFIEC |
| 4 | Berkadia Commercial Mortgage LLC ‡ | Nonbank, depository-affiliated | $12.3 billion | 750 | $16.4 million | 4 | FFIEC |
| 5 | Berkeley Point Capital LLC | Nonbank | $9.6 billion | 317 | $30.2 million | 8 | FFIEC |
| 6 | CBRE Multifamily Capital, Inc. | Nonbank | $8.4 billion | 261 | $32.1 million | 6 | FFIEC |
| 7 | Jones Lang LaSalle Multifamily, LLC | Nonbank | $7.5 billion | 178 | $42.0 million | 5 | FFIEC |
| 8 | PGIM Real Estate Agency Financing, LLC | Nonbank | $6.8 billion | 271 | $25.1 million | 14 | FFIEC |
| 9 | PNC Bank, National Association | Bank | $6.3 billion | 206 | $30.7 million | 11 | FFIEC |
| 10 | Arbor Realty Trust, Inc. | Nonbank | $5.6 billion | 423 | $13.3 million | 10 | FFIEC |
| 11 | Greystone Servicing Company LLC | Nonbank | $5.5 billion | 294 | $18.6 million | 7 | FFIEC |
| 12 | PGIM Real Estate Finance, LLC | Nonbank | $5.4 billion | 93 | $57.6 million | 15 | FFIEC |
| 13 | Lument Real Estate Capital, LLC | Nonbank | $5.3 billion | 402 | $13.1 million | 9 | FFIEC |
| 14 | Barings Multifamily Capital LLC | Nonbank | $5.1 billion | 155 | $32.8 million | 18 | FFIEC |
| 15 | M&T Realty Capital Corporation | Nonbank, depository-affiliated | $4.4 billion | 155 | $28.5 million | 12 | FFIEC |
| 16 | Bellwether Enterprise Real Estate Capital, LLC | Nonbank | $4.1 billion | 249 | $16.4 million | 17 | FFIEC |
| 17 | The Northwestern Mutual Life Insurance Company | Nonbank | $3.8 billion | 55 | $68.4 million | 13 | FFIEC |
| 18 | Northmarq Capital Finance, LLC | Nonbank | $2.7 billion | 136 | $20.0 million | 21 | FFIEC |
| 19 | Merchants Capital Corp. | Nonbank, depository-affiliated | $2.7 billion | 91 | $29.6 million | 22 | FFIEC |
| 20 | Citibank, National Association | Bank | $2.6 billion | 131 | $19.6 million | 19 | FFIEC |
| 21 | Truist Bank | Bank | $2.4 billion | 48 | $51.0 million | 109 | FFIEC |
| 22 | Colliers Mortgage LLC | Nonbank | $2.3 billion | 115 | $19.9 million | 28 | FFIEC |
| 23 | Regions Bank | Bank | $2.1 billion | 159 | $13.4 million | 16 | FFIEC |
| 24 | Grandbridge Real Estate Capital LLC | Nonbank, depository-affiliated | $1.9 billion | 58 | $32.5 million | 24 | FFIEC |
| 25 | Merchants Bank of Indiana | Bank | $1.8 billion | 82 | $21.4 million | 20 | FFIEC |
Download this table (CSV), free. The full dataset, every lender that reported a multifamily loan in 2025 with its LEI, loan counts by purpose and by property size, is one email away.
‡ Some of this lender's loans are set apart and not counted: each is larger than $2 million per unit at the top of the unit range its FFIEC HMDA record reports.
Set apart as a whole: Everwise Credit Union, which reported 11 multifamily loans totaling $5.1 billion according to its HMDA filing with the FFIEC; 7 of its 11 multifamily loans are above the per-unit cap, and the other 4 average $465 million, eight times the largest lender's average. It stays in the full dataset with its figures as filed.
The most multifamily loans
The same lenders ranked by the number of loans. A lender with many small-balance loans ranks higher here than by dollars.
| Rank | Lender (as filed) | Type | Multifamily loans | Dollar volume | Source |
|---|---|---|---|---|---|
| 1 | JPMorgan Chase Bank, National Association | Bank | 3,892 | $18.1 billion | FFIEC |
| 2 | RF Renovo Management Company, LLC | Nonbank | 798 | $1.1 billion | FFIEC |
| 3 | Walker & Dunlop, LLC | Nonbank | 765 | $20.0 billion | FFIEC |
| 4 | Berkadia Commercial Mortgage LLC | Nonbank, depository-affiliated | 750 | $12.3 billion | FFIEC |
| 5 | U.S. Bank National Association | Bank | 500 | $1.8 billion | FFIEC |
| 6 | Arbor Realty Trust, Inc. | Nonbank | 423 | $5.6 billion | FFIEC |
| 7 | Lument Real Estate Capital, LLC | Nonbank | 402 | $5.3 billion | FFIEC |
| 8 | Wells Fargo Bank, National Association | Bank | 376 | $21.6 billion | FFIEC |
| 9 | Velocity Commercial Capital, LLC | Nonbank | 330 | $191 million | FFIEC |
| 10 | Berkeley Point Capital LLC | Nonbank | 317 | $9.6 billion | FFIEC |
Banks and nonbanks
Nonbank lenders made 48.8% of multifamily dollar volume in 2025, and banks 48.2%, according to HMDA data. In multifamily lending, nonbank covers mortgage companies, life insurers and other lenders that no bank or credit union owns. A lender's type comes from the FDIC's and NCUA's records first, then the FFIEC's own codes, as on the bank and nonbank mortgage share page.
| Type of lender | Share of multifamily dollar volume | Source |
|---|---|---|
| Bank | 48.2% | FFIEC |
| Nonbank, not affiliated with a depository | 40.6% | FFIEC |
| Nonbank, owned by or affiliated with a bank or credit union | 8.2% | FFIEC |
| Credit union | 3.0% | FFIEC |
Multifamily lending by year
| Year | Multifamily loans | Dollar volume | Lenders reporting one or more | Edition | Source |
|---|---|---|---|---|---|
| 2018 | 52,307 | $233 billion | 2,836 | three-year | FFIEC |
| 2019 | 55,341 | $257 billion | 2,765 | three-year | FFIEC |
| 2020 | 55,108 | $249 billion | 2,226 | three-year | FFIEC |
| 2021 | 64,323 | $288 billion | 2,187 | three-year | FFIEC |
| 2022 | 61,351 | $332 billion | 2,225 | three-year | FFIEC |
| 2023 | 34,402 | $184 billion | 2,476 | one-year | FFIEC |
| 2024 | 32,620 | $207 billion | 2,413 | one-year | FFIEC |
| 2025 | 43,226 | $269 billion | 2,467 | snapshot | FFIEC |
What this means for technology buyers
A multifamily loan is underwritten on the property's income, so the lenders on this list work in commercial real estate systems rather than home-loan ones. These guides compare the options on each side of the loan:
- Real estate deal pipeline and underwriting platforms: sourcing and underwriting income-property deals.
- Loan origination systems for commercial lenders: the lender's side of a commercial real estate loan.
- Loan servicing platforms for specialty finance: servicing a loan after it closes.
- Property management software for multifamily and commercial: running the buildings the loans finance.
Mapping a real estate business before choosing its systems? The Real Estate Business Architecture Toolkit sets out what an owner, operator or lender does.
More from Finantrix Atlas
- Largest commercial real estate lenders
- Largest mortgage lenders
- Banks vs nonbanks in US mortgage lending
- Largest commercial lenders
How this list was built
The universe is every institution in the FFIEC's public HMDA loan-level file for 2025, from the snapshot edition, and for 2024, from the one-year edition: the newest the FFIEC has published for each year, which is what its Data Browser serves. A loan is counted when it was originated and its dwelling category is multifamily, site-built or manufactured. Each year's count and amount match the FFIEC Data Browser's national figures, and each lender in the table matches its own Data Browser figures.
14 loans worth $7.1 billion are set apart rather than ranked, according to HMDA filings: each is larger than $2 million per unit at the top of the unit range the file reports for it. One lender is set apart as a whole, as the note under the table says. Shares are of the volume that remains.
Limits
- HMDA reporters only. A lender below Regulation C's reporting thresholds is absent, and so is a loan Regulation C excludes, such as temporary financing like a construction or bridge loan. Loans sold to Fannie Mae or Freddie Mac count under the lender that made them.
- Filers, not groups. Affiliated filers are not combined.
- Amounts are rounded. The FFIEC's public file reports each loan amount at the midpoint of a $10,000 band, so sums are close to, not exactly, what lenders lent.
- Filed figures can be wrong. Loans large enough to be keying errors are set apart, by a rule that can miss smaller errors.
- One year. The 2025 figures are the FFIEC's snapshot, its first edition; a year of resubmissions can change them slightly.
Cite this
Free to quote, cite and republish, including the chart, with credit to Finantrix Atlas and a link to this page.
Wells Fargo Bank originated $21.6 billion of multifamily loans in 2025, more than any other lender reporting under HMDA, according to a Finantrix Atlas analysis of FFIEC HMDA data.
Suggested citation: Finantrix Atlas, "Largest Multifamily Lenders Reporting Under HMDA," data for 2025, from FFIEC HMDA data. https://www.finantrix.com/articles/largest-multifamily-lenders
Embed the chart:
<a href="https://www.finantrix.com/articles/largest-multifamily-lenders"><img src="https://www.finantrix.com/atlas/largest-multifamily-lenders.png" alt="The largest multifamily lenders reporting under HMDA, from Finantrix Atlas"></a>
<p>Chart: <a href="https://www.finantrix.com/articles/largest-multifamily-lenders">Finantrix Atlas</a>, from FFIEC HMDA data.</p>
Frequently asked questions
Q: Who is the largest multifamily lender? A: Among lenders reporting under HMDA, Wells Fargo Bank, with $21.6 billion of multifamily loans originated in 2025, according to FFIEC HMDA data.
Q: Which lender makes the most multifamily loans? A: JPMorgan Chase Bank, with 3,892 multifamily loans in 2025, according to HMDA filings, at an average of $4.6 million.
Q: How much multifamily lending is reported under HMDA? A: $269 billion across 43,226 loans in 2025, according to the FFIEC, from 2,467 lenders.
Q: Does HMDA cover all multifamily lending? A: No. It covers lenders above Regulation C's reporting thresholds, and it excludes some loans, such as temporary construction and bridge financing.
Download the data
The 25 rows on this page (CSV), free. The full dataset has all 2,467 rows, as of December 31, 2025; we email you a link.
Frequently Asked Questions
Who is the largest multifamily lender?
Among lenders reporting under HMDA, Wells Fargo Bank, with $21.6 billion of multifamily loans originated in 2025, according to FFIEC HMDA data.
Which lender makes the most multifamily loans?
JPMorgan Chase Bank, with 3,892 multifamily loans in 2025, according to HMDA filings, at an average of $4.6 million.
How much multifamily lending is reported under HMDA?
$269 billion across 43,226 loans in 2025, according to the FFIEC, from 2,467 lenders.
Does HMDA cover all multifamily lending?
No. It covers lenders above Regulation C's reporting thresholds, and it excludes some loans, such as temporary construction and bridge financing.