
Key Takeaways
- The ten largest commercial real estate lenders hold 27.6% of CRE loans at FDIC-insured US banks, against 54.7% of business loans and 91.8% of card loans for the ten largest in each, according to FDIC data.
- JPMorgan Chase Bank holds the most CRE loans, $202 billion, equal to 62% of its capital as federal bank regulators measure it, according to FDIC Call Report data for June 30, 2026.
- 389 banks hold CRE loans of 300% or more of capital, the screen in the FDIC, Federal Reserve and OCC guidance; none of the 32 banks with $100 billion or more in assets is among them.
- The agencies say the screen is not a limit on CRE lending, and this page makes no judgment about any bank's risk.
The ten largest commercial real estate lenders hold 27.6% of the CRE loans at FDIC-insured US banks, against 54.7% of commercial and industrial loans and 91.8% of credit card loans for the ten largest lenders in each, according to FDIC Call Report data for June 30, 2026. JPMorgan Chase Bank holds the most CRE loans, $202 billion, followed by Wells Fargo Bank with $133 billion and Bank of America with $91.3 billion.
Measured against capital, the order changes. According to FDIC data, 389 banks hold CRE loans of 300% or more of their capital, the level in the supervisory screen the FDIC, the Federal Reserve and the OCC set out in their guidance, and none of the 32 banks with $100 billion or more in assets is among them. JPMorgan Chase Bank's CRE loans come to 62% of its capital, by FDIC figures.
This ranking covers all 4,238 FDIC-insured commercial banks and savings institutions that filed a Call Report for June 30, 2026, including 38 that have closed since. 4,117 of them report CRE loans, $2.63 trillion between them, according to FDIC data.
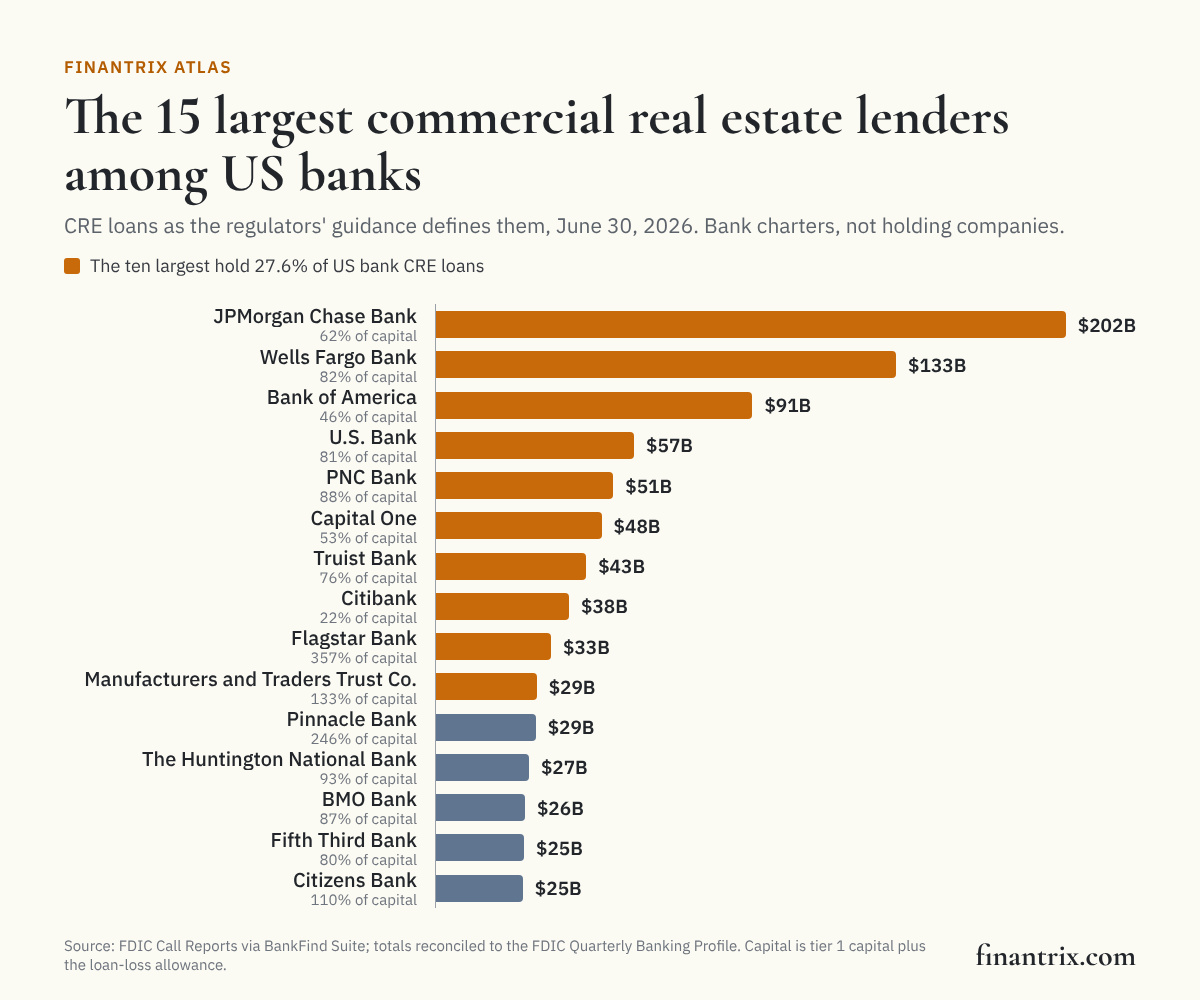 real estate lenders among US banks, June 30, 2026, from FDIC data, led by JPMorgan Chase Bank at $202 billion">
The 50 largest commercial real estate lenders among US banks
Ranked by CRE loans on June 30, 2026, as the regulators' guidance defines them: construction and land development, multifamily, and nonfarm nonresidential loans that are not owner-occupied, plus loans that finance commercial real estate without being secured by it. Loans on owner-occupied business property are shown beside each bank but not counted. Each row is one bank charter.
| Rank | Bank | Headquarters | CRE loans | Share of bank CRE loans | Owner-occupied (not counted) | CRE as share of capital | CRE change over 36 months | Source |
|---|---|---|---|---|---|---|---|---|
| 1 | JPMorgan Chase Bank | Columbus, OH | $202 billion | 7.7% | $14.4 billion | 62% | +18% | FDIC |
| 2 | Wells Fargo Bank | Sioux Falls, SD | $133 billion | 5.0% | $17.8 billion | 82% | -7% | FDIC |
| 3 | Bank of America | Charlotte, NC | $91.3 billion | 3.5% | $24.7 billion | 46% | +18% | FDIC |
| 4 | U.S. Bank | Cincinnati, OH | $57.2 billion | 2.2% | $9.0 billion | 81% | +1% | FDIC |
| 5 | PNC Bank | Wilmington, DE | $51.2 billion | 1.9% | $10.4 billion | 88% | +2% | FDIC |
| 6 | Capital One | McLean, VA | $47.8 billion | 1.8% | $1.2 billion | 53% | -5% | FDIC |
| 7 | Truist Bank | Charlotte, NC | $43.4 billion | 1.6% | $17.8 billion | 76% | -0% | FDIC |
| 8 | Citibank | Sioux Falls, SD | $38.4 billion | 1.5% | $845 million | 22% | +3% | FDIC |
| 9 | Flagstar Bank | Hicksville, NY | $33.2 billion | 1.3% | $2.5 billion | 357% | -32% | FDIC |
| 10 | Manufacturers and Traders Trust Company | Buffalo, NY | $29.1 billion | 1.1% | $10.6 billion | 133% | -26% | FDIC |
| 11 | Pinnacle Bank ◊ | Nashville, TN | $28.8 billion | 1.1% | $9.5 billion | 246% | +150% | FDIC |
| 12 | The Huntington National Bank ◊ | Columbus, OH | $26.8 billion | 1.0% | $13.3 billion | 93% | +81% | FDIC |
| 13 | BMO Bank | Chicago, IL | $25.7 billion | 1.0% | $8.1 billion | 87% | +5% | FDIC |
| 14 | Fifth Third Bank ◊ | Cincinnati, OH | $25.4 billion | 1.0% | $12.0 billion | 80% | +109% | FDIC |
| 15 | Citizens Bank | Providence, RI | $25.1 billion | 1.0% | $4.0 billion | 110% | -18% | FDIC |
| 16 | TD Bank | Wilmington, DE | $24.3 billion | 0.9% | $6.8 billion | 66% | +3% | FDIC |
| 17 | Valley National Bank | Passaic, NJ | $23.2 billion | 0.9% | $7.7 billion | 326% | -15% | FDIC |
| 18 | First-Citizens Bank & Trust Company | Raleigh, NC | $23.1 billion | 0.9% | $16.8 billion | 95% | +21% | FDIC |
| 19 | Webster Bank ‡ | Stamford, CT | $21.5 billion | 0.8% | $2.4 billion | 273% | +11% | FDIC |
| 20 | East West Bank | Pasadena, CA | $21.1 billion | 0.8% | $3.4 billion | 233% | +18% | FDIC |
| 21 | SouthState Bank ◊ | Winter Haven, FL | $20.5 billion | 0.8% | $7.8 billion | 283% | +81% | FDIC |
| 22 | Columbia Bank ◊ | Roseburg, OR | $20.2 billion | 0.8% | $6.9 billion | 303% | +37% | FDIC |
| 23 | Regions Bank | Birmingham, AL | $18.1 billion | 0.7% | $5.4 billion | 112% | +3% | FDIC |
| 24 | Bank OZK | Little Rock, AR | $17.7 billion | 0.7% | $852 million | 290% | +4% | FDIC |
| 25 | KeyBank | Cleveland, OH | $17.5 billion | 0.7% | $3.0 billion | 88% | -13% | FDIC |
| 26 | Old National Bank ◊ | Evansville, IN | $17.4 billion | 0.7% | $6.0 billion | 255% | +60% | FDIC |
| 27 | Goldman Sachs Bank USA | New York, NY | $17.1 billion | 0.6% | $118 million | 28% | +16% | FDIC |
| 28 | Western Alliance Bank | Phoenix, AZ | $16.9 billion | 0.6% | $1.5 billion | 200% | +9% | FDIC |
| 29 | CIBC Bank USA | Chicago, IL | $16.8 billion | 0.6% | $4.4 billion | 181% | +38% | FDIC |
| 30 | Santander Bank | Wilmington, DE | $16.2 billion | 0.6% | $955 million | 109% | -11% | FDIC |
| 31 | Zions Bancorporation | Salt Lake City, UT | $15.4 billion | 0.6% | $8.6 billion | 169% | +3% | FDIC |
| 32 | First Horizon Bank | Memphis, TN | $14.7 billion | 0.6% | $8.8 billion | 159% | +2% | FDIC |
| 33 | UBS Bank USA | Salt Lake City, UT | $13.6 billion | 0.5% | $125 million | 135% | +92% | FDIC |
| 34 | City National Bank | Los Angeles, CA | $12.7 billion | 0.5% | $4.4 billion | 118% | +2% | FDIC |
| 35 | United Bank | Fairfax, VA | $12.3 billion | 0.5% | $2.2 billion | 308% | +31% | FDIC |
| 36 | Atlantic Union Bank ◊ | Richmond City, VA | $12.0 billion | 0.5% | $4.3 billion | 274% | +93% | FDIC |
| 37 | Provident Bank ◊ | Jersey City, NJ | $11.9 billion | 0.5% | $2.9 billion | 429% | +77% | FDIC |
| 38 | UMB Bank ◊ | Kansas City, MO | $11.9 billion | 0.5% | $5.0 billion | 182% | +91% | FDIC |
| 39 | Banc of California ◊ | Los Angeles, CA | $11.0 billion | 0.4% | $1.5 billion | 310% | -0% | FDIC |
| 40 | Associated Bank | Green Bay, WI | $10.6 billion | 0.4% | $1.6 billion | 228% | +22% | FDIC |
| 41 | Morgan Stanley Bank | Salt Lake City, UT | $9.7 billion | 0.4% | $213 million | 23% | -4% | FDIC |
| 42 | City National Bank of Florida | Miami, FL | $9.6 billion | 0.4% | $1.7 billion | 273% | +18% | FDIC |
| 43 | WaFd Bank ◊ | Seattle, WA | $9.3 billion | 0.4% | $1.1 billion | 344% | +17% | FDIC |
| 44 | Axos Bank | San Diego, CA | $9.1 billion | 0.3% | $184 million | 318% | +6% | FDIC |
| 45 | Glacier Bank | Kalispell, MT | $9.1 billion | 0.3% | $3.9 billion | 273% | +33% | FDIC |
| 46 | Ameris Bank | Atlanta, GA | $9.0 billion | 0.3% | $1.9 billion | 261% | +15% | FDIC |
| 47 | OceanFirst Bank ◊ | Toms River, NJ | $8.8 billion | 0.3% | $1.6 billion | 381% | +61% | FDIC |
| 48 | First National Bank of Pennsylvania | Greenville, PA | $8.7 billion | 0.3% | $3.3 billion | 176% | +4% | FDIC |
| 49 | EverBank | Jacksonville, FL | $8.6 billion | 0.3% | $311 million | 190% | +33% | FDIC |
| 50 | Eastern Bank ◊ | Boston, MA | $8.6 billion | 0.3% | $1.6 billion | 255% | +81% | FDIC |
‡ Closed after June 30, 2026: Webster Bank on August 20, 2026. The FDIC records the end of the charter; the figures shown are those it reported for June 30, 2026.
◊ A quarter or more of this figure was held by a bank the FDIC records as absorbed into it in the three years to June 30, 2026: Pinnacle Bank absorbed Synovus Bank on January 2, 2026, $16.0 billion of CRE loans at the last report; The Huntington National Bank absorbed Veritex Community Bank on October 20, 2025 and Cadence Bank on February 1, 2026, $15.1 billion of CRE loans at the last report; Fifth Third Bank absorbed Comerica Bank on February 1, 2026 and Comerica Bank & Trust, National Association on February 1, 2026, $11.8 billion of CRE loans at the last report; SouthState Bank absorbed Independent Bank on January 1, 2025, $7.9 billion of CRE loans at the last report; Columbia Bank absorbed Columbia Trust Company on January 1, 2024 and Pacific Premier Bank, National Association on September 1, 2025, $7.4 billion of CRE loans at the last report; Old National Bank absorbed CapStar Bank on April 1, 2024 and Bremer Bank, National Association on May 1, 2025, $5.0 billion of CRE loans at the last report; Atlantic Union Bank absorbed American National Bank and Trust Company on April 1, 2024 and Sandy Spring Bank on April 1, 2025, $6.9 billion of CRE loans at the last report; Provident Bank absorbed Lakeland Bank on May 16, 2024, $4.7 billion of CRE loans at the last report; UMB Bank absorbed HTLF Bank on February 1, 2025, $3.4 billion of CRE loans at the last report; Banc of California absorbed Banc of California, National Association on December 1, 2023, $3.0 billion of CRE loans at the last report; WaFd Bank absorbed Luther Burbank Savings on March 1, 2024, $4.5 billion of CRE loans at the last report; OceanFirst Bank absorbed Flushing Bank on June 2, 2026, $4.4 billion of CRE loans at the last report; Eastern Bank absorbed Cambridge Trust Company on July 12, 2024 and HarborOne Bank on November 1, 2025, $3.6 billion of CRE loans at the last report, according to FDIC data. Each one's change over 36 months includes those loans.
Download this table (CSV), free. The full dataset, every insured bank that reports CRE loans with each component, its capital and its ratio, is one email away.
CRE loans relative to capital
In their 2006 guidance on concentrations in commercial real estate lending, the FDIC, the Federal Reserve and the OCC set out supervisory criteria for identifying banks that may warrant closer review of their CRE exposure. One, in the agencies' words as published by the FDIC, is CRE loans of 300% or more of capital, together with growth in the CRE portfolio of 50% or more over the prior 36 months. A separate criterion covers construction lending alone and is not computed here. The agencies wrote that the criteria are not limits on a bank's lending but high-level indicators, and that they are not a safe harbor either.
According to FDIC Call Report data for June 30, 2026:
- 389 banks, 9.2% of insured banks, hold CRE loans of 300% or more of capital, according to FDIC data.
- 107 of them also grew their CRE loans by 50% or more since June 30, 2023, by their own Call Reports filed with the FDIC. 25 of those absorbed another bank in the period, according to FDIC records, so part of their growth is the absorbed bank's loans.
- Across all insured banks, CRE loans equal 103% of capital, according to FDIC data. For the median bank that reports CRE loans, the FDIC figures give 136%.
- 9 of the 50 largest CRE lenders in the table above are at or above the screen, according to FDIC data.
The share of banks above the screen differs by size, according to FDIC data:
| Bank size (total assets) | Banks | At or above the screen | Share of banks | CRE as share of capital, all banks in the group | Source |
|---|---|---|---|---|---|
| Under $1 billion | 3,190 | 191 | 6% | 145% | FDIC |
| $1 billion to $10 billion | 890 | 178 | 20% | 219% | FDIC |
| $10 billion to $100 billion | 126 | 20 | 16% | 196% | FDIC |
| $100 billion or more | 32 | 0 | 0% | 58% | FDIC |
Among the 328 banks with $1 billion or more of CRE loans, 97 are at or above the screen, according to FDIC data. These are the 25 with the highest ratios:
| Rank | Bank | Headquarters | CRE loans | Tier 1 capital plus allowance | CRE as share of capital | CRE change over 36 months | Absorbed a bank in the period | Source |
|---|---|---|---|---|---|---|---|---|
| 1 | River City Bank | Sacramento, CA | $4.0 billion | $673 million | 598% | +45% | – | FDIC |
| 2 | Marquette Bank | Chicago, IL | $1.1 billion | $190 million | 577% | -2% | – | FDIC |
| 3 | Five Star Bank | Roseville, CA | $3.1 billion | $584 million | 538% | +45% | – | FDIC |
| 4 | Habib American Bank | New York, NY | $1.4 billion | $275 million | 526% | +52% | – | FDIC |
| 5 | Ocean Bank | Miami, FL | $4.4 billion | $839 million | 526% | +27% | – | FDIC |
| 6 | Hingham Institution for Savings | Hingham, MA | $2.8 billion | $537 million | 525% | +9% | – | FDIC |
| 7 | Kearny Bank | Kearny, NJ | $3.7 billion | $715 million | 515% | -4% | – | FDIC |
| 8 | NorthEast Community Bank | White Plains, NY | $1.8 billion | $351 million | 514% | +40% | – | FDIC |
| 9 | Lakeside Bank | Chicago, IL | $1.7 billion | $343 million | 492% | +21% | – | FDIC |
| 10 | Northeast Bank | Portland, ME | $3.2 billion | $662 million | 484% | +77% | – | FDIC |
| 11 | Bridgewater Bank | Saint Louis Park, MN | $3.2 billion | $673 million | 479% | +15% | Yes | FDIC |
| 12 | Spencer Savings Bank, SLA | Elmwood Park, NJ | $2.3 billion | $479 million | 476% | +6% | – | FDIC |
| 13 | Malaga Bank F.S.B. | Palos Verdes Pen, CA | $1.2 billion | $246 million | 473% | -3% | – | FDIC |
| 14 | Commercial Bank of California | Irvine, CA | $1.9 billion | $402 million | 473% | +81% | Yes | FDIC |
| 15 | State Bank of Texas | Irving, TX | $2.1 billion | $449 million | 461% | +19% | – | FDIC |
| 16 | Parkway Bank and Trust Company | Harwood Heights, IL | $2.0 billion | $437 million | 458% | +3% | – | FDIC |
| 17 | First Carolina Bank | Rocky Mount, NC | $1.8 billion | $399 million | 451% | +27% | – | FDIC |
| 18 | Legacy Bank & Trust Company | Mountain Grove, MO | $1.0 billion | $232 million | 449% | +26% | – | FDIC |
| 19 | Great Southern Bank | Reeds Spring, MO | $3.1 billion | $699 million | 439% | +0% | – | FDIC |
| 20 | Apple Bank | New York, NY | $6.8 billion | $1.6 billion | 437% | +5% | – | FDIC |
| 21 | United Fidelity Bank, fsb | Evansville, IN | $3.1 billion | $722 million | 436% | -10% | – | FDIC |
| 22 | ConnectOne Bank | Englewood Cliffs, NJ | $7.1 billion | $1.7 billion | 431% | +36% | Yes | FDIC |
| 23 | InterBank | Oklahoma City, OK | $2.6 billion | $614 million | 430% | +26% | – | FDIC |
| 24 | Provident Bank | Jersey City, NJ | $11.9 billion | $2.8 billion | 429% | +77% | Yes | FDIC |
| 25 | Peapack Private Bank & Trust | Bedminster, NJ | $3.3 billion | $775 million | 427% | +12% | – | FDIC |
A ratio above the screen is a fact about a bank's balance sheet, not a finding about its condition. The agencies' guidance says examiners weigh a bank's risk management, its capital and the makeup of its CRE portfolio, and this page makes no judgment about any bank.
What this means for technology buyers
CRE lending is less concentrated than card or business lending, so the systems behind it are bought by a wide range of institutions, from the largest banks to banks whose CRE loans are several times their capital. Those banks need origination and underwriting that keep pace with the book, and portfolio monitoring that can show examiners the makeup of the concentration. These guides compare the options side by side:
- Commercial loan origination systems: from application to booked loan for commercial credit, real estate included.
- Underwriting workflow automation for commercial banks: spreading, credit memos and approvals.
- Predictive analytics platforms for credit risk: models for monitoring a loan portfolio and testing it under stress.
On the borrower's side of the loan, the Real Estate Business Architecture Toolkit maps how a real estate firm runs acquisition, underwriting, financing and asset management.
More from Finantrix Atlas
- Largest banks in the US, ranked by total assets
- Largest publicly traded REITs
- Largest US mortgage lenders
- Bank failures in the US
How this list was built
The universe is every FDIC-insured commercial bank and savings institution that filed a Call Report for June 30, 2026, read from the FDIC's BankFind Suite, including banks whose charter has ended since.
CRE loans. The 2006 guidance defines CRE loans as those whose repayment depends on the rental income or the sale or refinancing of the property, and the OCC's Comptroller's Handbook lists the Call Report lines that make up the total: construction and land development, multifamily, nonfarm nonresidential loans not secured by owner-occupied property, and loans to finance commercial real estate that are not secured by real estate. These are four FDIC fields, matched by the FDIC's own field definitions: LNRECONS, LNREMULT, LNRENROT and LNCOMRE. Owner-occupied nonfarm nonresidential loans (LNRENROW), $711 billion across all banks by FDIC figures, are left out, because the guidance's definition covers loans repaid from a property's rental income or its sale or refinancing. Loans not secured by real estate add $279 billion, by FDIC figures.
Capital. Tier 1 capital (RBCT1J) plus the allowance for loan and lease losses, or for credit losses on loans and leases (LNATRES). The guidance originally divided by total risk-based capital. In a joint statement dated March 30, 2020, the agencies said that from March 31, 2020 their examiners calculate credit concentration ratios with this denominator instead, because banks that elect the community bank leverage ratio no longer report tier 2 capital.
Growth. Each bank's CRE loans on June 30, 2026 against its own Call Report for June 30, 2023, under the same FDIC certificate. A bank that absorbed another in the period shows the absorbed loans as growth. The guidance does not say how mergers are treated; this page does not adjust for them, and the concentration table marks the banks that absorbed one.
Checks. The FDIC publishes the same quarter's industry totals in its Quarterly Banking Profile, the edition for the second quarter of 2026. Its population is the one used here: 4,238 institutions. Summed across them, the banks' nonfarm nonresidential, construction and multifamily loans, tier 1 capital, loss allowance and total assets each equal the Quarterly Banking Profile's figures to the million dollars it prints. Loans not secured by real estate have no line there and are checked against BankFind's own totals. The Federal Reserve's Large Commercial Banks release publishes assets and branch counts but not loans by type, so it cannot confirm this ranking.
Limits
- Banks, not holding companies. A group that lends through several charters appears once per charter, and CRE loans held by its non-bank subsidiaries are not counted.
- Insured banks only. Credit unions and lenders that are not FDIC-insured banks are not included, so this is not the whole CRE lending market.
- Balances, not quality. The figures are loans outstanding on one day. They do not show property types within each line, locations, loan-to-value, delinquency or reserves held against these loans in particular.
- The screen is one of several criteria. The agencies' guidance also has a construction criterion and expects examiners to look beyond the numbers, so a ratio on this page is not a supervisory finding.
- One quarter. The date of the data is June 30, 2026, and the growth comparison is with June 30, 2023. A merger can move a bank up the list, or change its ratio, between filings.
Cite this
Free to quote, cite and republish, including the chart, with credit to Finantrix Atlas and a link to this page.
The ten largest commercial real estate lenders hold 27.6% of the CRE loans at FDIC-insured US banks, against 91.8% of card loans for the ten largest card lenders, according to a Finantrix Atlas analysis of June 30, 2026 FDIC Call Report data.
389 FDIC-insured banks hold CRE loans of 300% or more of tier 1 capital plus loss allowance, the regulators' supervisory screen, according to Finantrix Atlas, from FDIC data for June 30, 2026.
Suggested citation: Finantrix Atlas, "Largest US Commercial Real Estate Lenders," data as of June 30, 2026, from FDIC Call Reports and the FDIC Quarterly Banking Profile. https://www.finantrix.com/articles/largest-cre-lenders
Embed the chart:
<a href="https://www.finantrix.com/articles/largest-cre-lenders"><img src="https://www.finantrix.com/atlas/largest-cre-lenders.png" alt="The largest commercial real estate lenders among US banks, from FDIC data, by Finantrix Atlas"></a>
<p>Chart: <a href="https://www.finantrix.com/articles/largest-cre-lenders">Finantrix Atlas</a>, from FDIC Call Reports.</p>
Frequently asked questions
Q: Which US bank holds the most commercial real estate loans? A: JPMorgan Chase Bank, with $202 billion in CRE loans on June 30, 2026, as the regulators' guidance defines them, according to its Call Report filed with the FDIC.
Q: How much commercial real estate debt do US banks hold? A: $2.63 trillion in CRE loans at FDIC-insured banks on June 30, 2026, according to FDIC data, not counting $711 billion of loans on owner-occupied business property.
Q: What is the 300% CRE screen in FDIC and Federal Reserve guidance? A: In guidance from the FDIC, the Federal Reserve and the OCC, CRE loans of 300% or more of capital, with CRE growth of 50% or more over 36 months, is one criterion examiners use to identify banks for closer review of their CRE exposure. The agencies say it is not a limit.
Q: How many FDIC-insured banks are above the 300% CRE screen? A: 389 FDIC-insured banks hold CRE loans of 300% or more of capital, according to FDIC data for June 30, 2026, and 107 of them also grew CRE by 50% or more over 36 months.
Q: Which bank has the highest CRE concentration? A: Among banks with $1 billion or more of CRE loans, River City Bank, whose $4.0 billion of CRE loans equal 598% of its tier 1 capital plus loss allowance, according to FDIC data for June 30, 2026.
Download the data
The 50 rows on this page (CSV), free. The full dataset has all 4,117 rows, as of June 30, 2026; we email you a link.
Frequently Asked Questions
Which US bank holds the most commercial real estate loans?
JPMorgan Chase Bank, with $202 billion in CRE loans on June 30, 2026, as the regulators' guidance defines them, according to its Call Report filed with the FDIC.
How much commercial real estate debt do US banks hold?
$2.63 trillion in CRE loans at FDIC-insured banks on June 30, 2026, according to FDIC data, not counting $711 billion of loans on owner-occupied business property.
What is the 300% CRE screen in FDIC and Federal Reserve guidance?
In guidance from the FDIC, the Federal Reserve and the OCC, CRE loans of 300% or more of capital, with CRE growth of 50% or more over 36 months, is one criterion examiners use to identify banks for closer review of their CRE exposure. The agencies say it is not a limit.
How many FDIC-insured banks are above the 300% CRE screen?
389 FDIC-insured banks hold CRE loans of 300% or more of capital, according to FDIC data for June 30, 2026, and 107 of them also grew CRE by 50% or more over 36 months.
Which bank has the highest CRE concentration?
Among banks with $1 billion or more of CRE loans, River City Bank, whose $4.0 billion of CRE loans equal 598% of its tier 1 capital plus loss allowance, according to FDIC data for June 30, 2026.