
Key Takeaways
- Five banks hold 51.2% of the $1.52 trillion that FDIC-insured US banks lend to nondepository financial institutions from their domestic offices, according to FDIC Call Report data for June 30, 2026.
- Wells Fargo Bank holds the most, $203 billion, followed by JPMorgan Chase Bank with $201 billion, according to the FDIC.
- These loans are 10.9% of all bank loans and leases; for Wells Fargo Bank they are 20.4% of its loan book, according to FDIC data.
- The banks' loans to nondepository financial institutions add up to the FDIC's own Quarterly Banking Profile total for the quarter, to the million dollars.
Five banks hold 51.2% of the $1.52 trillion that FDIC-insured US banks lend to nondepository financial institutions from their domestic offices, according to FDIC Call Report data for June 30, 2026. Wells Fargo Bank holds the most, $203 billion, followed by JPMorgan Chase Bank with $201 billion and Bank of America with $157 billion. The order depends on the basis. Counting the consolidated figure for banks that report one, JPMorgan Chase Bank leads, with $248 billion, against $201 billion in its domestic offices, according to FDIC data.
A nondepository financial institution is a financial firm that does not take deposits. Across all insured banks, loans to them are 10.9% of loans and leases; for Wells Fargo Bank they are 20.4% of its own loan book, according to FDIC data.
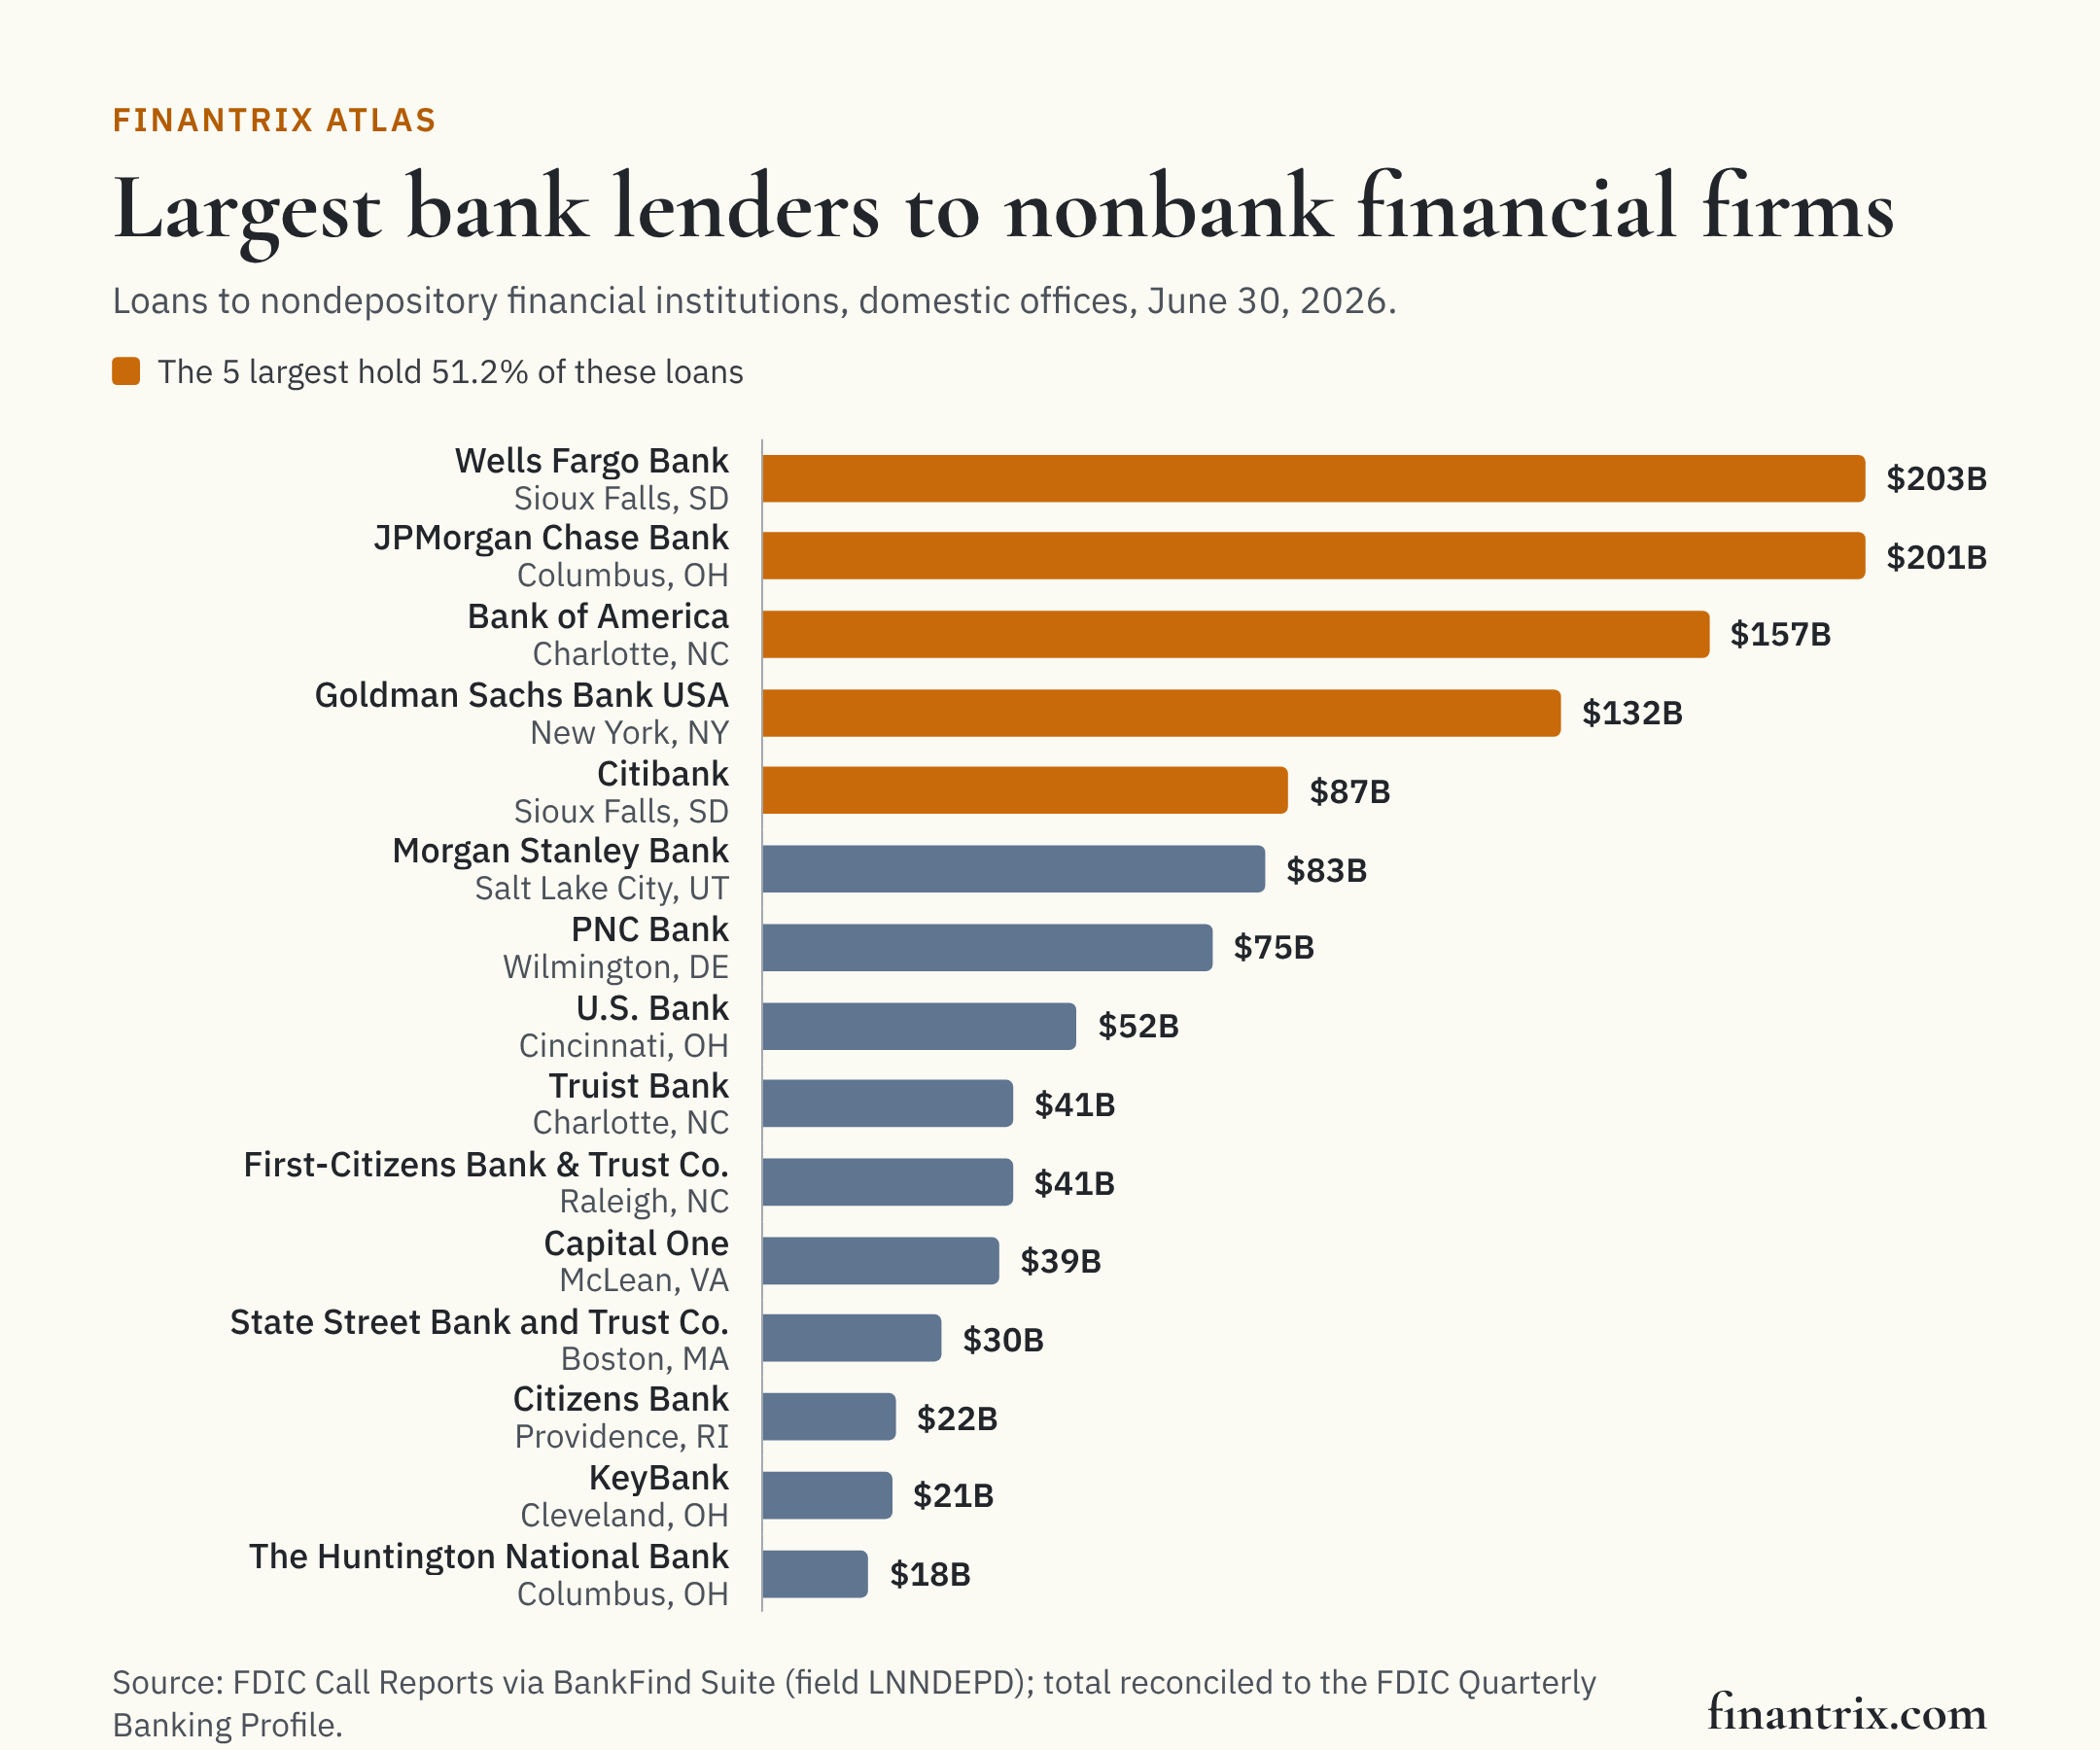
The 50 largest bank lenders to nondepository financial institutions
Ranked by loans to nondepository financial institutions held in domestic offices on June 30, 2026. Each row is one bank charter. The share of each bank's own loans and leases is shown beside it, and so is the consolidated figure, which only banks filing the FFIEC 031 version of the Call Report also report.
| Rank | Bank | Headquarters | Loans to nondepository financial institutions (domestic offices) | Share of all banks' total | Share of the bank's loans and leases | Consolidated, where reported | Total assets | Source |
|---|---|---|---|---|---|---|---|---|
| 1 | Wells Fargo Bank | Sioux Falls, SD | $203 billion | 13.3% | 20.4% | $230 billion | $1.91 trillion | FDIC |
| 2 | JPMorgan Chase Bank | Columbus, OH | $201 billion | 13.2% | 12.9% | $248 billion | $4.09 trillion | FDIC |
| 3 | Bank of America | Charlotte, NC | $157 billion | 10.3% | 13.0% | $206 billion | $2.65 trillion | FDIC |
| 4 | Goldman Sachs Bank USA | New York, NY | $132 billion | 8.7% | 53.2% | $133 billion | $759 billion | FDIC |
| 5 | Citibank | Sioux Falls, SD | $87.1 billion | 5.7% | 11.5% | $135 billion | $1.98 trillion | FDIC |
| 6 | Morgan Stanley Bank | Salt Lake City, UT | $83.3 billion | 5.5% | 72.4% | $83.3 billion | $419 billion | FDIC |
| 7 | PNC Bank | Wilmington, DE | $74.5 billion | 4.9% | 20.2% | $75.2 billion | $610 billion | FDIC |
| 8 | U.S. Bank | Cincinnati, OH | $52.1 billion | 3.4% | 12.6% | $52.1 billion | $706 billion | FDIC |
| 9 | Truist Bank | Charlotte, NC | $41.5 billion | 2.7% | 12.5% | $41.5 billion | $548 billion | FDIC |
| 10 | First-Citizens Bank & Trust Company | Raleigh, NC | $41.4 billion | 2.7% | 27.4% | $41.4 billion | $236 billion | FDIC |
| 11 | Capital One | McLean, VA | $39.2 billion | 2.6% | 8.6% | $39.2 billion | $662 billion | FDIC |
| 12 | State Street Bank and Trust Company | Boston, MA | $29.6 billion | 1.9% | 56.6% | $34.4 billion | $413 billion | FDIC |
| 13 | Citizens Bank | Providence, RI | $22.0 billion | 1.4% | 14.7% | $22.0 billion | $233 billion | FDIC |
| 14 | KeyBank | Cleveland, OH | $21.4 billion | 1.4% | 19.1% | $21.4 billion | $189 billion | FDIC |
| 15 | The Huntington National Bank | Columbus, OH | $17.5 billion | 1.1% | 9.2% | $17.5 billion | $283 billion | FDIC |
| 16 | BMO Bank | Chicago, IL | $17.2 billion | 1.1% | 12.1% | $17.2 billion | $255 billion | FDIC |
| 17 | Western Alliance Bank | Phoenix, AZ | $15.8 billion | 1.0% | 24.1% | – | $98.6 billion | FDIC |
| 18 | EverBank | Jacksonville, FL | $15.8 billion | 1.0% | 42.6% | – | $46.7 billion | FDIC |
| 19 | Manufacturers and Traders Trust Company | Buffalo, NY | $13.7 billion | 0.9% | 9.5% | $13.7 billion | $219 billion | FDIC |
| 20 | Fifth Third Bank | Cincinnati, OH | $13.2 billion | 0.9% | 7.4% | $13.2 billion | $299 billion | FDIC |
| 21 | Regions Bank | Birmingham, AL | $12.5 billion | 0.8% | 12.5% | $12.5 billion | $160 billion | FDIC |
| 22 | Axos Bank | San Diego, CA | $10.7 billion | 0.7% | 42.9% | – | $28.9 billion | FDIC |
| 23 | Texas Capital Bank | Dallas, TX | $9.5 billion | 0.6% | 38.0% | – | $33.6 billion | FDIC |
| 24 | HSBC Bank USA | Tysons, VA | $9.4 billion | 0.6% | 16.9% | $9.4 billion | $173 billion | FDIC |
| 25 | TD Bank | Wilmington, DE | $9.3 billion | 0.6% | 5.6% | $9.3 billion | $343 billion | FDIC |
| 26 | CIBC Bank USA | Chicago, IL | $9.1 billion | 0.6% | 21.1% | – | $66.5 billion | FDIC |
| 27 | First Horizon Bank | Memphis, TN | $8.9 billion | 0.6% | 13.6% | – | $84.1 billion | FDIC |
| 28 | The Bank of New York Mellon | New York, NY | $8.5 billion | 0.6% | 18.1% | $8.9 billion | $425 billion | FDIC |
| 29 | Pinnacle Bank ◊ | Nashville, TN | $8.4 billion | 0.5% | 9.4% | $8.4 billion | $129 billion | FDIC |
| 30 | Webster Bank ‡ | Stamford, CT | $8.0 billion | 0.5% | 13.9% | – | $85.9 billion | FDIC |
| 31 | Merchants Bank of Indiana | Carmel, IN | $7.8 billion | 0.5% | 45.0% | – | $21.2 billion | FDIC |
| 32 | City National Bank | Los Angeles, CA | $7.8 billion | 0.5% | 11.3% | $7.8 billion | $99.1 billion | FDIC |
| 33 | East West Bank | Pasadena, CA | $6.8 billion | 0.4% | 11.5% | $8.3 billion | $84.3 billion | FDIC |
| 34 | Customers Bank | Malvern, PA | $6.1 billion | 0.4% | 34.1% | – | $26.5 billion | FDIC |
| 35 | UBS Bank USA | Salt Lake City, UT | $5.9 billion | 0.4% | 6.3% | $5.9 billion | $124 billion | FDIC |
| 36 | Ally Bank | Sandy, UT | $5.7 billion | 0.4% | 4.0% | $5.7 billion | $188 billion | FDIC |
| 37 | Banc of California | Los Angeles, CA | $5.2 billion | 0.3% | 20.8% | – | $34.9 billion | FDIC |
| 38 | The Northern Trust Company | Chicago, IL | $4.9 billion | 0.3% | 11.3% | $6.2 billion | $179 billion | FDIC |
| 39 | Stifel Bank | Saint Louis, MO | $4.8 billion | 0.3% | 48.7% | – | $14.6 billion | FDIC |
| 40 | Northpointe Bank | Grand Rapids, MI | $3.9 billion | 0.3% | 58.1% | – | $7.5 billion | FDIC |
| 41 | Raymond James Bank | Saint Petersburg, FL | $3.8 billion | 0.3% | 10.3% | $3.9 billion | $45.6 billion | FDIC |
| 42 | Apple Bank | New York, NY | $3.8 billion | 0.3% | 27.6% | – | $19.9 billion | FDIC |
| 43 | Flagstar Bank | Hicksville, NY | $3.5 billion | 0.2% | 5.7% | $3.5 billion | $87.7 billion | FDIC |
| 44 | Morgan Stanley Private Bank | Purchase, NY | $3.3 billion | 0.2% | 1.8% | $3.3 billion | $250 billion | FDIC |
| 45 | Bank OZK | Little Rock, AR | $3.3 billion | 0.2% | 10.0% | – | $41.7 billion | FDIC |
| 46 | Associated Bank | Green Bay, WI | $3.2 billion | 0.2% | 8.6% | – | $51.8 billion | FDIC |
| 47 | UMB Bank | Kansas City, MO | $2.8 billion | 0.2% | 6.9% | $2.8 billion | $71.9 billion | FDIC |
| 48 | Zions Bancorporation | Salt Lake City, UT | $2.5 billion | 0.2% | 4.0% | – | $89.0 billion | FDIC |
| 49 | BankUnited | Miami Lakes, FL | $2.2 billion | 0.1% | 9.0% | – | $34.9 billion | FDIC |
| 50 | Centier Bank | Whiting, IN | $2.1 billion | 0.1% | 25.6% | – | $10.4 billion | FDIC |
‡ Closed after June 30, 2026: Webster Bank (Stamford, CT) on August 20, 2026. The FDIC records the end of the charter; the loans shown are those it reported for June 30, 2026.
◊ A quarter or more of this figure was held by a bank the FDIC records as absorbed into it in the three years to June 30, 2026: Pinnacle Bank absorbed Synovus Bank on January 2, 2026, according to FDIC data.
Download this table (CSV), free. The full dataset, every insured bank that reports these loans with its identifiers, is one email away.
How concentrated it is
- The largest lender holds 13.3% of the total, according to FDIC data.
- The largest ten hold 70.5%, and the 50 in the table hold 96.0%. The smallest of them holds $2.1 billion, by FDIC figures.
- 633 of the 4,238 insured banks report any.
What this means for technology buyers
Lending to a financial firm is underwritten on that firm's own balance sheet and collateral, and monitored over the life of the facility. For a bank growing this business, the systems behind commercial underwriting, credit monitoring and the client relationship carry most of the work. These guides compare the options side by side:
- Commercial loan origination systems: from application to booked loan for business credit.
- Underwriting workflow automation for commercial banks: spreading, credit memos and approvals.
- Predictive analytics platforms for credit risk: models for rating and monitoring a loan portfolio.
- CRM for commercial banking teams: pipeline and relationship management.
Planning the change before choosing the vendor? The Banking and Payments Capability Matrix states what a bank does, from taking deposits to originating credit, so a lending platform can be placed against the capabilities it supports.
More from Finantrix Atlas
- Largest US commercial and industrial lenders
- Largest private credit managers by BDC investments
- Largest private fund managers in the US
- Largest banks in the US, ranked by total assets
How this list was built
The universe is every FDIC-insured commercial bank and savings institution that filed a Call Report for June 30, 2026, read from the FDIC's BankFind Suite, including banks whose charter has ended since. Banks are ranked by the FDIC field LNNDEPD, which the FDIC's field reference describes as loans to nondepository financial institutions held in domestic offices. Every bank reports it. The consolidated figure, LNNDEPC, is reported only by banks that file the FFIEC 031 version of the Call Report, according to the same reference; 32 of the 50 banks in the table report one, and it is shown but not ranked.
The FDIC's Quarterly Banking Profile, the edition for the second quarter of 2026, prints the industry's loans to nondepository financial institutions for its population of 4,238 institutions. Summed across the same institutions, the banks' figures equal it to the million dollars, a test that a dropped or double-counted bank would fail. Uninsured filers and insured US branches of foreign banks, which the Quarterly Banking Profile leaves out, report none.
Limits
- Who the borrowers are is not shown. The FDIC's public data reports these loans as one category. It does not say what kind of nonbank firm borrowed or what the loans finance.
- Domestic offices. Loans booked in a bank's offices abroad are not in the ranking; the consolidated column shows them where a bank reports that figure.
- Banks, not holding companies. A group that lends through several charters appears once per charter, and lending by non-bank subsidiaries is not counted.
- Balances, not commitments. The figure is what borrowers owed on one day. Undrawn lines are not counted.
- One quarter. The date of the data is June 30, 2026.
Cite this
Free to quote, cite and republish, including the chart, with credit to Finantrix Atlas and a link to this page.
Five banks hold 51.2% of the loans FDIC-insured US banks make to nondepository financial institutions, according to a Finantrix Atlas analysis of June 30, 2026 FDIC Call Report data.
FDIC-insured US banks held $1.52 trillion in loans to nondepository financial institutions on June 30, 2026, 10.9% of their loans and leases, according to Finantrix Atlas, from FDIC data.
Suggested citation: Finantrix Atlas, "Largest Bank Lenders to Nonbank Financial Firms," data as of June 30, 2026, from FDIC Call Reports and the FDIC Quarterly Banking Profile. https://www.finantrix.com/articles/largest-bank-lenders-to-nonbanks
Embed the chart:
<a href="https://www.finantrix.com/articles/largest-bank-lenders-to-nonbanks"><img src="https://www.finantrix.com/atlas/largest-bank-lenders-to-nonbanks.png?v=2026-06-30" alt="The largest US bank lenders to nondepository financial institutions, from FDIC data, by Finantrix Atlas"></a>
<p>Chart: <a href="https://www.finantrix.com/articles/largest-bank-lenders-to-nonbanks">Finantrix Atlas</a>, from FDIC Call Reports.</p>
Frequently asked questions
Q: Which US bank lends the most to nonbank financial firms? A: Wells Fargo Bank, with $203 billion in loans to nondepository financial institutions in its domestic offices on June 30, 2026, according to its Call Report filed with the FDIC.
Q: How much do US banks lend to nondepository financial institutions? A: $1.52 trillion on June 30, 2026, according to FDIC data, which is 10.9% of all loans and leases at FDIC-insured banks.
Q: Why might another source name a different leader? A: This ranking uses loans held in domestic offices, which every bank reports. The order depends on the basis. Counting the consolidated figure for banks that report one, JPMorgan Chase Bank leads, with $248 billion, against $201 billion in its domestic offices, according to FDIC data.
Q: How concentrated is bank lending to nonbanks? A: Five banks hold 51.2% of it, and the ten largest hold 70.5%, according to FDIC data for June 30, 2026.
Q: Does this show how much banks lend to private credit funds? A: No. The FDIC's public data reports loans to nondepository financial institutions as one category and does not say what kind of firm borrowed.
Download the data
Two CSV files, free: the 50 rows on this page, and the full dataset of all 633 rows, as of June 30, 2026.
Frequently Asked Questions
Which US bank lends the most to nonbank financial firms?
Wells Fargo Bank, with $203 billion in loans to nondepository financial institutions in its domestic offices on June 30, 2026, according to its Call Report filed with the FDIC.
How much do US banks lend to nondepository financial institutions?
$1.52 trillion on June 30, 2026, according to FDIC data, which is 10.9% of all loans and leases at FDIC-insured banks.
Why might another source name a different leader?
This ranking uses loans held in domestic offices, which every bank reports. The order depends on the basis. Counting the consolidated figure for banks that report one, JPMorgan Chase Bank leads, with $248 billion, against $201 billion in its domestic offices, according to FDIC data.
How concentrated is bank lending to nonbanks?
Five banks hold 51.2% of it, and the ten largest hold 70.5%, according to FDIC data for June 30, 2026.
Does this show how much banks lend to private credit funds?
No. The FDIC's public data reports loans to nondepository financial institutions as one category and does not say what kind of firm borrowed.