
Key Takeaways
- FDIC-insured US banks held $5.82 trillion in securities on June 30, 2026, 22.0% of their assets, according to FDIC Call Report data.
- Bank of America holds the most, $835 billion, followed by JPMorgan Chase Bank with $808 billion; the ten largest hold 58.5% of the total.
- Across all banks, 51.9% of securities were mortgage-backed and 28.6% were US Treasuries; 35.7% were held to maturity, according to FDIC data.
- The banks' securities, Treasuries, mortgage-backed and municipal holdings add up to the FDIC's Quarterly Banking Profile, to the million dollars.
FDIC-insured US banks held $5.82 trillion in securities on June 30, 2026, 22.0% of their assets, according to FDIC Call Report data. Bank of America holds the most, $835 billion, followed by JPMorgan Chase Bank with $808 billion and Wells Fargo Bank with $442 billion. The ten largest hold 58.5% of the total.
Most of it is mortgage-backed securities and US Treasuries. Across all banks, mortgage-backed securities were 51.9% of the total, $3.02 trillion, and US Treasuries 28.6%, $1.66 trillion; securities of states and municipalities were 4.9%. Banks classed 35.7% of their debt securities as held to maturity, which are carried at amortized cost rather than at market value.
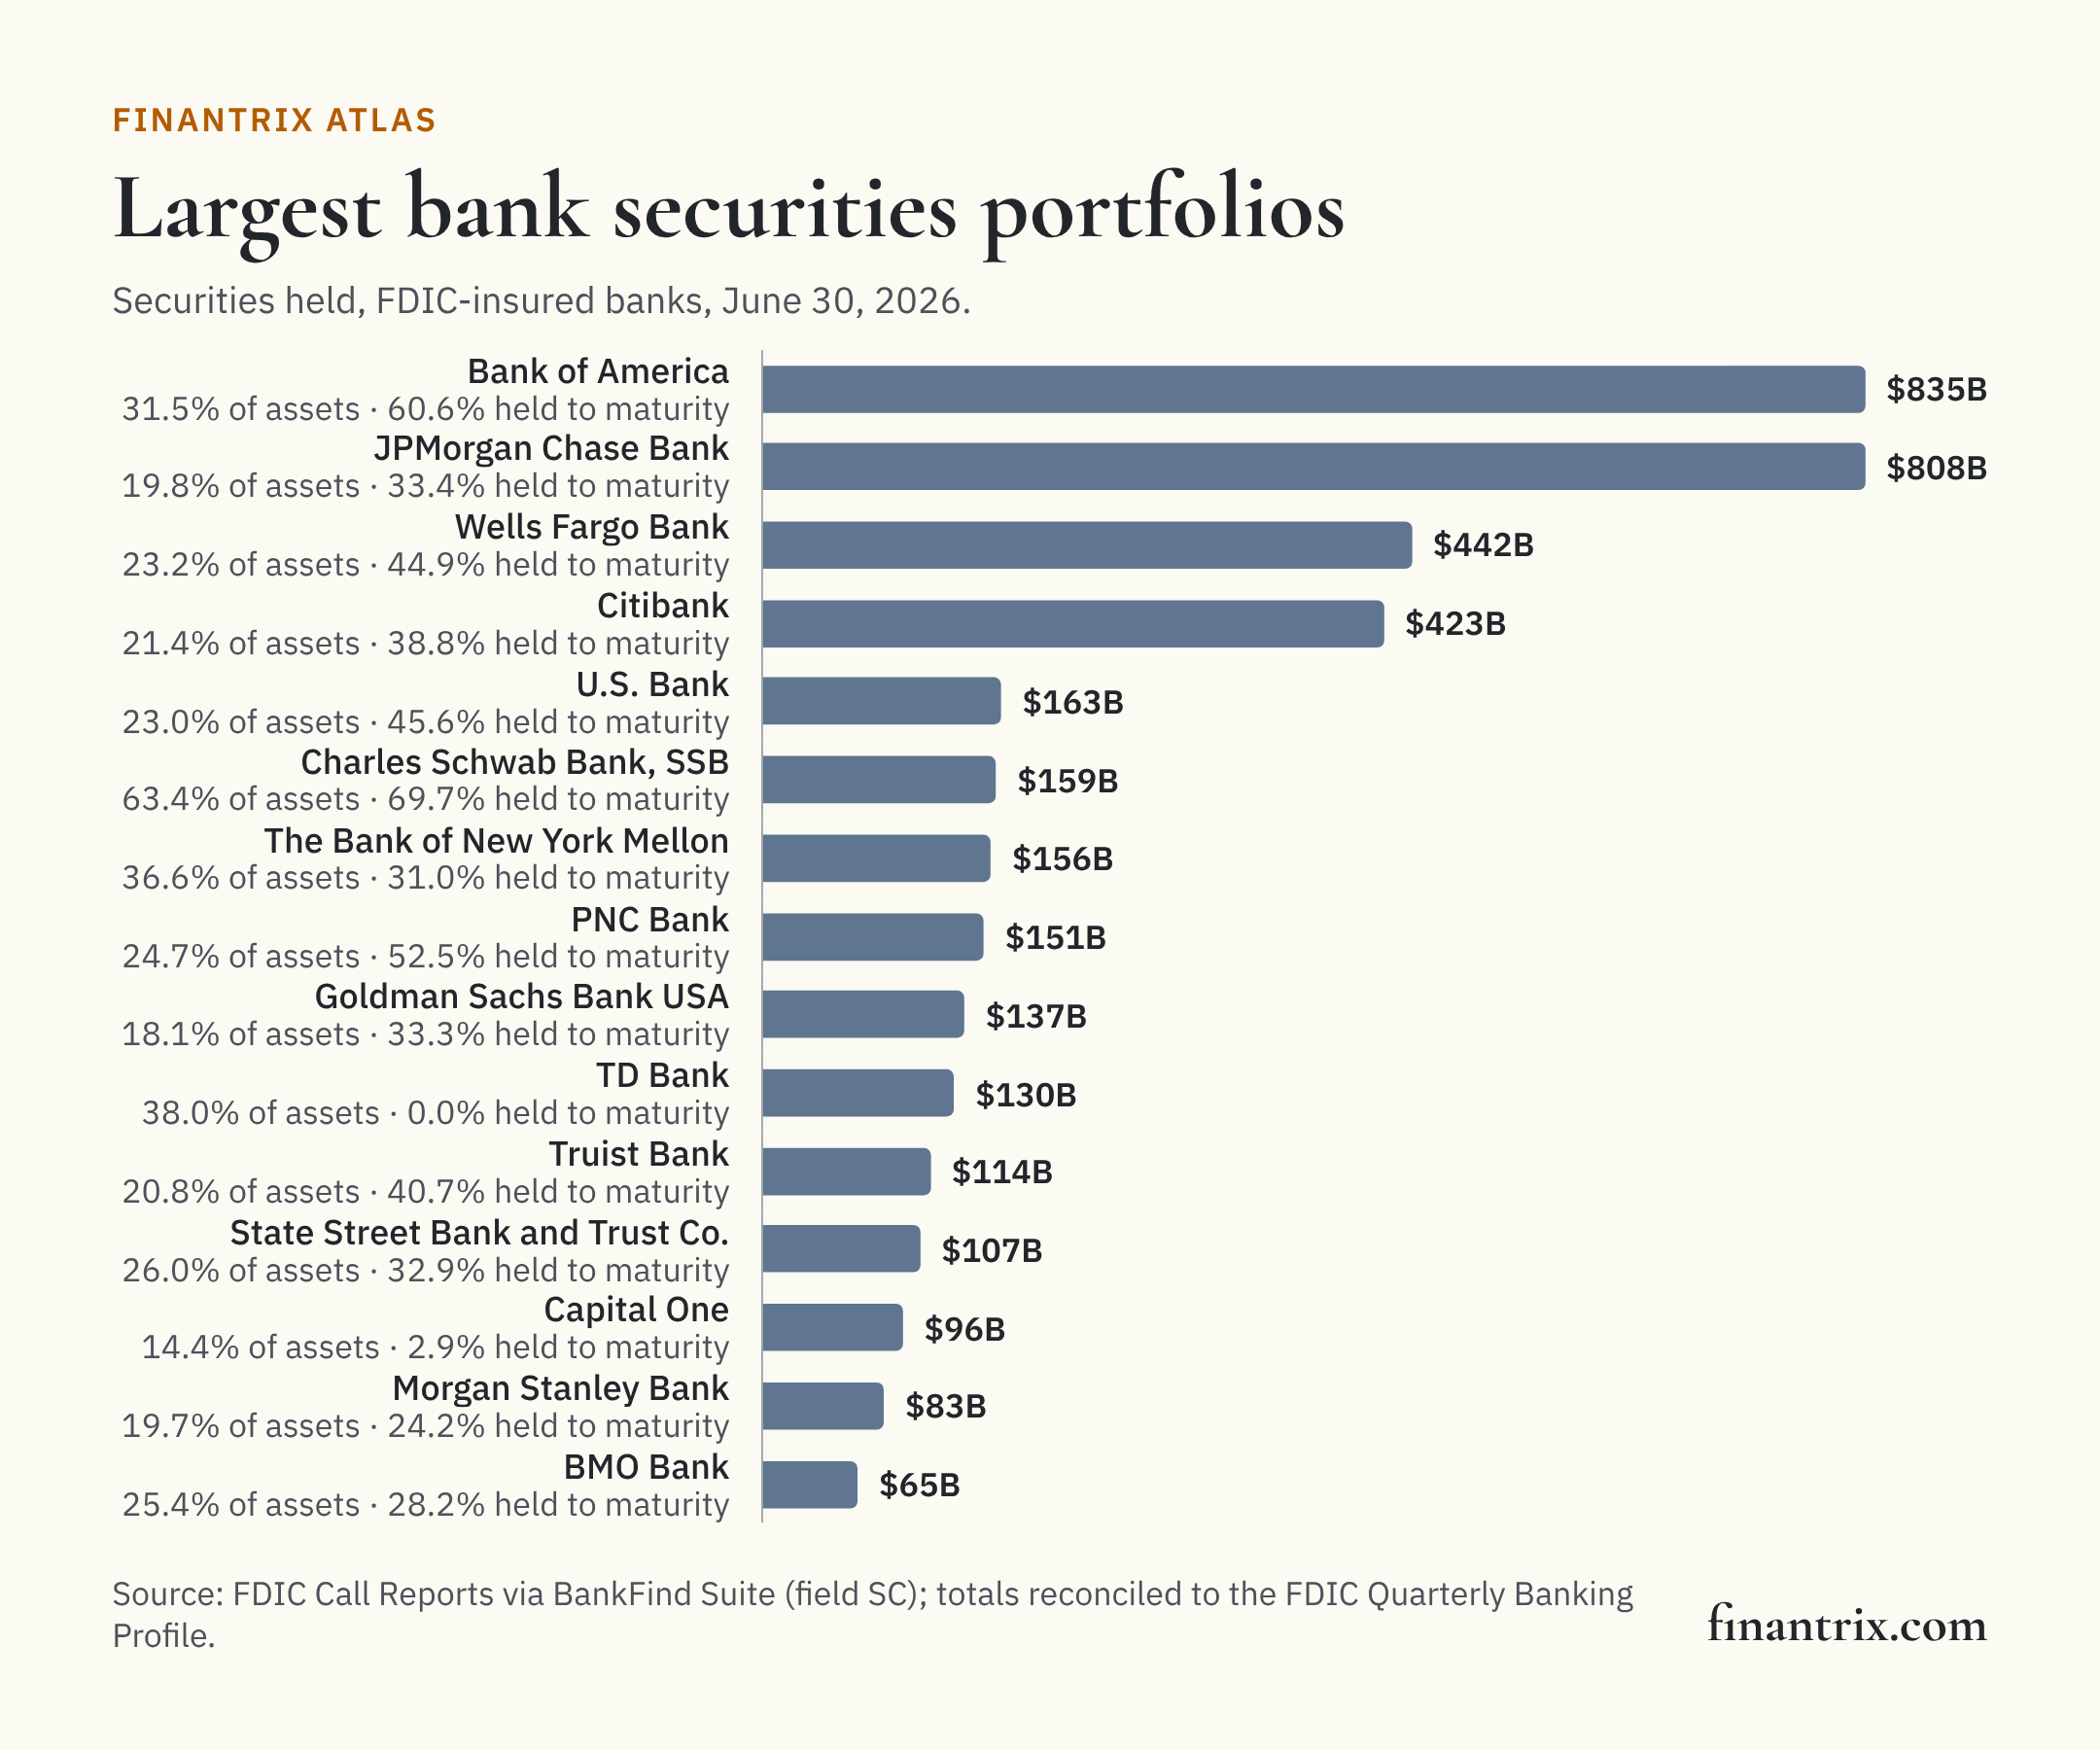
The 50 largest bank securities portfolios
Ranked by securities held on June 30, 2026. Each row is one bank charter, with the share of its assets in securities, the share it holds to maturity, and what the portfolio holds.
| Rank | Bank | Headquarters | Securities | Share of assets | Held to maturity | US Treasuries | Mortgage-backed | Municipal | All other | Source |
|---|---|---|---|---|---|---|---|---|---|---|
| 1 | Bank of America | Charlotte, NC | $835 billion | 31.5% | 60.6% | $298 billion | $474 billion | $4.0 billion | $58.7 billion | FDIC |
| 2 | JPMorgan Chase Bank | Columbus, OH | $808 billion | 19.8% | 33.4% | $483 billion | $197 billion | $26.9 billion | $102 billion | FDIC |
| 3 | Wells Fargo Bank | Sioux Falls, SD | $442 billion | 23.2% | 44.9% | $81.3 billion | $312 billion | $25.3 billion | $24.0 billion | FDIC |
| 4 | Citibank | Sioux Falls, SD | $423 billion | 21.4% | 38.8% | $128 billion | $116 billion | $9.5 billion | $170 billion | FDIC |
| 5 | U.S. Bank | Cincinnati, OH | $163 billion | 23.0% | 45.6% | $24.1 billion | $112 billion | $7.4 billion | $18.7 billion | FDIC |
| 6 | Charles Schwab Bank, SSB | Westlake, TX | $159 billion | 63.4% | 69.7% | $7.0 billion | $137 billion | $424 million | $14.7 billion | FDIC |
| 7 | The Bank of New York Mellon | New York, NY | $156 billion | 36.6% | 31.0% | $36.0 billion | $60.2 billion | $11 million | $59.3 billion | FDIC |
| 8 | PNC Bank | Wilmington, DE | $151 billion | 24.7% | 52.5% | $44.1 billion | $93.1 billion | $2.4 billion | $11.1 billion | FDIC |
| 9 | Goldman Sachs Bank USA | New York, NY | $137 billion | 18.1% | 33.3% | $111 billion | $24.4 billion | $19 million | $1.7 billion | FDIC |
| 10 | TD Bank | Wilmington, DE | $130 billion | 38.0% | 0.0% | $41.1 billion | $53.0 billion | $0 | $36.3 billion | FDIC |
| 11 | Truist Bank | Charlotte, NC | $114 billion | 20.8% | 40.7% | $13.1 billion | $98.6 billion | $341 million | $2.1 billion | FDIC |
| 12 | State Street Bank and Trust Company | Boston, MA | $107 billion | 26.0% | 32.9% | $24.3 billion | $45.7 billion | $25 million | $37.2 billion | FDIC |
| 13 | Capital One | McLean, VA | $95.5 billion | 14.4% | 2.9% | $10.2 billion | $74.2 billion | $98 million | $11.0 billion | FDIC |
| 14 | Morgan Stanley Bank | Salt Lake City, UT | $82.6 billion | 19.7% | 24.2% | $48.7 billion | $29.8 billion | $2.2 billion | $1.9 billion | FDIC |
| 15 | BMO Bank | Chicago, IL | $64.8 billion | 25.4% | 28.2% | $22.6 billion | $35.1 billion | $1.1 billion | $6.0 billion | FDIC |
| 16 | Fifth Third Bank | Cincinnati, OH | $61.6 billion | 20.6% | 29.9% | $5.3 billion | $48.9 billion | $0 | $7.4 billion | FDIC |
| 17 | The Northern Trust Company | Chicago, IL | $61.2 billion | 34.3% | 37.4% | $7.9 billion | $18.7 billion | $2.4 billion | $32.3 billion | FDIC |
| 18 | HSBC Bank USA | Tysons, VA | $53.4 billion | 30.9% | 38.4% | $21.4 billion | $26.8 billion | $2 million | $5.3 billion | FDIC |
| 19 | The Huntington National Bank | Columbus, OH | $49.6 billion | 17.5% | 29.0% | $10.9 billion | $33.0 billion | $4.7 billion | $1.1 billion | FDIC |
| 20 | USAA Federal Savings Bank | Phoenix, AZ | $48.5 billion | 45.7% | 68.5% | $6.4 billion | $40.5 billion | $0 | $1.6 billion | FDIC |
| 21 | KeyBank | Cleveland, OH | $48.0 billion | 25.4% | 19.8% | $6.6 billion | $38.0 billion | $0 | $3.4 billion | FDIC |
| 22 | Citizens Bank | Providence, RI | $45.4 billion | 19.5% | 16.9% | $4.4 billion | $37.1 billion | $866,000 | $3.8 billion | FDIC |
| 23 | First-Citizens Bank & Trust Company | Raleigh, NC | $43.4 billion | 18.4% | 21.7% | $13.7 billion | $27.6 billion | $12 million | $2.1 billion | FDIC |
| 24 | Morgan Stanley Private Bank | Purchase, NY | $39.8 billion | 15.9% | 53.7% | $13.2 billion | $25.3 billion | $0 | $1.3 billion | FDIC |
| 25 | Manufacturers and Traders Trust Company | Buffalo, NY | $37.4 billion | 17.1% | 31.9% | $3.6 billion | $30.9 billion | $2.0 billion | $896 million | FDIC |
| 26 | Regions Bank | Birmingham, AL | $33.2 billion | 20.8% | 16.1% | $2.0 billion | $25.2 billion | $1 million | $5.9 billion | FDIC |
| 27 | Banco Popular de Puerto Rico | San Juan, PR | $29.6 billion | 46.7% | 21.4% | $25.3 billion | $4.1 billion | $163 million | $0 | FDIC |
| 28 | Ally Bank | Sandy, UT | $23.0 billion | 12.2% | 18.7% | $1.8 billion | $20.7 billion | $215 million | $248 million | FDIC |
| 29 | Charles Schwab Premier Bank, SSB | Westlake, TX | $22.9 billion | 86.0% | 60.8% | $3.4 billion | $15.4 billion | $0 | $4.0 billion | FDIC |
| 30 | Frost Bank | San Antonio, TX | $21.4 billion | 39.7% | 15.8% | $2.9 billion | $10.4 billion | $7.6 billion | $515 million | FDIC |
| 31 | Pinnacle Bank | Nashville, TN | $20.6 billion | 16.0% | 11.9% | $2.9 billion | $13.2 billion | $2.2 billion | $2.4 billion | FDIC |
| 32 | Western Alliance Bank | Phoenix, AZ | $20.6 billion | 20.9% | 8.2% | $5.5 billion | $9.0 billion | $2.3 billion | $3.8 billion | FDIC |
| 33 | City National Bank | Los Angeles, CA | $20.2 billion | 20.4% | 43.3% | $13.8 billion | $3.3 billion | $236 million | $2.9 billion | FDIC |
| 34 | Ameriprise Bank, FSB | Minneapolis, MN | $20.1 billion | 78.9% | 0.0% | $0 | $18.8 billion | $0 | $1.3 billion | FDIC |
| 35 | Santander Bank | Wilmington, DE | $19.7 billion | 19.0% | 65.6% | $2.0 billion | $13.7 billion | $0 | $4.0 billion | FDIC |
| 36 | UMB Bank | Kansas City, MO | $19.2 billion | 26.7% | 29.8% | $2.2 billion | $10.6 billion | $5.6 billion | $695 million | FDIC |
| 37 | TD Bank USA | Wilmington, DE | $18.4 billion | 57.3% | 0.0% | $5.1 billion | $6.2 billion | $0 | $7.1 billion | FDIC |
| 38 | Webster Bank ‡ | Stamford, CT | $18.3 billion | 21.3% | 42.1% | $0 | $16.9 billion | $904 million | $497 million | FDIC |
| 39 | Zions Bancorporation | Salt Lake City, UT | $17.9 billion | 20.1% | 47.8% | $2.0 billion | $13.7 billion | $1.1 billion | $1.2 billion | FDIC |
| 40 | East West Bank | Pasadena, CA | $17.5 billion | 20.7% | 16.3% | $2.0 billion | $13.3 billion | $226 million | $2.0 billion | FDIC |
| 41 | Flagstar Bank | Hicksville, NY | $16.6 billion | 18.9% | 0.0% | $1.0 billion | $13.9 billion | $4 million | $1.7 billion | FDIC |
| 42 | BOKF | Tulsa, OK | $15.2 billion | 28.8% | 10.7% | $989,000 | $14.6 billion | $150 million | $490 million | FDIC |
| 43 | Old National Bank | Evansville, IN | $14.5 billion | 19.6% | 19.7% | $204 million | $10.4 billion | $1.4 billion | $2.4 billion | FDIC |
| 44 | Prosperity Bank | El Campo, TX | $12.3 billion | 28.1% | 97.2% | $0 | $12.2 billion | $118 million | $27 million | FDIC |
| 45 | Columbia Bank | Roseburg, OR | $11.3 billion | 17.2% | 0.2% | $257 million | $7.6 billion | $1.6 billion | $1.8 billion | FDIC |
| 46 | UBS Bank USA | Salt Lake City, UT | $10.2 billion | 8.2% | 61.3% | $6.0 billion | $4.2 billion | $0 | $4 million | FDIC |
| 47 | Associated Bank | Green Bay, WI | $9.9 billion | 19.1% | 35.5% | $997,000 | $7.9 billion | $1.6 billion | $386 million | FDIC |
| 48 | CIBC Bank USA | Chicago, IL | $9.8 billion | 14.8% | 19.8% | $8.5 billion | $1.3 billion | $0 | $6 million | FDIC |
| 49 | BankUnited | Miami Lakes, FL | $9.3 billion | 26.7% | 0.0% | $308 million | $7.7 billion | $70 million | $1.2 billion | FDIC |
| 50 | Charles Schwab Trust Bank | Westlake, TX | $9.2 billion | 87.6% | 63.2% | $1.6 billion | $7.2 billion | $0 | $449 million | FDIC |
‡ Closed after June 30, 2026: Webster Bank (Stamford, CT) on August 20, 2026. The FDIC records the end of the charter; the figures shown are those it reported for June 30, 2026.
Download this table (CSV), free. The full dataset, every insured bank that holds securities with how it holds them and identifiers, is one email away.
Where securities are the largest share of assets
Among the 1,048 banks with $1 billion or more in assets, the median bank held 15.4% of its assets in securities. These hold the most. Jonesboro State Bank leads at 89.0%.
| Rank | Bank | Headquarters | Securities, share of assets | Securities | Total assets |
|---|---|---|---|---|---|
| 1 | Jonesboro State Bank | Jonesboro, LA | 89.0% | $1.2 billion | $1.3 billion |
| 2 | Charles Schwab Trust Bank | Westlake, TX | 87.6% | $9.2 billion | $10.5 billion |
| 3 | Charles Schwab Premier Bank, SSB | Westlake, TX | 86.0% | $22.9 billion | $26.6 billion |
| 4 | Greene County Commercial Bank | Catskill, NY | 85.9% | $1.1 billion | $1.3 billion |
| 5 | Bank of Utica | Utica, NY | 85.1% | $1.3 billion | $1.5 billion |
| 6 | Ameriprise Bank, FSB | Minneapolis, MN | 78.9% | $20.1 billion | $25.5 billion |
| 7 | First American Trust, FSB | Santa Ana, CA | 77.3% | $7.1 billion | $9.2 billion |
| 8 | Westamerica Bank | San Rafael, CA | 77.1% | $4.4 billion | $5.8 billion |
| 9 | Union County Savings Bank | Elizabeth, NJ | 69.7% | $1.0 billion | $1.5 billion |
| 10 | Farmers and Merchants Bank | Milford, NE | 65.8% | $694 million | $1.1 billion |
| 11 | Bessemer Trust Company | Woodbridge, NJ | 65.7% | $1.6 billion | $2.4 billion |
| 12 | Charles Schwab Bank, SSB | Westlake, TX | 63.4% | $159 billion | $251 billion |
| 13 | Principal Bank | Des Moines, IA | 63.1% | $6.2 billion | $9.8 billion |
| 14 | TD Bank USA | Wilmington, DE | 57.3% | $18.4 billion | $32.1 billion |
| 15 | First Federal Bank | Lake City, FL | 56.3% | $2.5 billion | $4.5 billion |
What this means for technology buyers
A securities portfolio is a store of liquidity and a source of income, and it moves with interest rates. Managing it means valuing positions, accounting for them under two treatments, and modeling what a rate change does to both. These guides compare the options side by side:
- Fixed income attribution and analytics software: measuring risk and return on bond portfolios.
- Treasury and liquidity management solutions: cash, funding and liquidity across the balance sheet.
- Financial BI and dashboarding for bank executives: tracking the portfolio against plan.
Planning the change before choosing the vendor? The Banking and Payments Capability Matrix states what a bank does, from taking deposits to managing its balance sheet, so a platform can be placed against the capabilities it supports.
More from Finantrix Atlas
- US banks by unrealized securities losses
- US banks by loan-to-deposit ratio
- US banks by net interest margin
- Largest banks in the US, ranked by total assets
How this list was built
The universe is every FDIC-insured commercial bank and savings institution that filed a Call Report for June 30, 2026, read from the FDIC's BankFind Suite, including banks whose charter has ended since; 4,142 of the 4,238 hold securities. Banks are ranked by the FDIC field SC, total securities. The held-to-maturity share divides held-to-maturity securities at amortized cost (SCHA) by those plus available-for-sale debt securities at fair value (SCAF). Treasuries (SCUST), mortgage-backed securities (SCMTGBK) and securities of states and political subdivisions (SCMUNI) are the FDIC's fields, as its field definitions describe them; all other is what remains, including agency debt, foreign, corporate and asset-backed debt, and equity securities.
The FDIC's Quarterly Banking Profile, the edition for the second quarter of 2026, prints the industry's securities, Treasuries, mortgage-backed and municipal holdings. Summed across the same institutions, the banks' figures equal each line to the million dollars.
Limits
- Two values in one total. Available-for-sale securities are counted at market value and held-to-maturity securities at amortized cost, as the Call Report records them, so the total mixes the two, and held-to-maturity securities enter it net of their allowance for credit losses. The gap between cost and market value is on the unrealized losses page.
- Banks, not holding companies. Securities held elsewhere in a group, such as at a broker-dealer, are not counted.
- Trading assets excluded. Securities held for trading are reported separately and are not in this total.
- One quarter. The date of the data is June 30, 2026.
Cite this
Free to quote, cite and republish, including the chart, with credit to Finantrix Atlas and a link to this page.
FDIC-insured US banks held $5.82 trillion in securities on June 30, 2026, and Bank of America held the most, according to a Finantrix Atlas analysis of FDIC Call Report data.
Suggested citation: Finantrix Atlas, "Largest US Bank Securities Portfolios," data as of June 30, 2026, from FDIC Call Reports and the FDIC Quarterly Banking Profile. https://www.finantrix.com/articles/largest-bank-securities-portfolios
Embed the chart:
<a href="https://www.finantrix.com/articles/largest-bank-securities-portfolios"><img src="https://www.finantrix.com/atlas/largest-bank-securities-portfolios.png?v=2026-06-30" alt="The largest securities portfolios among US banks, from FDIC data, by Finantrix Atlas"></a>
<p>Chart: <a href="https://www.finantrix.com/articles/largest-bank-securities-portfolios">Finantrix Atlas</a>, from FDIC Call Reports.</p>
Frequently asked questions
Q: Which US bank holds the most securities? A: Bank of America, with $835 billion on June 30, 2026, according to its Call Report filed with the FDIC.
Q: How much do US banks hold in securities? A: $5.82 trillion on June 30, 2026, 22.0% of their assets, according to FDIC data.
Q: What kind of securities do banks hold? A: Mostly mortgage-backed securities and US Treasuries: mortgage-backed securities were 51.9% of bank securities on June 30, 2026 and US Treasuries 28.6%, according to FDIC data.
Download the data
Two CSV files, free: the 50 rows on this page, and the full dataset of all 4,142 rows, as of June 30, 2026.
Frequently Asked Questions
Which US bank holds the most securities?
Bank of America, with $835 billion on June 30, 2026, according to its Call Report filed with the FDIC.
How much do US banks hold in securities?
$5.82 trillion on June 30, 2026, 22.0% of their assets, according to FDIC data.
What kind of securities do banks hold?
Mostly mortgage-backed securities and US Treasuries: mortgage-backed securities were 51.9% of bank securities on June 30, 2026 and US Treasuries 28.6%, according to FDIC data.