
Key Takeaways
- In the Federal Reserve's 2026 stress test, the aggregate CET1 ratio of the 32 banks fell from 12.8% to a projected minimum of 11.2% under the severely adverse scenario, a decline of 1.6 percentage points.
- DB USA had the largest projected decline, 8.2 percentage points, and its minimum CET1 ratio was 14.4%, according to the Fed's results.
- Every bank's projected minimum CET1 ratio stayed above the 4.5% regulatory minimum; the lowest was First Citizens at 6.7%.
- Projected loan losses over the scenario were 6.9% of loans in aggregate, highest at Synchrony Financial (20.7%), according to the Fed.
In the Federal Reserve's 2026 supervisory stress test, the aggregate common equity tier 1 (CET1) capital ratio of the 32 participating banks fell from 12.8% to a projected minimum of 11.2% under the severely adverse scenario, a decline of 1.6 percentage points. In the 2025 test the aggregate decline was 1.8 percentage points. Bank by bank, DB USA had the largest projected decline, 8.2 percentage points, from 22.6% to 14.4%, according to the Federal Reserve, followed by First Citizens and BMO.
Every bank's projected minimum stayed above the 4.5% regulatory minimum for the CET1 ratio; the lowest was First Citizens at 6.7%. Charles Schwab was the one bank whose projected minimum was at or above its starting ratio. Across all the banks, projected loan losses over the scenario were $625 billion, 6.9% of loans, highest at Synchrony Financial (20.7%) and Capital One (17.1%).
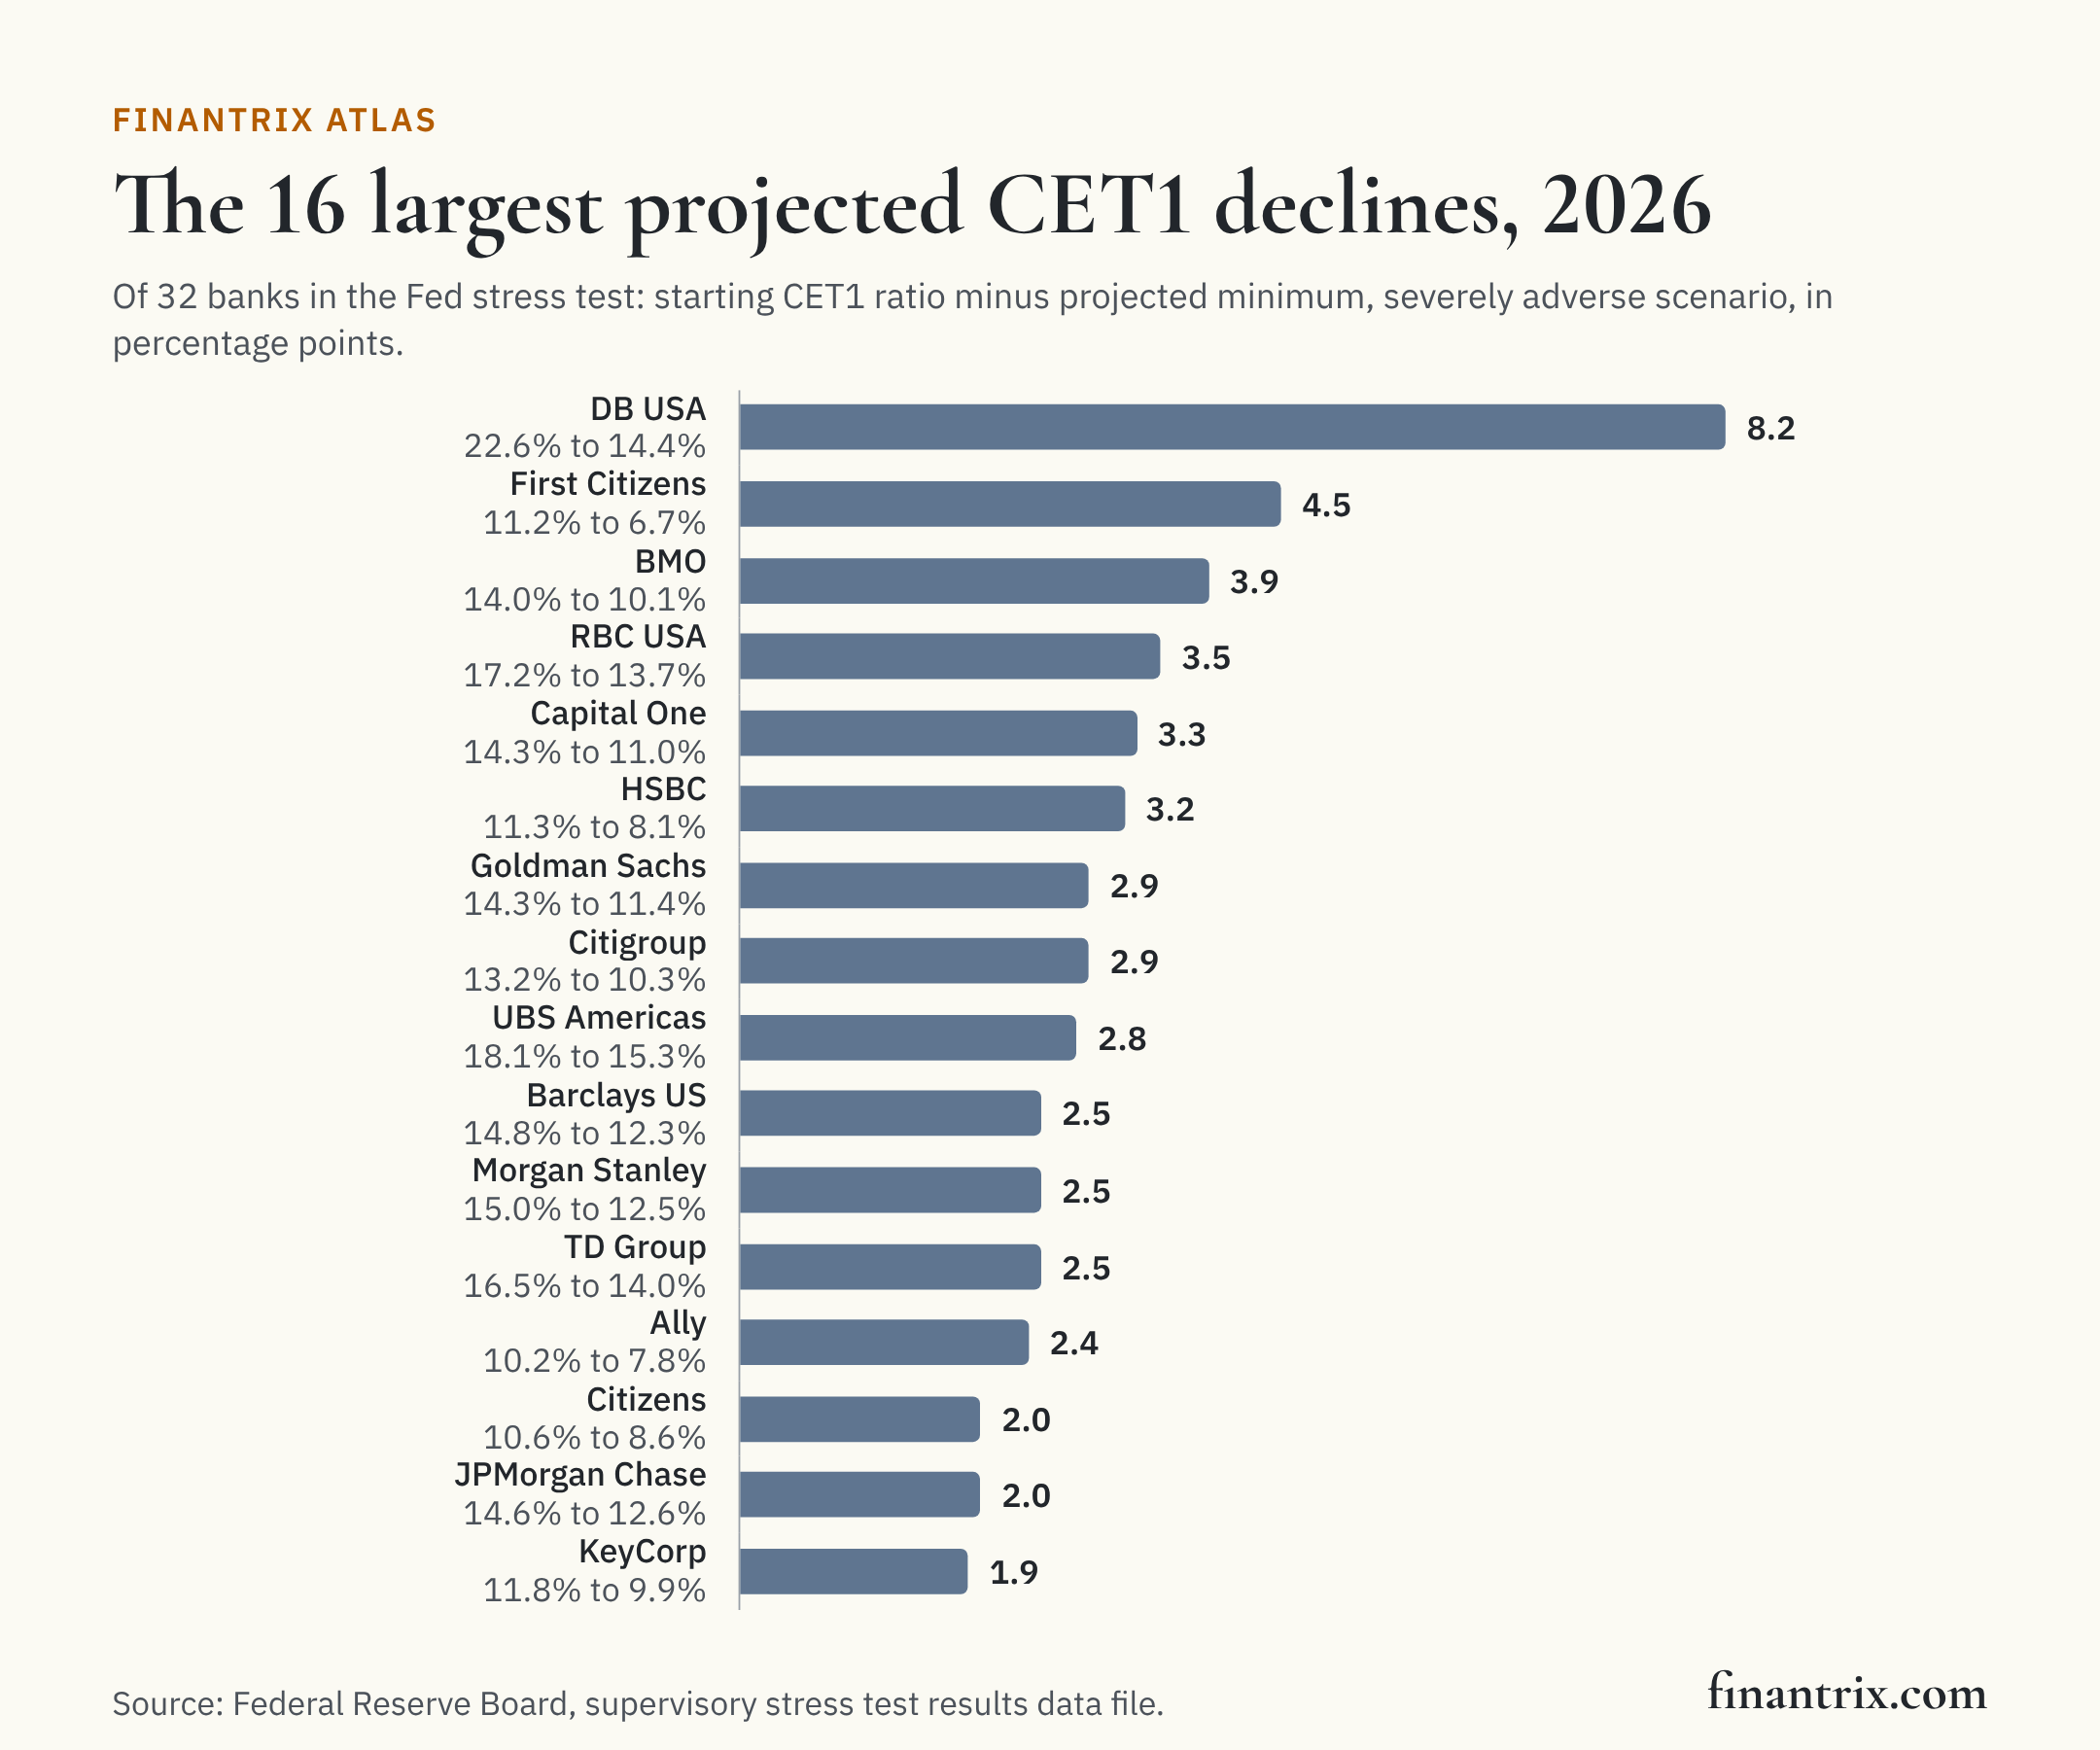
Results for all 32 banks
Ordered by the projected change in the CET1 ratio, from the actual ratio on December 31, 2025 to its lowest projected quarter under the severely adverse scenario. The category is the risk-based category the Fed assigns, which sets which capital rules apply; Category I covers the largest and most complex firms. The 2025 column says "not tested" for banks the Fed did not test that year: 10 of this year's 32 banks.
| Bank | Category | CET1 ratio, December 31, 2025 | Projected minimum CET1 ratio | Change to minimum (points) | Change in the 2025 test (points) | Projected loan losses, share of loans | Source |
|---|---|---|---|---|---|---|---|
| DB USA | III | 22.6% | 14.4% | −8.2 | −11.0 | 4.2% | Federal Reserve |
| First Citizens | IV | 11.2% | 6.7% | −4.5 | not tested | 8.6% | Federal Reserve |
| BMO | III | 14.0% | 10.1% | −3.9 | −4.3 | 7.6% | Federal Reserve |
| RBC USA | III | 17.2% | 13.7% | −3.5 | −4.6 | 6.7% | Federal Reserve |
| Capital One | III | 14.3% | 11.0% | −3.3 | −4.3 | 17.1% | Federal Reserve |
| HSBC | IV | 11.3% | 8.1% | −3.2 | not tested | 6.9% | Federal Reserve |
| Goldman Sachs | I | 14.3% | 11.4% | −2.9 | −2.7 | 7.0% | Federal Reserve |
| Citigroup | I | 13.2% | 10.3% | −2.9 | −3.2 | 7.2% | Federal Reserve |
| UBS Americas | III | 18.1% | 15.3% | −2.8 | −5.2 | 2.5% | Federal Reserve |
| Barclays US | III | 14.8% | 12.3% | −2.5 | −3.3 | 14.3% | Federal Reserve |
| Morgan Stanley | I | 15.0% | 12.5% | −2.5 | −3.0 | 3.3% | Federal Reserve |
| TD Group | III | 16.5% | 14.0% | −2.5 | −2.9 | 6.0% | Federal Reserve |
| Ally | IV | 10.2% | 7.8% | −2.4 | not tested | 7.3% | Federal Reserve |
| Citizens | IV | 10.6% | 8.6% | −2.0 | not tested | 6.0% | Federal Reserve |
| JPMorgan Chase | I | 14.6% | 12.6% | −2.0 | −1.5 | 6.7% | Federal Reserve |
| KeyCorp | IV | 11.8% | 9.9% | −1.9 | not tested | 7.3% | Federal Reserve |
| M&T | IV | 10.8% | 9.2% | −1.6 | −2.1 | 6.5% | Federal Reserve |
| Bank of America | I | 11.4% | 9.9% | −1.5 | −1.7 | 5.2% | Federal Reserve |
| Wells Fargo | I | 10.6% | 9.2% | −1.4 | −1.0 | 5.6% | Federal Reserve |
| Fifth Third | IV | 10.8% | 9.7% | −1.1 | not tested | 7.4% | Federal Reserve |
| Truist | III | 10.8% | 9.7% | −1.1 | −1.3 | 6.1% | Federal Reserve |
| Huntington | IV | 10.4% | 9.3% | −1.1 | not tested | 5.9% | Federal Reserve |
| US Bancorp | III | 10.8% | 9.8% | −1.0 | −1.8 | 6.2% | Federal Reserve |
| Santander | IV | 12.6% | 11.7% | −0.9 | not tested | 11.7% | Federal Reserve |
| American Express | III | 10.5% | 9.7% | −0.8 | −1.1 | 11.8% | Federal Reserve |
| State Street | I | 11.6% | 10.8% | −0.8 | +0.5 | 3.8% | Federal Reserve |
| Regions | IV | 10.9% | 10.3% | −0.6 | not tested | 6.7% | Federal Reserve |
| Northern Trust | II | 12.6% | 12.3% | −0.3 | +0.5 | 6.6% | Federal Reserve |
| PNC | III | 10.6% | 10.3% | −0.3 | −0.8 | 5.4% | Federal Reserve |
| Bank of New York Mellon | I | 11.9% | 11.8% | −0.1 | +0.4 | 2.0% | Federal Reserve |
| Synchrony Financial | IV | 12.6% | 12.5% | −0.1 | not tested | 20.7% | Federal Reserve |
| Charles Schwab | III | 30.4% | 32.2% | +1.8 | +1.0 | 0.7% | Federal Reserve |
Download this table (CSV), free. The full dataset, every bank's starting and stressed capital and leverage ratios, losses by loan type, revenue and pre-tax income, with RSSD IDs, is one email away.
What the stress test is, and what it is not
The severely adverse scenario is a hypothetical recession the Fed designs each year, applied to each bank's balance sheet with the Fed's own models. The Fed describes its projections as hypothetical estimates of an outcome more adverse than expected, not forecasts. A large projected decline says how much capital the Fed's models take out of that bank's business in that scenario; it is not a rating of the bank. A bank whose loans are mostly credit cards will show high projected losses in any recession scenario, and a custody bank with few loans will show low ones.
What this means for technology buyers
Each participating bank submits detailed data to the Fed for the test and runs its own projections alongside. These guides compare the systems behind that work:
- Regulatory reporting platforms for Basel compliance: capital ratios and the reports behind them.
- Model risk and AI governance platforms: inventory, validation and monitoring of the models a projection relies on.
More from Finantrix Atlas
- Largest bank holding companies
- Banks by tier 1 leverage ratio
- Banks with the largest unrealized securities losses
How this list was built
The figures are the Federal Reserve's results data file for the 2026 stress test, from the Fed's stress test page. Before publication each bank's actual, ending and minimum CET1 ratio and its loan loss rate were checked against the same bank's rows in the Fed's results document, matched through the document's own list of bank names, and the banks' loan losses were checked to sum to the aggregate. The 2025 results are matched to banks by their RSSD ID, the Fed's identifier, not by name.
Limits
- A scenario, not a forecast. The figures are what the Fed's models project under one hypothetical scenario. They are not predictions of losses or of capital.
- The banks tested. Large banks are tested every year and some smaller ones every other year, so year-to-year comparisons cover 22 banks.
- Starting point. Ratios start from December 31, 2025; each bank's capital has changed since.
- The Fed's assumptions. The projections use the capital action assumptions in the Fed's stress testing rules, not each bank's own plans.
Cite this
Free to quote, cite and republish, including the chart, with credit to Finantrix Atlas and a link to this page.
In the Federal Reserve's 2026 stress test, DB USA had the largest projected decline in its CET1 capital ratio, 8.2 percentage points, according to a Finantrix Atlas analysis of the Fed's results.
Suggested citation: Finantrix Atlas, "Fed Stress Test Results by Bank," 2026, from Federal Reserve Board supervisory stress test results. https://www.finantrix.com/articles/fed-stress-test-results
Embed the chart:
<a href="https://www.finantrix.com/articles/fed-stress-test-results"><img src="https://www.finantrix.com/atlas/fed-stress-test-results.png?v=2025-12-31" alt="Projected CET1 declines in the Fed stress test, from Finantrix Atlas"></a>
<p>Chart: <a href="https://www.finantrix.com/articles/fed-stress-test-results">Finantrix Atlas</a>, from Federal Reserve data.</p>
Frequently asked questions
Q: Did any bank fail the Fed's 2026 stress test? A: Every one of the 32 banks stayed above the 4.5% regulatory minimum CET1 ratio under the severely adverse scenario, according to the Fed's results. The lowest projected minimum was First Citizens's, 6.7%.
Q: How much did capital fall in the stress test? A: The aggregate CET1 ratio fell 1.6 percentage points, from 12.8% to a projected minimum of 11.2%. DB USA had the largest decline of any bank, 8.2 percentage points, according to the Federal Reserve.
Q: What loan losses did the stress test project? A: $625 billion across the 32 banks, 6.9% of their loans, over the scenario's nine quarters, according to the Fed.
Download the data
Two CSV files, free: the 32 rows on this page, and the full dataset of all 32 rows, as of December 31, 2025.
Frequently Asked Questions
Did any bank fail the Fed's 2026 stress test?
Every one of the 32 banks stayed above the 4.5% regulatory minimum CET1 ratio under the severely adverse scenario, according to the Fed's results. The lowest projected minimum was First Citizens's, 6.7%.
How much did capital fall in the stress test?
The aggregate CET1 ratio fell 1.6 percentage points, from 12.8% to a projected minimum of 11.2%. DB USA had the largest decline of any bank, 8.2 percentage points, according to the Federal Reserve.
What loan losses did the stress test project?
$625 billion across the 32 banks, 6.9% of their loans, over the scenario's nine quarters, according to the Fed.