
Key Takeaways
- The median FDIC-insured US bank reported a tier 1 leverage ratio of 10.96% on June 30, 2026, according to FDIC Call Report data.
- 1,798 of the 4,238 banks had elected the community bank leverage ratio framework, for which the leverage ratio is the one capital ratio reported.
- 5 banks reported a leverage ratio below the 5.0 percent that FDIC rules set as one condition of being well capitalized.
- Among the 25 largest banks by assets, ratios ranged from 5.85% to 11.29%.
The median FDIC-insured US bank reported a tier 1 leverage ratio of 10.96% on June 30, 2026, according to FDIC Call Report data. The ratio is a bank's tier 1 capital, mostly common equity, as a share of its average assets, so it does not weigh one asset as riskier than another. Among the 25 largest banks by assets it ranged from 5.85% to 11.29%, and JPMorgan Chase Bank, the largest, reported 7.49%.
1,798 of the 4,238 banks that report the ratio, 42.4%, had elected the community bank leverage ratio framework, under which the leverage ratio is the one capital ratio a bank reports. Their median was 11.76%.
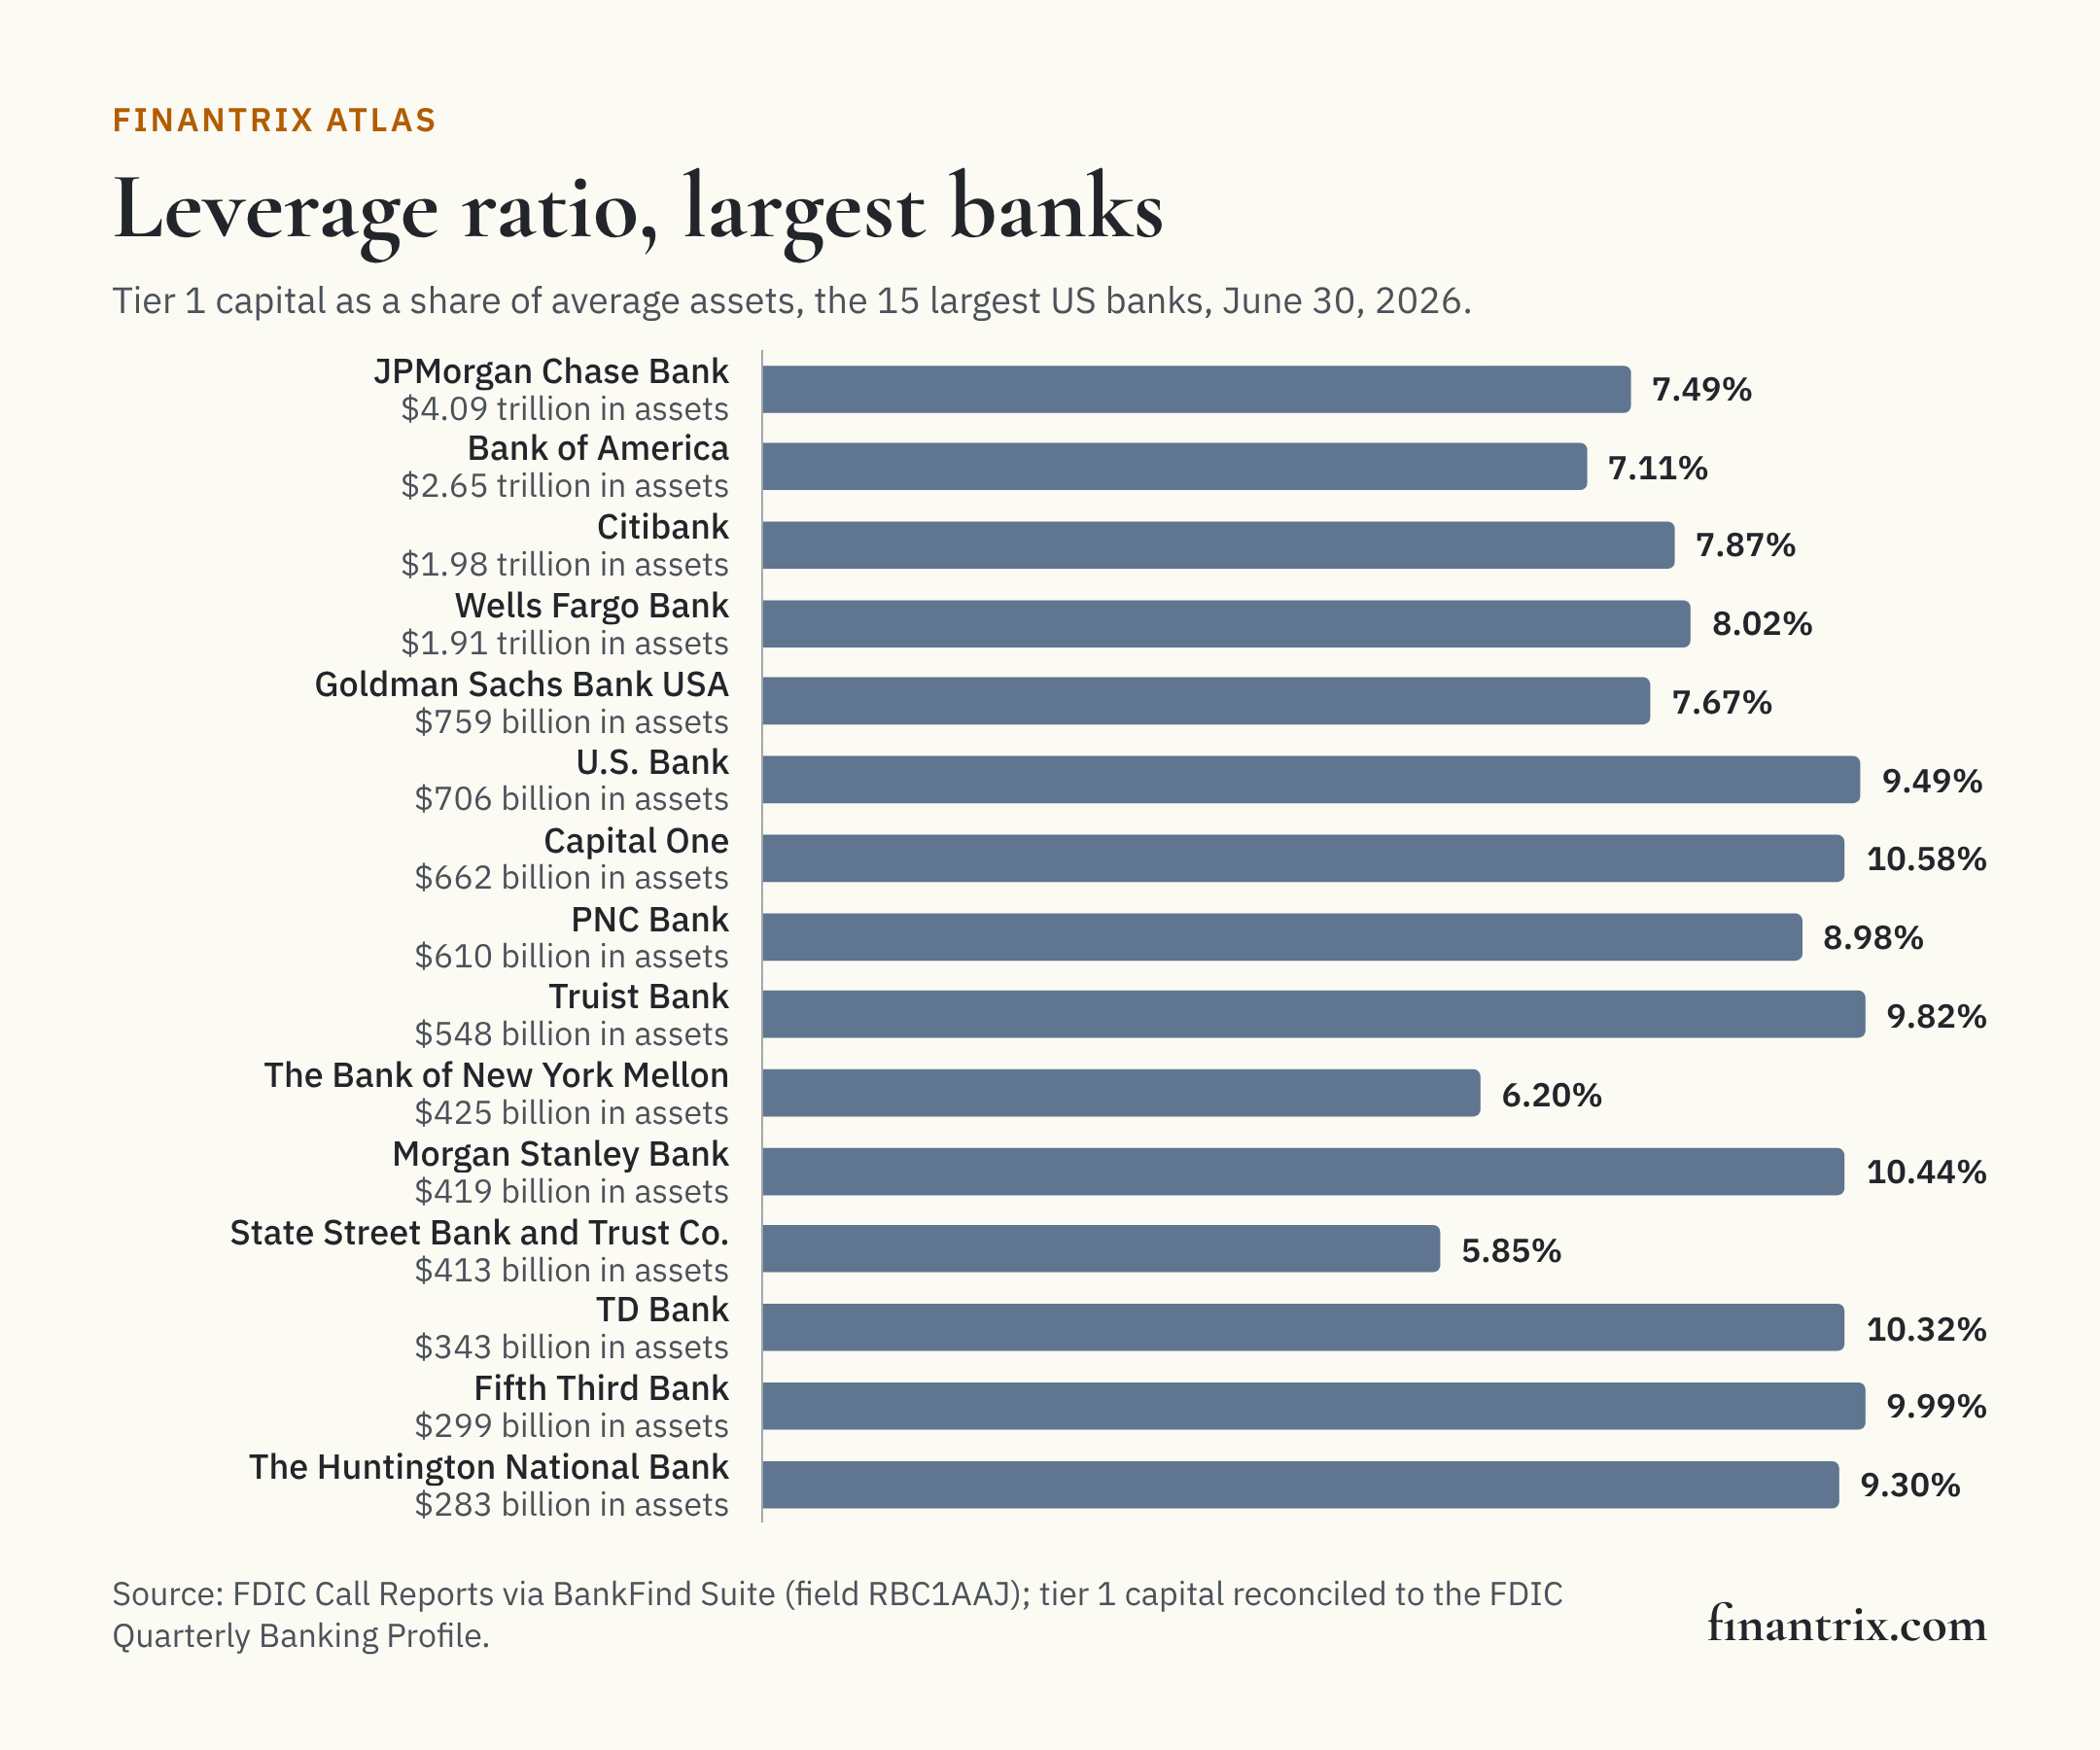
The 25 largest banks
The largest banks by total assets on June 30, 2026, with their tier 1 capital and leverage ratio. Each row is one bank charter.
| Rank by assets | Bank | Headquarters | Total assets | Tier 1 capital | Tier 1 leverage ratio | Source |
|---|---|---|---|---|---|---|
| 1 | JPMorgan Chase Bank | Columbus, OH | $4.09 trillion | $303 billion | 7.49% | FDIC |
| 2 | Bank of America | Charlotte, NC | $2.65 trillion | $187 billion | 7.11% | FDIC |
| 3 | Citibank | Sioux Falls, SD | $1.98 trillion | $155 billion | 7.87% | FDIC |
| 4 | Wells Fargo Bank | Sioux Falls, SD | $1.91 trillion | $149 billion | 8.02% | FDIC |
| 5 | Goldman Sachs Bank USA | New York, NY | $759 billion | $59.3 billion | 7.67% | FDIC |
| 6 | U.S. Bank | Cincinnati, OH | $706 billion | $63.2 billion | 9.49% | FDIC |
| 7 | Capital One | McLean, VA | $662 billion | $67.5 billion | 10.58% | FDIC |
| 8 | PNC Bank | Wilmington, DE | $610 billion | $53.5 billion | 8.98% | FDIC |
| 9 | Truist Bank | Charlotte, NC | $548 billion | $52.0 billion | 9.82% | FDIC |
| 10 | The Bank of New York Mellon | New York, NY | $425 billion | $22.5 billion | 6.20% | FDIC |
| 11 | Morgan Stanley Bank | Salt Lake City, UT | $419 billion | $41.1 billion | 10.44% | FDIC |
| 12 | State Street Bank and Trust Company | Boston, MA | $413 billion | $20.6 billion | 5.85% | FDIC |
| 13 | TD Bank | Wilmington, DE | $343 billion | $34.2 billion | 10.32% | FDIC |
| 14 | Fifth Third Bank | Cincinnati, OH | $299 billion | $28.7 billion | 9.99% | FDIC |
| 15 | The Huntington National Bank | Columbus, OH | $283 billion | $25.6 billion | 9.30% | FDIC |
| 16 | BMO Bank | Chicago, IL | $255 billion | $27.5 billion | 11.29% | FDIC |
| 17 | Charles Schwab Bank, SSB | Westlake, TX | $251 billion | $27.1 billion | 10.65% | FDIC |
| 18 | Morgan Stanley Private Bank | Purchase, NY | $250 billion | $16.6 billion | 6.65% | FDIC |
| 19 | First-Citizens Bank & Trust Company | Raleigh, NC | $236 billion | $22.9 billion | 9.75% | FDIC |
| 20 | Citizens Bank | Providence, RI | $233 billion | $20.9 billion | 9.39% | FDIC |
| 21 | Manufacturers and Traders Trust Company | Buffalo, NY | $219 billion | $19.8 billion | 9.51% | FDIC |
| 22 | American Express National Bank | Sandy, UT | $214 billion | $19.2 billion | 8.84% | FDIC |
| 23 | KeyBank | Cleveland, OH | $189 billion | $18.4 billion | 9.92% | FDIC |
| 24 | Ally Bank | Sandy, UT | $188 billion | $18.0 billion | 9.60% | FDIC |
| 25 | The Northern Trust Company | Chicago, IL | $179 billion | $11.1 billion | 6.84% | FDIC |
Download this table (CSV), free. The full dataset, every insured bank that reports the ratio with its tier 1 capital, assets, framework election and identifiers, is one email away.
The highest ratios among banks of $1 billion or more
Ranked by tier 1 leverage ratio among the 1,048 banks with $1 billion or more in assets, whose median was 10.42%. Square Financial Services, Inc. reports the highest, 65.19%, followed by The Bank of New York Mellon Trust Company at 63.50%. The ratio needed to make this list is 15.87% or higher.
| Rank | Bank | Headquarters | Tier 1 leverage ratio | Tier 1 capital | Total assets | Community bank leverage ratio election | Source |
|---|---|---|---|---|---|---|---|
| 1 | Square Financial Services, Inc. | Salt Lake City, UT | 65.19% | $1.4 billion | $2.1 billion | No | FDIC |
| 2 | The Bank of New York Mellon Trust Company | Los Angeles, CA | 63.50% | $454 million | $1.4 billion | No | FDIC |
| 3 | Erebor Bank | Columbus, OH | 38.81% | $587 million | $4.7 billion | Yes | FDIC |
| 4 | Maspeth Federal Savings and Loan Association | Maspeth, NY | 34.89% | $778 million | $2.2 billion | Yes | FDIC |
| 5 | Monet Bank | Plano, TX | 31.69% | $999 million | $3.2 billion | No | FDIC |
| 6 | Wells Fargo Bank South Central | Houston, TX | 29.69% | $780 million | $2.6 billion | No | FDIC |
| 7 | Credit One Bank | Las Vegas, NV | 28.17% | $650 million | $2.4 billion | Yes | FDIC |
| 8 | Yakima Federal Savings and Loan Association | Yakima, WA | 28.14% | $565 million | $2.0 billion | Yes | FDIC |
| 9 | Bank of Utica | Utica, NY | 26.49% | $392 million | $1.5 billion | Yes | FDIC |
| 10 | First General Bank | Rowland Heights, CA | 26.29% | $304 million | $1.2 billion | Yes | FDIC |
| 11 | Deutsche Bank Trust Company Americas | New York, NY | 25.79% | $9.9 billion | $40.5 billion | No | FDIC |
| 12 | Farmers Bank & Trust | Great Bend, KS | 23.97% | $250 million | $1.1 billion | No | FDIC |
| 13 | Beal Bank USA | Las Vegas, NV | 21.89% | $2.6 billion | $11.0 billion | No | FDIC |
| 14 | First National Bank | Fort Pierre, SD | 21.88% | $437 million | $2.0 billion | No | FDIC |
| 15 | EverTrust Bank | City Of Industry, CA | 21.71% | $228 million | $1.1 billion | Yes | FDIC |
| 16 | MutualOne Bank | Framingham, MA | 21.08% | $262 million | $1.2 billion | Yes | FDIC |
| 17 | Cape Ann Savings Bank | Gloucester, MA | 20.48% | $217 million | $1.1 billion | No | FDIC |
| 18 | FIDELITY BANK | New Orleans, LA | 20.32% | $256 million | $1.2 billion | No | FDIC |
| 19 | Emigrant Bank | Miami, FL | 20.30% | $1.1 billion | $5.7 billion | No | FDIC |
| 20 | National Exchange Bank and Trust | Fond Du Lac, WI | 20.06% | $592 million | $2.9 billion | Yes | FDIC |
| 21 | Bank of Stockton | Stockton, CA | 19.95% | $965 million | $5.0 billion | No | FDIC |
| 22 | John Deere Financial, f.s.b. | Middleton, WI | 19.36% | $886 million | $4.9 billion | Yes | FDIC |
| 23 | First Savings Bank | Beresford, SD | 19.25% | $309 million | $1.6 billion | No | FDIC |
| 24 | American Momentum Bank | College Station, TX | 19.24% | $522 million | $2.8 billion | No | FDIC |
| 25 | Wells Fargo National Bank West | Las Vegas, NV | 19.19% | $1.7 billion | $8.8 billion | No | FDIC |
| 26 | The Torrington Savings Bank | Torrington, CT | 19.03% | $190 million | $1.0 billion | Yes | FDIC |
| 27 | International Bank of Commerce | Laredo, TX | 19.02% | $1.9 billion | $10.2 billion | No | FDIC |
| 28 | Rosedale Bank | Nottingham, MD | 18.61% | $252 million | $1.4 billion | Yes | FDIC |
| 29 | Piedmont Federal Savings Bank | Winston Salem, NC | 18.60% | $247 million | $1.3 billion | Yes | FDIC |
| 30 | Celtic Bank | Salt Lake City, UT | 18.04% | $924 million | $5.3 billion | Yes | FDIC |
| 31 | Savings Bank of Mendocino County | Ukiah, CA | 17.93% | $239 million | $1.3 billion | Yes | FDIC |
| 32 | WebBank | Salt Lake City, UT | 17.39% | $474 million | $2.9 billion | No | FDIC |
| 33 | NorthEast Community Bank | White Plains, NY | 17.32% | $346 million | $2.1 billion | No | FDIC |
| 34 | Industrial and Commercial Bank of China USA | New York, NY | 17.26% | $499 million | $2.9 billion | No | FDIC |
| 35 | Home Federal Bank of Tennessee | Knoxville, TN | 17.16% | $466 million | $2.7 billion | Yes | FDIC |
| 36 | nbkc bank | Leawood, KS | 17.13% | $213 million | $1.2 billion | No | FDIC |
| 37 | Cedar Rapids Bank and Trust Company | Cedar Rapids, IA | 16.94% | $486 million | $2.9 billion | No | FDIC |
| 38 | Medallion Bank | Salt Lake City, UT | 16.92% | $454 million | $2.8 billion | No | FDIC |
| 39 | Bank of New England | Salem, NH | 16.78% | $302 million | $1.8 billion | Yes | FDIC |
| 40 | Malaga Bank F.S.B. | Palos Verdes Pen, CA | 16.76% | $242 million | $1.4 billion | No | FDIC |
| 41 | Chelsea Groton Bank | Groton, CT | 16.73% | $295 million | $1.8 billion | No | FDIC |
| 42 | Merrick Bank | South Jordan, UT | 16.59% | $1.5 billion | $9.1 billion | No | FDIC |
| 43 | Northwest Bank | Boise, ID | 16.57% | $235 million | $1.5 billion | Yes | FDIC |
| 44 | Great Midwest Bank, S.S.B. | Brookfield, WI | 16.50% | $174 million | $1.1 billion | Yes | FDIC |
| 45 | 1st Financial Bank USA | Dakota Dunes, SD | 16.34% | $229 million | $1.4 billion | No | FDIC |
| 46 | Think Mutual Bank | Rochester, MN | 16.25% | $371 million | $2.2 billion | Yes | FDIC |
| 47 | United Texas Bank | Dallas, TX | 16.02% | $167 million | $1.1 billion | Yes | FDIC |
| 48 | Nelnet Bank | Draper, UT | 15.94% | $461 million | $3.0 billion | Yes | FDIC |
| 49 | Parke Bank | Sewell, NJ | 15.88% | $358 million | $2.3 billion | Yes | FDIC |
| 50 | The Moody National Bank | Galveston, TX | 15.87% | $247 million | $1.5 billion | Yes | FDIC |
Two thresholds in the rules
FDIC rules use the leverage ratio in two places, and the counts below are of ratios, not of the categories the rules define:
- Well capitalized. A leverage ratio of 5.0 percent or greater is one of several conditions an institution must meet to be well capitalized; the others are risk-based ratios and the absence of certain supervisory orders. 5 banks reported a leverage ratio below 5.0 percent.
- Community bank leverage ratio. An institution with under $10 billion in assets and a leverage ratio greater than 8 percent, among other criteria, may elect the framework and is then considered to meet the well-capitalized ratio requirements. 4,126 banks reported a ratio above 8 percent.
What this means for technology buyers
Capital is measured and reported quarter by quarter, and the systems that do it reach across the bank: the ledger, the data behind each asset, and the reports filed with regulators. These guides compare the options side by side:
- Regulatory reporting platforms for Basel compliance: computing and reporting capital ratios.
- Ledger systems for financial services: the books capital is computed from.
- Financial BI and dashboarding for bank executives: tracking capital against growth plans.
Planning the change before choosing the vendor? The Banking and Payments Capability Matrix states what a bank does, from taking deposits to reporting to regulators, so a platform can be placed against the capabilities it supports.
More from Finantrix Atlas
- Banks' unrealized securities losses against capital
- Banks' CRE concentration against capital
- Most profitable US banks by return on assets
- Largest banks in the US, ranked by total assets
How this list was built
The universe is every FDIC-insured commercial bank and savings institution that filed a Call Report for June 30, 2026, read from the FDIC's BankFind Suite, including banks whose charter has ended since; 4,238 of the 4,238 report a leverage ratio. The ratio is the FDIC field RBC1AAJ, which the FDIC's field definitions describe as tier 1 (core) capital as a percent of average total assets minus ineligible intangibles. Nothing on this page recomputes it. The framework election is the FDIC field CBLRIND.
The FDIC's Quarterly Banking Profile, the edition for the second quarter of 2026, prints the industry's tier 1 leverage capital and total assets. Summed across the same institutions, the banks' figures equal both to the million dollars.
The two thresholds are quoted from the current text of the FDIC's capital rules, 12 CFR part 324, sections 324.403 and 324.12, in the Electronic Code of Federal Regulations. Banks supervised by the OCC and the Federal Reserve are subject to their own agencies' versions of these rules.
Limits
- One ratio of several. Banks other than community bank leverage ratio electors also report risk-based ratios, which weigh assets by risk. A bank's leverage ratio says nothing on its own about its capital category.
- Not a measure of safety. The ratio does not show credit quality, liquidity or unrealized losses that capital rules do not count.
- Average assets. The denominator is average assets less certain deductions, and a few small institutions, mostly trust companies whose assets are nearly all capital, report more tier 1 capital than average assets. None is large enough to be listed here.
- Banks, not holding companies. Capital held at a holding company is not in a bank's Call Report.
- One quarter. The date of the data is June 30, 2026.
Cite this
Free to quote, cite and republish, including the chart, with credit to Finantrix Atlas and a link to this page.
The median FDIC-insured US bank reported a tier 1 leverage ratio of 10.96% on June 30, 2026, according to a Finantrix Atlas analysis of FDIC Call Report data.
Suggested citation: Finantrix Atlas, "US Banks by Tier 1 Leverage Ratio," data as of June 30, 2026, from FDIC Call Reports and the FDIC Quarterly Banking Profile. https://www.finantrix.com/articles/banks-tier-1-leverage-ratio
Embed the chart:
<a href="https://www.finantrix.com/articles/banks-tier-1-leverage-ratio"><img src="https://www.finantrix.com/atlas/banks-tier-1-leverage-ratio.png?v=2026-06-30" alt="The tier 1 leverage ratio of the largest US banks, from FDIC data, by Finantrix Atlas"></a>
<p>Chart: <a href="https://www.finantrix.com/articles/banks-tier-1-leverage-ratio">Finantrix Atlas</a>, from FDIC Call Reports.</p>
Frequently asked questions
Q: What is a typical bank tier 1 leverage ratio? A: The median FDIC-insured bank reported 10.96% on June 30, 2026, according to FDIC data. Among banks with $1 billion or more in assets the median was 10.42%.
Q: What leverage ratio does a bank need to be well capitalized? A: FDIC rules require a leverage ratio of 5.0 percent or greater, along with risk-based capital ratios and other conditions, under 12 CFR 324.403.
Q: What is the community bank leverage ratio? A: An optional framework for institutions with under $10 billion in assets and a leverage ratio greater than 8 percent, among other criteria, under 12 CFR 324.12. 1,798 banks had elected it on June 30, 2026, according to FDIC data.
Download the data
Two CSV files, free: the 50 rows on this page, and the full dataset of all 4,238 rows, as of June 30, 2026.
Frequently Asked Questions
What is a typical bank tier 1 leverage ratio?
The median FDIC-insured bank reported 10.96% on June 30, 2026, according to FDIC data. Among banks with $1 billion or more in assets the median was 10.42%.
What leverage ratio does a bank need to be well capitalized?
FDIC rules require a leverage ratio of 5.0 percent or greater, along with risk-based capital ratios and other conditions, under 12 CFR 324.403.
What is the community bank leverage ratio?
An optional framework for institutions with under $10 billion in assets and a leverage ratio greater than 8 percent, among other criteria, under 12 CFR 324.12. 1,798 banks had elected it on June 30, 2026, according to FDIC data.