
Key Takeaways
- JPMorgan Chase & Co spent $31.6 billion buying back its own stock in 2025, more than any other US-listed bank or insurer, according to SEC filings.
- The 257 listed banks and insurers that report buybacks spent $172 billion between them; the four largest spenders, all banks, account for 49%.
- Banks spent $130 billion and insurers $41.5 billion, according to the financial data they file with the SEC.
- Among companies reporting both years, buybacks were up 53% from 2024.
JPMorgan Chase & Co spent $31.6 billion buying back its own stock in 2025, more than any other US-listed bank or insurer, according to the financial data companies file with the SEC, followed by Bank of America Corporation and Wells Fargo & Company. The 257 listed banks and insurers that report buybacks spent $172 billion between them, and the four largest spenders, JPMorgan Chase & Co, Bank of America Corporation, Wells Fargo & Company and Citigroup, account for 49% of it.
A buyback returns capital to shareholders as a dividend does, and for a bank the room for one depends on the capital it is required to hold. Banks spent $130 billion in 2025 and insurers $41.5 billion; American International Group spent the most among insurers, $5.8 billion. Among the 215 companies reporting both years, buybacks were up 53% from 2024.
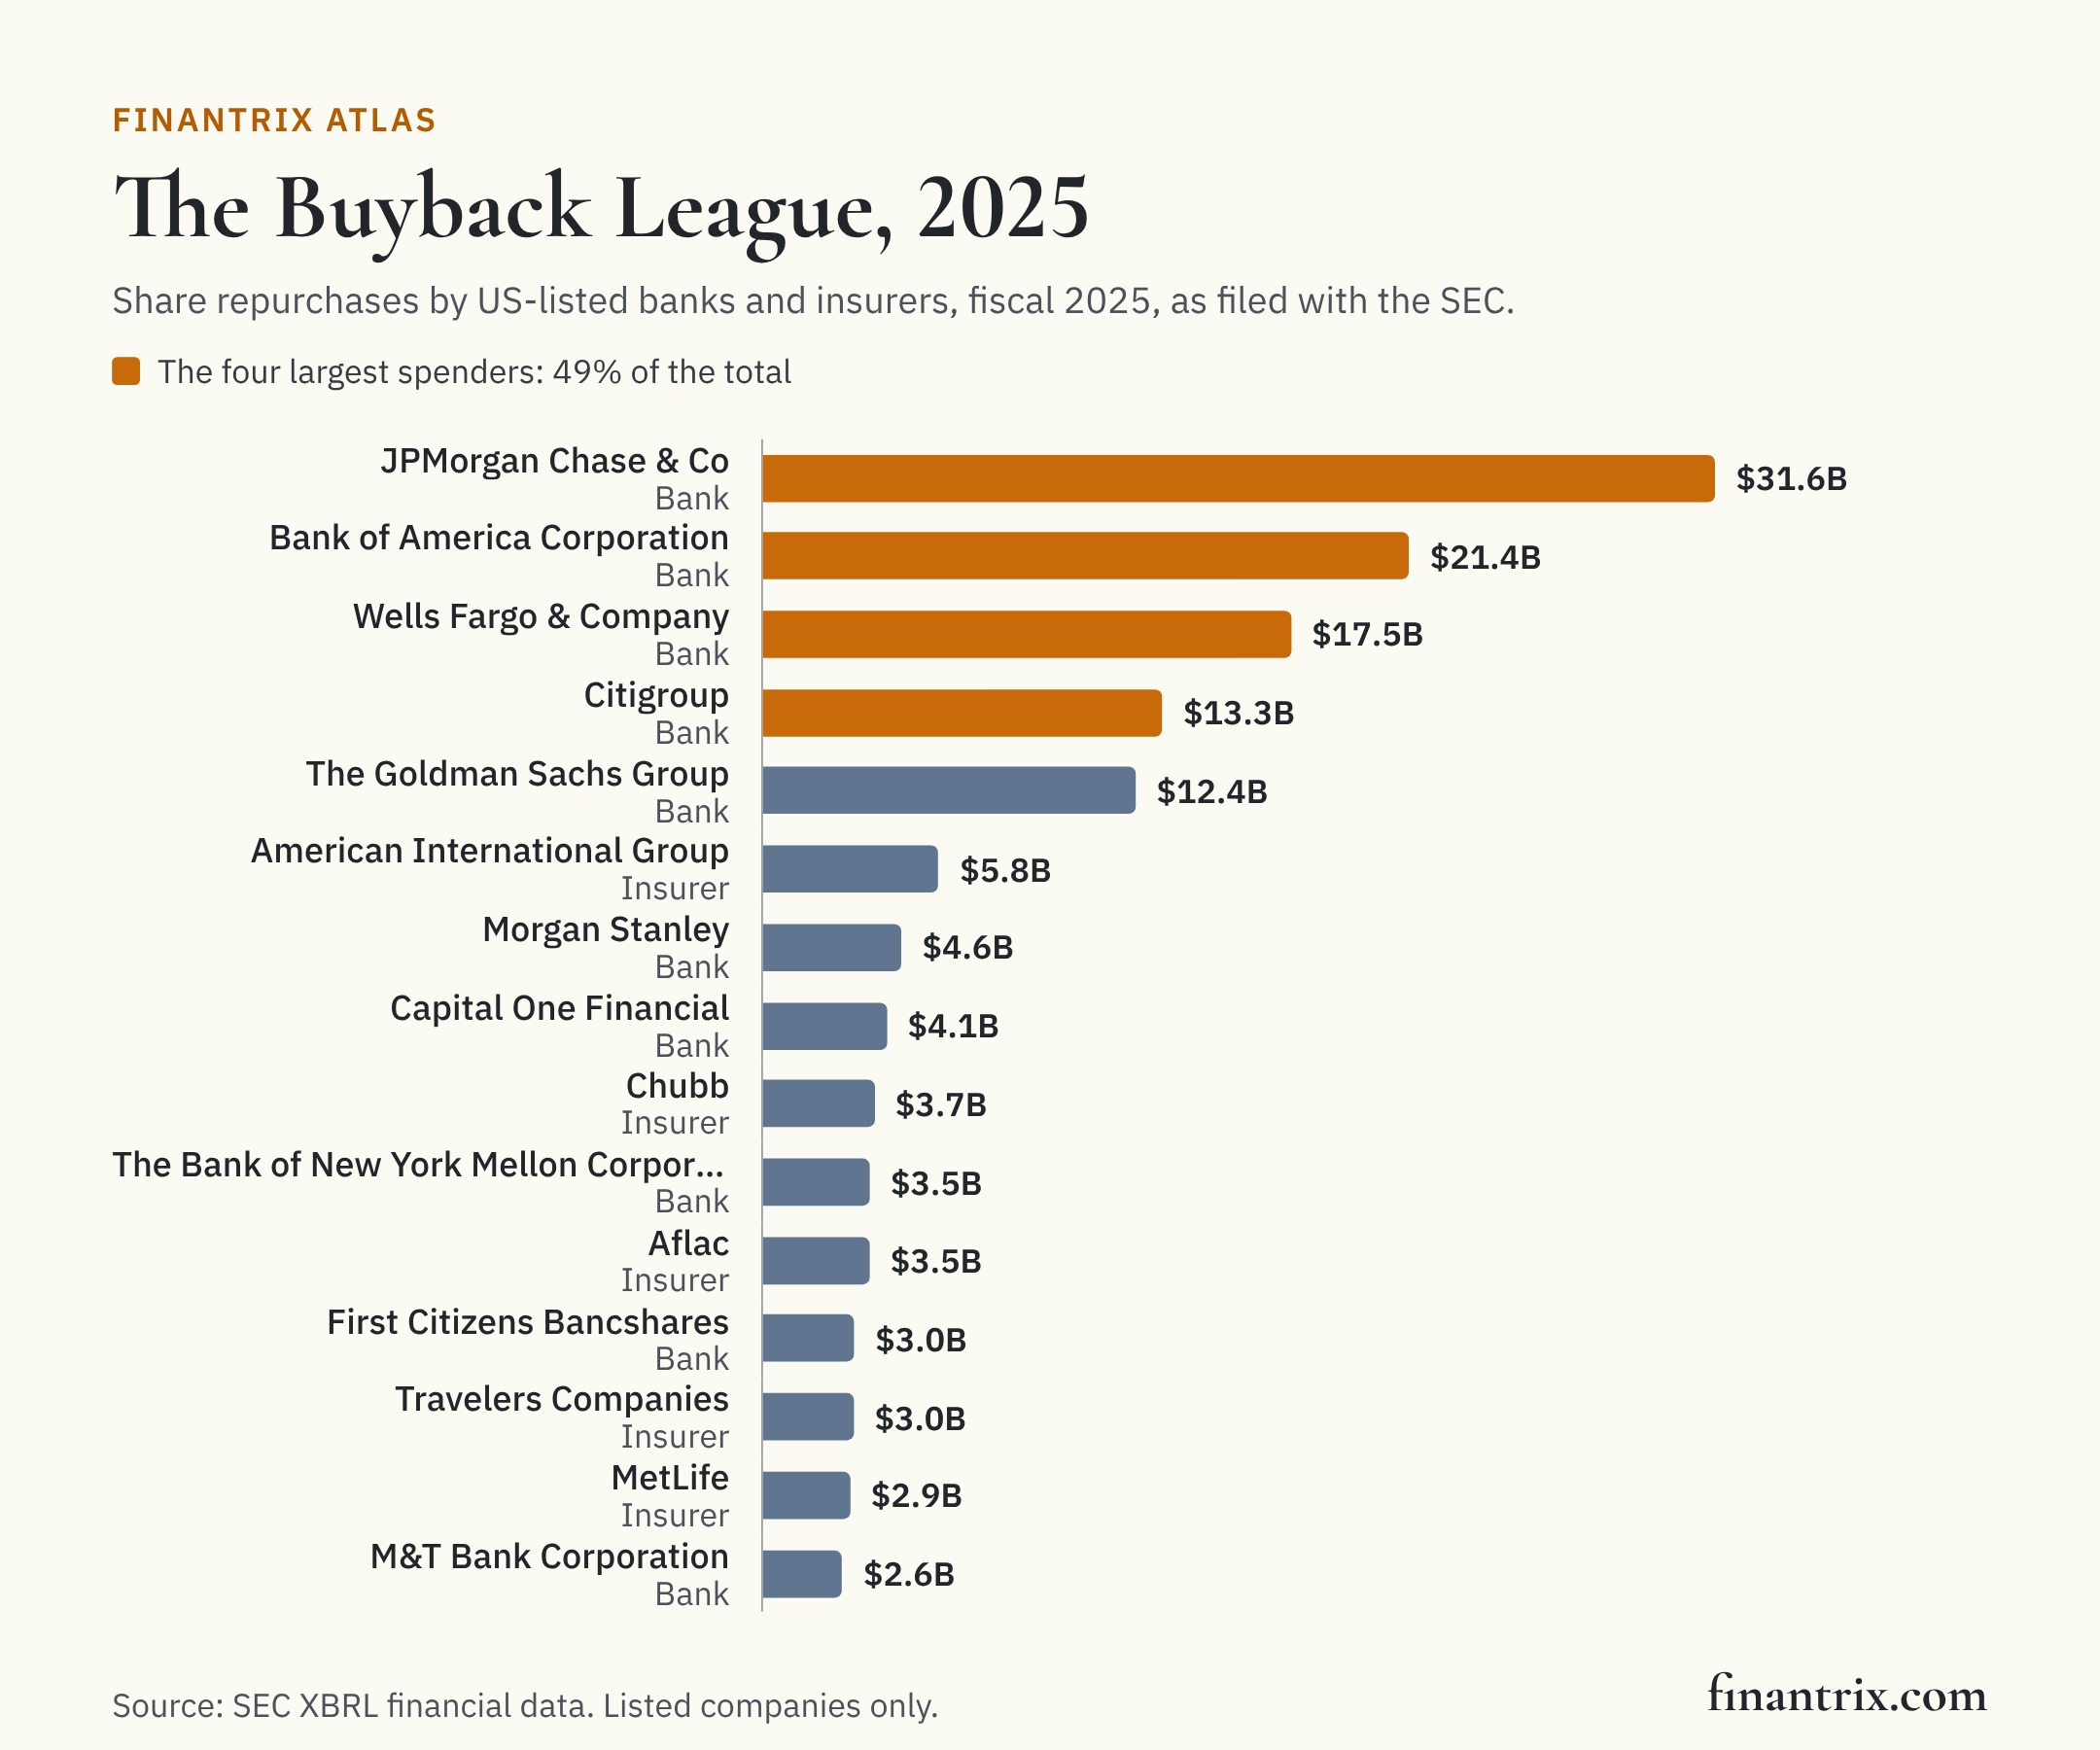
The Buyback League
The 30 listed banks and insurers that spent the most on repurchases of their common stock in fiscal 2025, with the same figure for 2024. "Reported in" says which line of the financial statements the amount comes from.
| Rank | Company | Ticker | Type | Buybacks, 2025 | Buybacks, 2024 | Change | Reported in | Source |
|---|---|---|---|---|---|---|---|---|
| 1 | JPMorgan Chase & Co | JPM | Bank | $31.6 billion | $18.8 billion | +68% | cash flow statement | SEC |
| 2 | Bank of America Corporation | BAC | Bank | $21.4 billion | $13.1 billion | +64% | cash flow statement | SEC |
| 3 | Wells Fargo & Company | WFC | Bank | $17.5 billion | $19.4 billion | −10% | cash flow statement | SEC |
| 4 | Citigroup | C | Bank | $13.3 billion | $2.5 billion | +436% | cash flow statement | SEC |
| 5 | The Goldman Sachs Group | GS | Bank | $12.4 billion | $8.0 billion | +54% | cash flow statement | SEC |
| 6 | American International Group | AIG | Insurer | $5.8 billion | $6.7 billion | −12% | cash flow statement | SEC |
| 7 | Morgan Stanley | MS | Bank | $4.6 billion | $3.3 billion | +41% | equity statement | SEC |
| 8 | Capital One Financial | COF | Bank | $4.1 billion | $734 million | +458% | cash flow statement | SEC |
| 9 | Chubb | CB | Insurer | $3.7 billion | $1.8 billion | +105% | cash flow statement | SEC |
| 10 | The Bank of New York Mellon Corporation | BNY | Bank | $3.5 billion | $3.1 billion | +15% | cash flow statement | SEC |
| 11 | Aflac | AFL | Insurer | $3.5 billion | $2.8 billion | +26% | cash flow statement | SEC |
| 12 | First Citizens Bancshares | FCNCA | Bank | $3.0 billion | $1.6 billion | +84% | cash flow statement | SEC |
| 13 | Travelers Companies | TRV | Insurer | $3.0 billion | $1.0 billion | +200% | cash flow statement | SEC |
| 14 | MetLife | MET | Insurer | $2.9 billion | $3.2 billion | −10% | cash flow statement | SEC |
| 15 | M&T Bank Corporation | MTB | Bank | $2.6 billion | $396 million | +564% | cash flow statement | SEC |
| 16 | Truist Financial Corporation | TFC | Bank | $2.5 billion | $1.0 billion | +150% | cash flow statement | SEC |
| 17 | Corebridge Financial | CRBG | Insurer | $2.1 billion | $1.8 billion | +18% | cash flow statement | SEC |
| 18 | Arch Capital Group | ACGL | Insurer | $1.9 billion | $24 million | +7771% | cash flow statement | SEC |
| 19 | The Hartford Insurance Group | HIG | Insurer | $1.6 billion | $1.5 billion | +7% | cash flow statement | SEC |
| 20 | RenaissanceRe Holdings | RNR | Insurer | $1.6 billion | $667 million | +140% | cash flow statement | SEC |
| 21 | PNC Financial Services Group | PNC | Bank | $1.3 billion | $687 million | +95% | cash flow statement | SEC |
| 22 | Northern Trust Corporation | NTRS | Bank | $1.3 billion | $938 million | +36% | cash flow statement | SEC |
| 23 | Allstate | ALL | Insurer | $1.2 billion | $2 million | +61550% | cash flow statement | SEC |
| 24 | State Street Corporation | STT | Bank | $1.2 billion | $1.3 billion | −9% | cash flow statement | SEC |
| 25 | Regions Financial Corporation | RF | Bank | $1.1 billion | $348 million | +207% | cash flow statement | SEC |
| 26 | Unum Group | UNM | Insurer | $1.0 billion | $973 million | +4% | cash flow statement | SEC |
| 27 | Prudential Financial | PRU | Insurer | $1.0 billion | $1.0 billion | 0% | cash flow statement | SEC |
| 28 | First Horizon | FHN | Bank | $918 million | $626 million | +47% | cash flow statement | SEC |
| 29 | Principal Financial Group | PFG | Insurer | $903 million | $1.0 billion | −13% | cash flow statement | SEC |
| 30 | Axis Capital Holdings | AXS | Insurer | $888 million | $200 million | +344% | cash flow statement | SEC |
Download this table (CSV), free. The full dataset, every listed bank and insurer that reports buybacks, with both years, the line it came from and total assets, is one email away.
Who is in it
The universe is every company EDGAR files under the commercial bank, savings institution and insurer industry codes that is listed on a US exchange, plus The Goldman Sachs Group and Morgan Stanley, which EDGAR files as securities firms but which are bank holding companies. The amount is the cash spent on repurchases in the cash flow statement; 19 companies that tag only the equity statement or treasury stock line are taken from those. Listed companies with more than $100 billion of assets and none of the three lines: Berkshire Hathaway, Athene Holding, Lincoln National Corporation, Huntington Bancshares, Santander Holdings USA, American National Group and Progressive. Some of those bought nothing; the page does not say which.
What this means for technology buyers
A bank's buyback capacity is set by its capital ratios and stress test results, so the room it has to return capital depends on how precisely it measures risk-weighted assets and capital. These guides compare the options side by side:
- Regulatory reporting platforms: capital ratios and the reports behind them.
- Data warehouses for financial services: the data the ratios are computed from.
More from Finantrix Atlas
- Largest US bank holding companies
- US-listed P&C insurers ranked by premiums
- Publicly traded life insurers by assets
Limits
- As tagged. Each company chooses its XBRL tags; a repurchase tagged another way is not counted.
- Cash spent, not shares retired. Amounts are what each company reports for its fiscal year, which for nearly all of them is the calendar year.
- Listed companies only. Mutual insurers and banks without SEC filings are not in the data.
Cite this
Free to quote, cite and republish, including the chart, with credit to Finantrix Atlas and a link to this page.
JPMorgan Chase & Co spent $31.6 billion on share buybacks in 2025, the most of any US-listed bank or insurer, according to a Finantrix Atlas analysis of SEC filings.
Suggested citation: Finantrix Atlas, "The Buyback League," fiscal 2025, from SEC XBRL financial data. https://www.finantrix.com/articles/bank-buybacks
Embed the chart:
<a href="https://www.finantrix.com/articles/bank-buybacks"><img src="https://www.finantrix.com/atlas/bank-buybacks.png?v=2025-12-31" alt="The Buyback League: bank and insurer share repurchases, from Finantrix Atlas"></a>
<p>Chart: <a href="https://www.finantrix.com/articles/bank-buybacks">Finantrix Atlas</a>, from SEC data.</p>
Frequently asked questions
Q: Which bank buys back the most stock? A: JPMorgan Chase & Co, $31.6 billion in 2025, the most of any US-listed bank or insurer, according to SEC filings.
Q: How much do banks and insurers spend on buybacks? A: $172 billion in 2025 across the 257 listed banks and insurers that report them: $130 billion by banks and $41.5 billion by insurers.
Download the data
Two CSV files, free: the 30 rows on this page, and the full dataset of all 257 rows, as of December 31, 2025.
Frequently Asked Questions
Which bank buys back the most stock?
JPMorgan Chase & Co, $31.6 billion in 2025, the most of any US-listed bank or insurer, according to SEC filings.
How much do banks and insurers spend on buybacks?
$172 billion in 2025 across the 257 listed banks and insurers that report them: $130 billion by banks and $41.5 billion by insurers.