
Key Takeaways
- Listed P&C insurers with at least $1.0 billion of premiums paid out 60.8% of net premiums earned in losses and loss adjustment expenses in 2025, weighted by premiums, according to SEC filings.
- RLI reported the lowest loss ratio among them, 45.0%, and Mercury General Corporation the highest, 72.0%.
- Mortgage and financial guaranty insurers reported loss ratios as low as 5.1%, a business whose losses arrive in downturns rather than every year.
- 2 insurers whose two loss figures disagree, because they also write life or other business, are set aside rather than mixed in.
US-listed property and casualty insurers with at least $1.0 billion of premiums paid out 60.8% of their net premiums earned in losses and loss adjustment expenses in 2025, weighted by premiums, according to the financial data they file with the SEC. RLI reported the lowest loss ratio of the 28, 45.0%, and Mercury General Corporation the highest, 72.0%; the median is 60.5%.
A loss ratio is the share of premiums an insurer spends on claims and on handling them. It leaves out commissions and other operating costs, which a combined ratio adds, so a loss ratio well below one hundred percent is not by itself a profit. It moves with catastrophes, reserve changes and the mix of business, and one year says less than several.
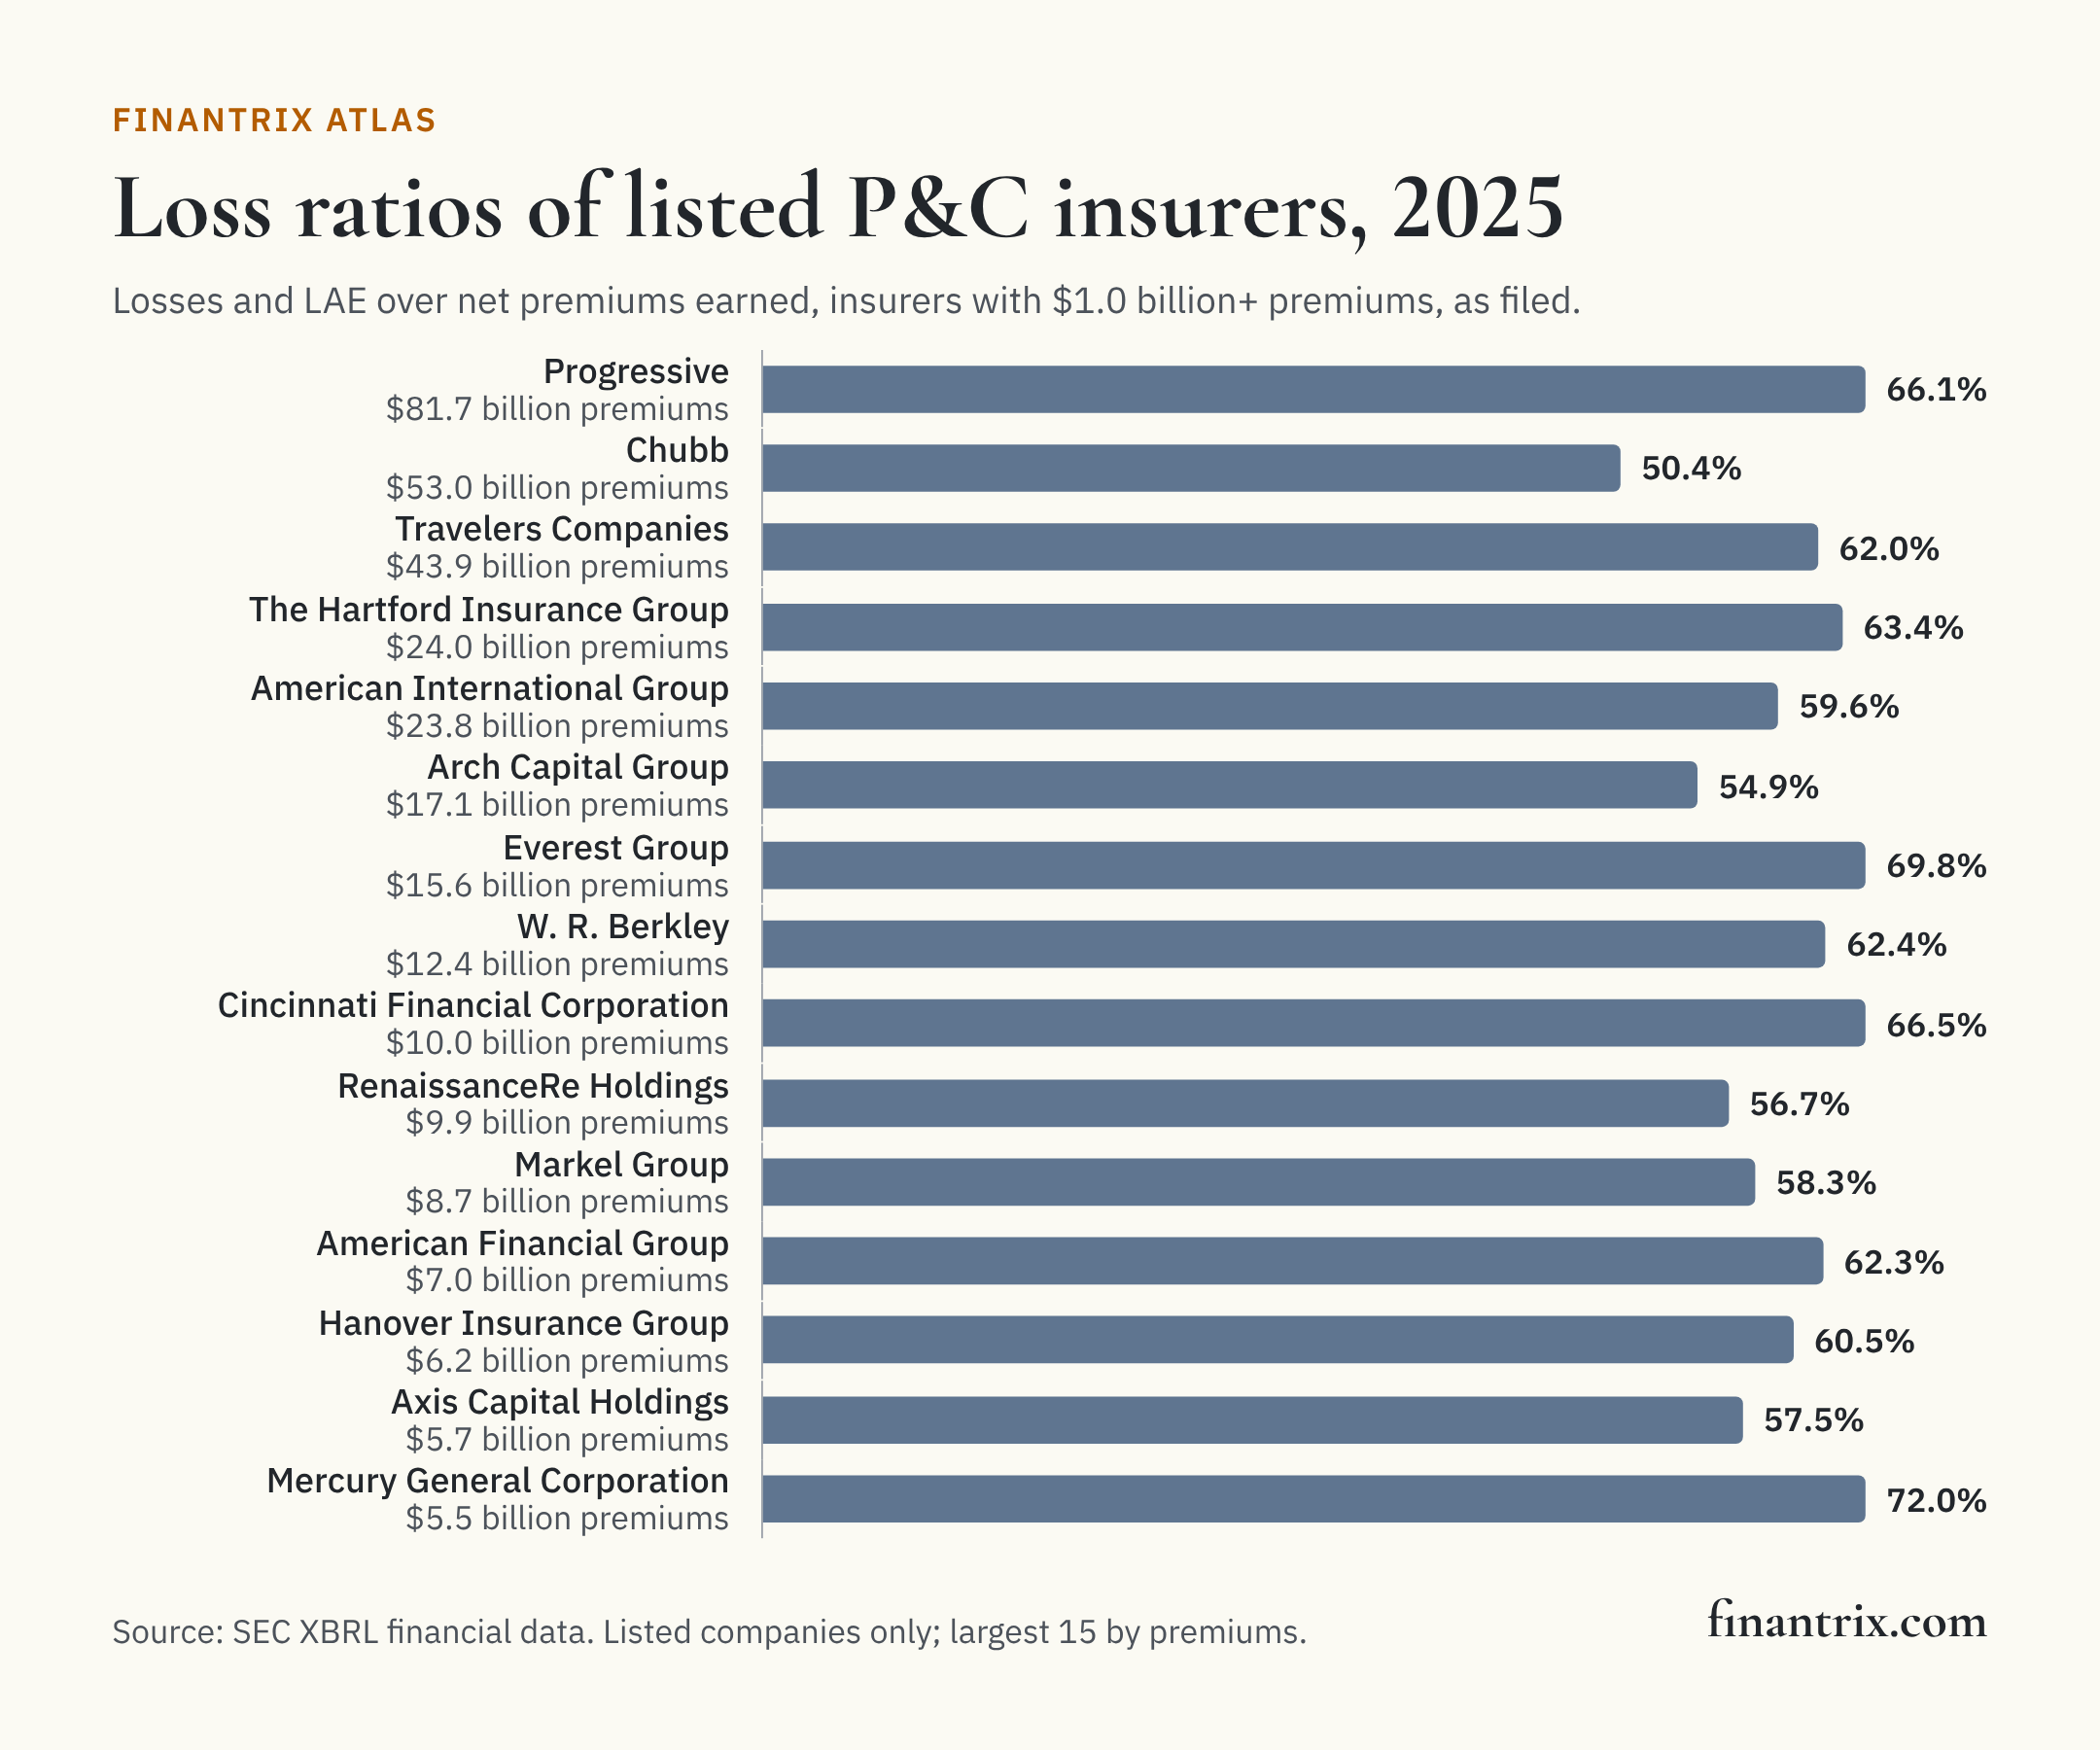
Listed P&C insurers by loss ratio
Every insurer filed under SIC 6331 (fire, marine and casualty) with at least $1.0 billion of net premiums earned and a loss figure, ranked from the lowest loss ratio, fiscal 2025. Losses are net of reinsurance, from the income statement line or, where a company tags only that, the incurred line of its reserve roll-forward.
| Rank (lowest first) | Insurer | Ticker | Loss ratio | Losses and LAE incurred | Net premiums earned | Loss figure from | Source |
|---|---|---|---|---|---|---|---|
| 1 | RLI | RLI | 45.0% | $726 million | $1.6 billion | income statement | SEC |
| 2 | Pelagos Insurance Capital | PLGO | 47.5% | $1.1 billion | $2.3 billion | income statement | SEC |
| 3 | White Mountains Insurance Group | WTM | 49.6% | $882 million | $1.8 billion | reserve roll-forward | SEC |
| 4 | Chubb | CB | 50.4% | $26.7 billion | $53.0 billion | income statement | SEC |
| 5 | Aspen Insurance Holdings | AHL-PD | 54.6% | $1.5 billion | $2.8 billion | income statement | SEC |
| 6 | Arch Capital Group | ACGL | 54.9% | $9.4 billion | $17.1 billion | income statement | SEC |
| 7 | Kinsale Capital Group | KNSL | 56.5% | $891 million | $1.6 billion | income statement | SEC |
| 8 | RenaissanceRe Holdings | RNR | 56.7% | $5.6 billion | $9.9 billion | income statement | SEC |
| 9 | Axis Capital Holdings | AXS | 57.5% | $3.3 billion | $5.7 billion | reserve roll-forward | SEC |
| 10 | Markel Group | MKL | 58.3% | $5.1 billion | $8.7 billion | reserve roll-forward | SEC |
| 11 | SiriusPoint | SPNT | 58.6% | $1.5 billion | $2.6 billion | income statement | SEC |
| 12 | United Fire Group | UFCS | 59.1% | $764 million | $1.3 billion | income statement | SEC |
| 13 | American International Group | AIG | 59.6% | $14.2 billion | $23.8 billion | income statement | SEC |
| 14 | Hamilton Insurance Group | HG | 59.7% | $1.3 billion | $2.1 billion | reserve roll-forward | SEC |
| 15 | Hanover Insurance Group | THG | 60.5% | $3.7 billion | $6.2 billion | income statement | SEC |
| 16 | Skyward Specialty Insurance Group | SKWD | 60.9% | $795 million | $1.3 billion | reserve roll-forward | SEC |
| 17 | Travelers Companies | TRV | 62.0% | $27.2 billion | $43.9 billion | income statement | SEC |
| 18 | American Financial Group | AFG | 62.3% | $4.4 billion | $7.0 billion | income statement | SEC |
| 19 | W. R. Berkley | WRB | 62.4% | $7.8 billion | $12.4 billion | income statement | SEC |
| 20 | The Hartford Insurance Group | HIG | 63.4% | $15.2 billion | $24.0 billion | income statement | SEC |
| 21 | Root | ROOT | 65.9% | $924 million | $1.4 billion | reserve roll-forward | SEC |
| 22 | Progressive | PGR | 66.1% | $54.0 billion | $81.7 billion | income statement | SEC |
| 23 | Selective Insurance Group | SIGI | 66.2% | $3.2 billion | $4.8 billion | income statement | SEC |
| 24 | Cincinnati Financial Corporation | CINF | 66.5% | $6.6 billion | $10.0 billion | income statement | SEC |
| 25 | Universal Insurance Holdings | UVE | 68.5% | $986 million | $1.4 billion | income statement | SEC |
| 26 | Everest Group | EG | 69.8% | $10.9 billion | $15.6 billion | income statement | SEC |
| 27 | Safety Insurance Group | SAFT | 70.0% | $797 million | $1.1 billion | income statement | SEC |
| 28 | Mercury General Corporation | MCY | 72.0% | $4.0 billion | $5.5 billion | reserve roll-forward | SEC |
Download this table (CSV), free. The full dataset, every listed insurer's premiums and both loss figures as tagged, is one email away.
Surety, mortgage and financial guaranty insurers
Insurers filed under SIC 6351 are shown apart, because their losses come in downturns rather than every year and their ratios are not comparable to a motor or property book. Some of them also write title or general insurance, which is in their premiums.
| Insurer | Ticker | Loss ratio | Net premiums earned | Source |
|---|---|---|---|---|
| Old Republic International Corporation | ORI | 43.2% | $7.8 billion | SEC |
| Essent Group | ESNT | 15.2% | $984 million | SEC |
| MGIC Investment | MTG | 5.1% | $966 million | SEC |
| Radian Group | RDN | 7.1% | $942 million | SEC |
| NMI Holdings | NMIH | 9.6% | $602 million | SEC |
| Assured Guaranty | AGO | 14.7% | $380 million | SEC |
| Octave Specialty Group | OSG | 70.2% | $67 million | SEC |
Who is not here
Mutual and reciprocal insurers do not file with the SEC, and Berkshire Hathaway reports insurance only by segment. 2 insurers tag both loss figures and the two differ by more than 1% of premiums, CNA Financial Corporation and Horace Mann Educators Corporation: the difference is business beyond P&C, so neither figure is a P&C loss ratio, and they are set aside. With at least $1.0 billion of premiums and no loss figure in either tag: Kemper Corporation, Allstate and Slide Insurance Holdings.
What this means for technology buyers
A loss ratio is claims cost and claims handling, and the handling is where systems show up: triage, fraud screening, reserving and reinsurance recoveries. These guides compare the options side by side:
- Claims fraud detection for auto insurance: leakage in the largest line.
- Document management for insurance claims: the claim file.
More from Finantrix Atlas
How this list was built
The figures are each company's XBRL facts in the SEC's frames for calendar 2025: net premiums earned and losses and loss adjustment expenses incurred, net, for its fiscal year closest to the calendar year. A holding company that consolidates a listed insurer is left out so the same book does not appear twice.
Limits
- As tagged. Each company chooses its XBRL tags; the figures are what it filed, not restated to one definition.
- All lines. A group that also writes accident and health or other lines carries them in both premiums and losses.
- Listed insurers only. Mutuals, reciprocals and companies without SEC filings are missing, so this is not the whole market.
- One year. Catastrophes and reserve releases move single years a long way.
Cite this
Free to quote, cite and republish, including the chart, with credit to Finantrix Atlas and a link to this page.
US-listed P&C insurers with at least $1.0 billion of premiums had a premium-weighted loss ratio of 60.8% in 2025, according to a Finantrix Atlas analysis of SEC filings.
Suggested citation: Finantrix Atlas, "Loss Ratios of US-Listed P&C Insurers," fiscal 2025, from SEC XBRL financial data. https://www.finantrix.com/articles/listed-pc-insurers-loss-ratio
Embed the chart:
<a href="https://www.finantrix.com/articles/listed-pc-insurers-loss-ratio"><img src="https://www.finantrix.com/atlas/listed-pc-insurers-loss-ratio.png?v=2025-12-31" alt="Loss ratios of US-listed P&C insurers, from Finantrix Atlas"></a>
<p>Chart: <a href="https://www.finantrix.com/articles/listed-pc-insurers-loss-ratio">Finantrix Atlas</a>, from SEC data.</p>
Frequently asked questions
Q: What is the average loss ratio of listed P&C insurers? A: 60.8% of net premiums earned in 2025, weighted by premiums, for the 28 listed insurers with at least $1.0 billion of premiums; the median is 60.5%.
Q: Which listed P&C insurer had the lowest loss ratio? A: RLI, 45.0% in 2025, among listed insurers with at least $1.0 billion of premiums, according to SEC filings.
Download the data
Two CSV files, free: the 28 rows on this page, and the full dataset of all 60 rows, as of December 31, 2025.
Frequently Asked Questions
What is the average loss ratio of listed P&C insurers?
60.8% of net premiums earned in 2025, weighted by premiums, for the 28 listed insurers with at least $1.0 billion of premiums; the median is 60.5%.
Which listed P&C insurer had the lowest loss ratio?
RLI, 45.0% in 2025, among listed insurers with at least $1.0 billion of premiums, according to SEC filings.