
Key Takeaways
- Beal Bank USA reports the lowest efficiency ratio among the 1,046 FDIC-insured US banks with $1 billion or more in assets, 6.0%, according to FDIC Call Report data for the first half of 2026; a lower ratio means less overhead per dollar of revenue.
- The median bank of that size spends 58.4% of its revenue on overhead; 251 spend less than half, and 7 spend more than all of it, according to FDIC data.
- The ratio is the FDIC's own: noninterest expense, less amortization of intangibles, as a share of net interest income plus noninterest income.
- Industry net interest income, noninterest income and noninterest expense for the quarter add up to the FDIC's Quarterly Banking Profile, to the million dollars.
Beal Bank USA reports the lowest efficiency ratio among the 1,046 FDIC-insured US banks with $1 billion or more in assets, 6.0%, according to FDIC Call Report data for the first half of 2026. Ameriprise Bank, FSB follows at 10.0% and Greene County Commercial Bank at 10.9%. The median bank of that size spends 58.4% of its revenue on overhead; 251 spend less than half, and 7 spend more than all of it.
The efficiency ratio is overhead divided by revenue: noninterest expense, less amortization of intangible assets, as a share of net interest income plus noninterest income. A lower ratio means a bank keeps more of each dollar of revenue before credit losses and taxes. The FDIC computes it from each bank's Call Report.
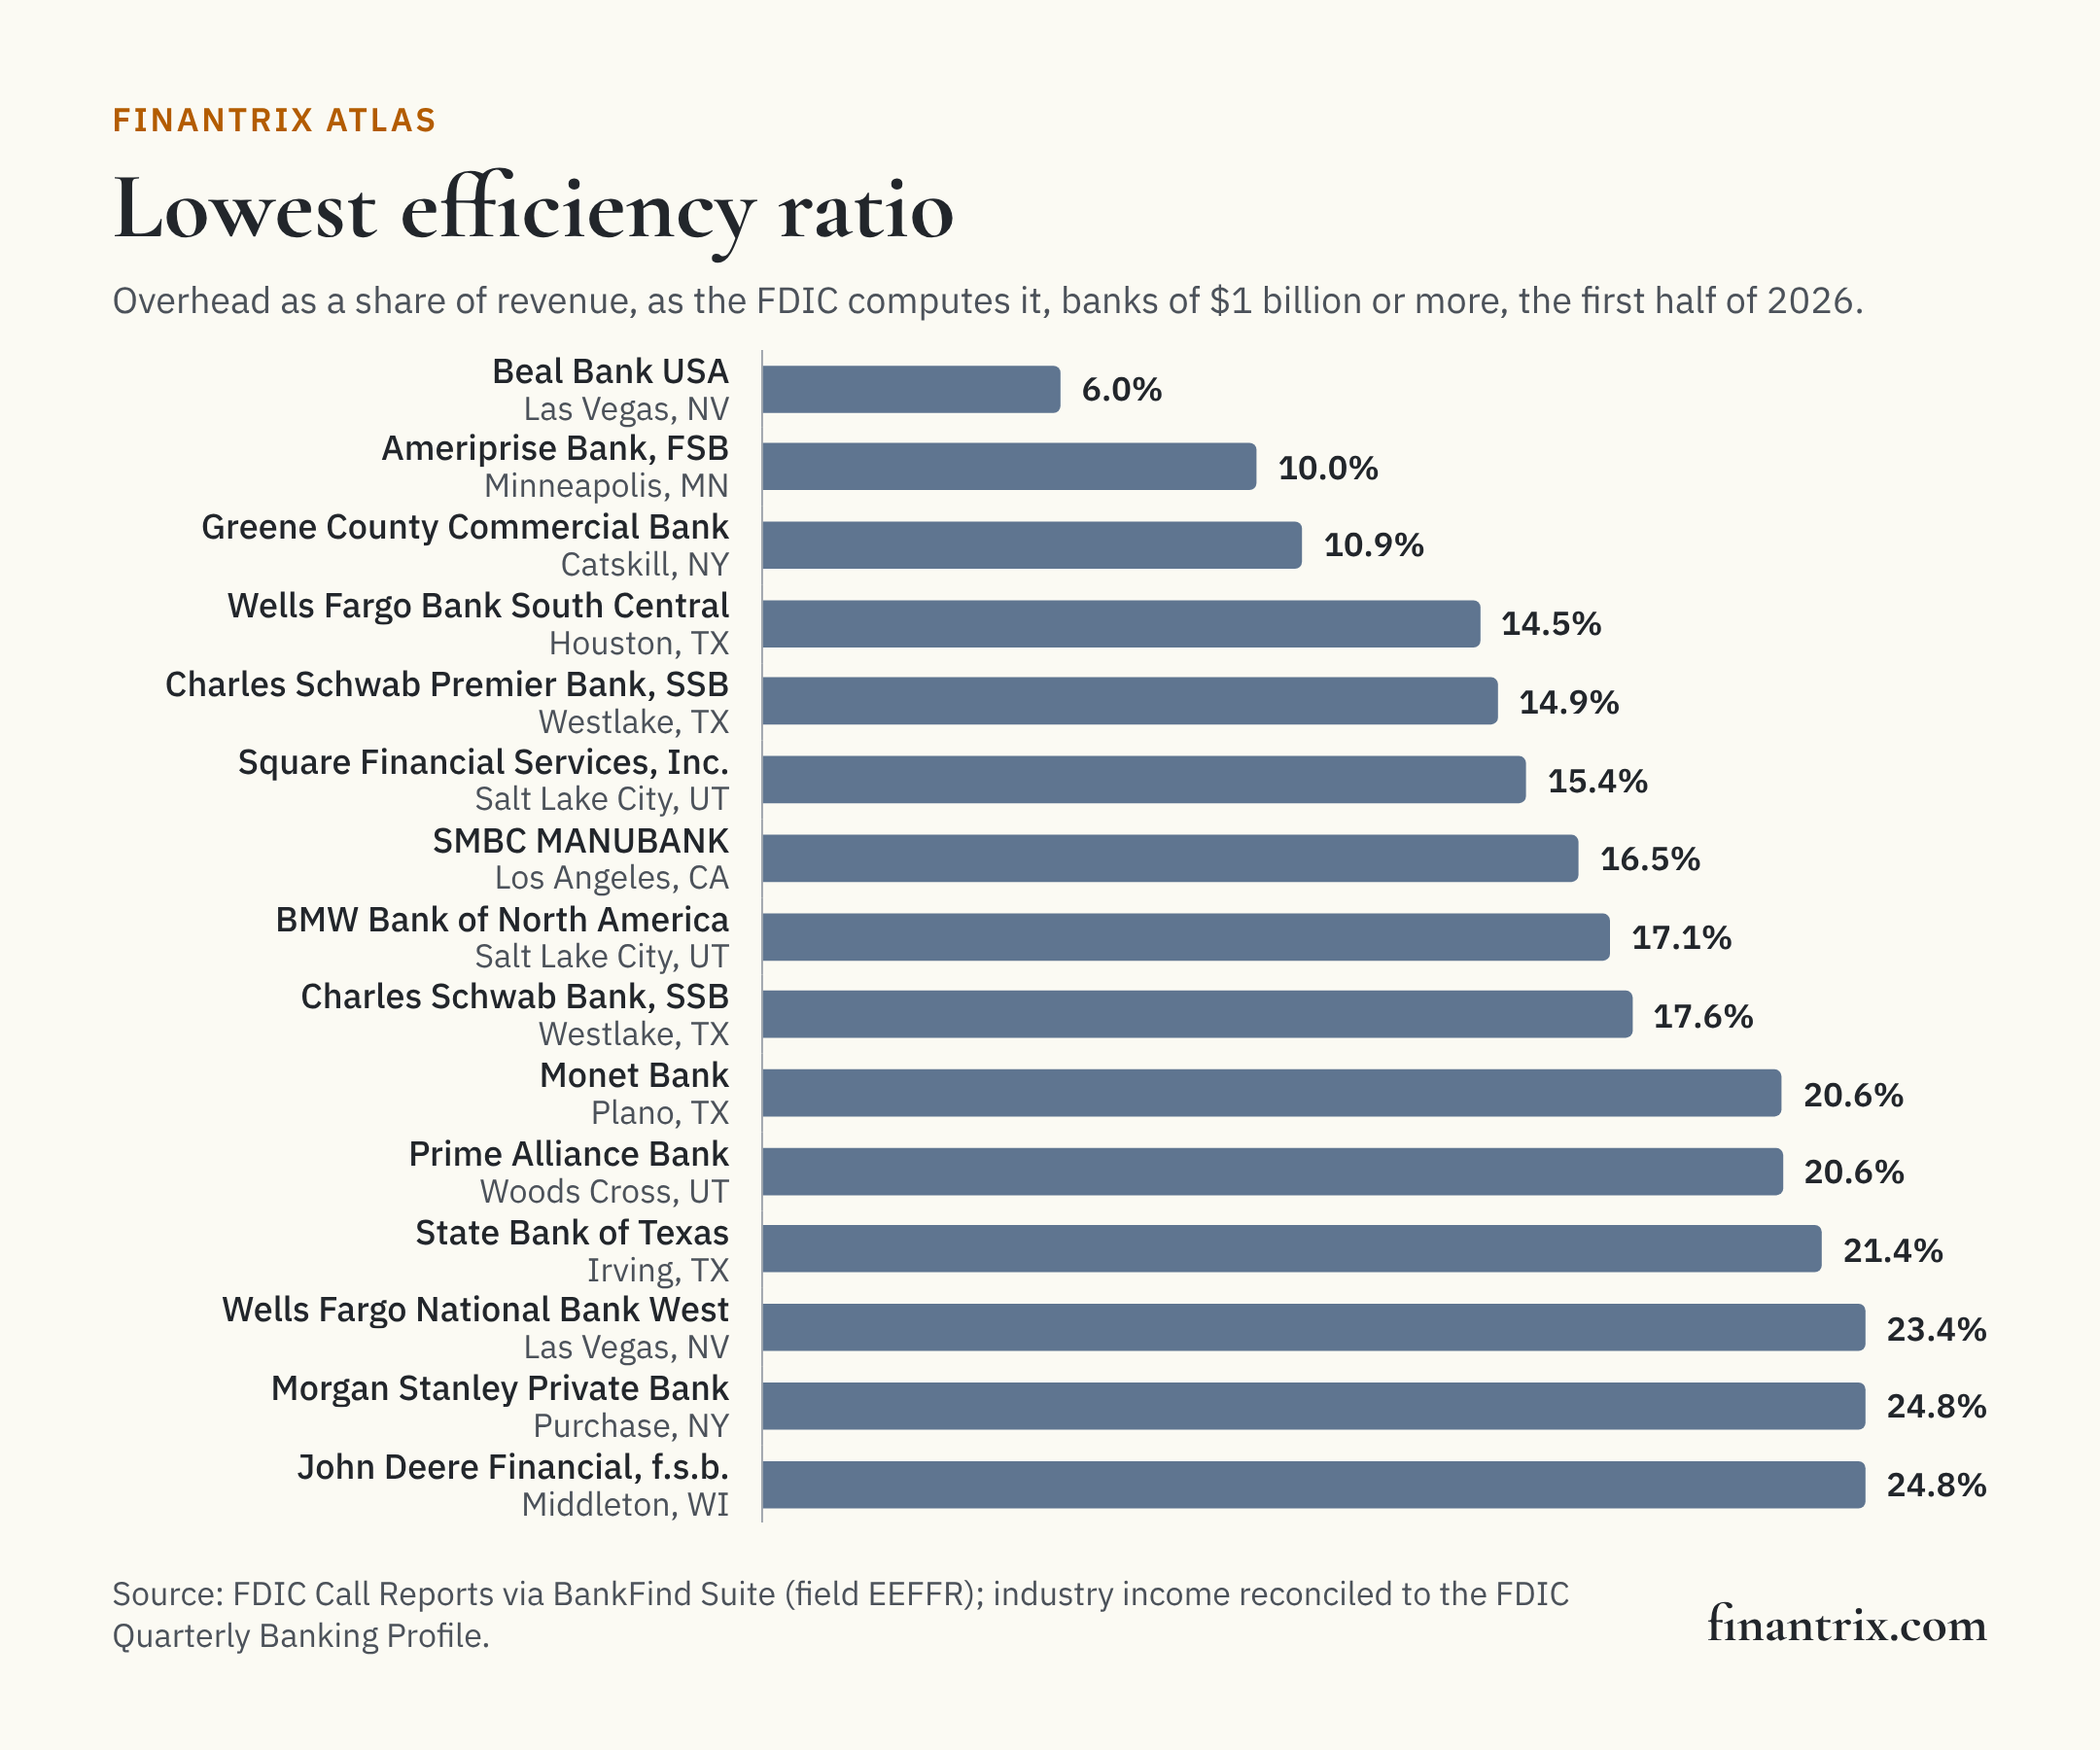
The 50 most efficient banks
Ranked from the lowest efficiency ratio, as the FDIC computes it, for the first half of 2026, among banks with $1 billion or more in assets. Each row is one bank charter, with the revenue and overhead behind its ratio. The ratio needed to make this list is 35.7% or lower.
| Rank | Bank | Headquarters | Efficiency ratio | Revenue, year to date | Noninterest expense, year to date | Total assets | Source |
|---|---|---|---|---|---|---|---|
| 1 | Beal Bank USA | Las Vegas, NV | 6.0% | $629 million | $38 million | $11.0 billion | FDIC |
| 2 | Ameriprise Bank, FSB | Minneapolis, MN | 10.0% | $568 million | $57 million | $25.5 billion | FDIC |
| 3 | Greene County Commercial Bank | Catskill, NY | 10.9% | $11 million | $1 million | $1.3 billion | FDIC |
| 4 | Wells Fargo Bank South Central | Houston, TX | 14.5% | $32 million | $5 million | $2.6 billion | FDIC |
| 5 | Charles Schwab Premier Bank, SSB | Westlake, TX | 14.9% | $323 million | $48 million | $26.6 billion | FDIC |
| 6 | Square Financial Services, Inc. | Salt Lake City, UT | 15.4% | $700 million | $108 million | $2.1 billion | FDIC |
| 7 | SMBC MANUBANK | Los Angeles, CA | 16.5% | $50 million | $8 million | $6.6 billion | FDIC |
| 8 | BMW Bank of North America | Salt Lake City, UT | 17.1% | $255 million | $44 million | $13.8 billion | FDIC |
| 9 | Charles Schwab Bank, SSB | Westlake, TX | 17.6% | $2.6 billion | $459 million | $251 billion | FDIC |
| 10 | Monet Bank | Plano, TX | 20.6% | $99 million | $20 million | $3.2 billion | FDIC |
| 11 | Prime Alliance Bank | Woods Cross, UT | 20.6% | $26 million | $5 million | $1.1 billion | FDIC |
| 12 | State Bank of Texas | Irving, TX | 21.4% | $70 million | $15 million | $2.6 billion | FDIC |
| 13 | Wells Fargo National Bank West | Las Vegas, NV | 23.4% | $70 million | $16 million | $8.8 billion | FDIC |
| 14 | Morgan Stanley Private Bank | Purchase, NY | 24.8% | $2.5 billion | $633 million | $250 billion | FDIC |
| 15 | John Deere Financial, f.s.b. | Middleton, WI | 24.8% | $163 million | $40 million | $4.9 billion | FDIC |
| 16 | Charles Schwab Trust Bank | Westlake, TX | 25.4% | $187 million | $48 million | $10.5 billion | FDIC |
| 17 | Optum Bank, Inc. | Draper, UT | 25.7% | $552 million | $161 million | $21.4 billion | FDIC |
| 18 | UBS Bank USA | Salt Lake City, UT | 26.3% | $1.2 billion | $325 million | $124 billion | FDIC |
| 19 | First National Bank of America | East Lansing, MI | 26.6% | $165 million | $44 million | $6.8 billion | FDIC |
| 20 | Stifel Bank and Trust | Saint Louis, MO | 26.9% | $348 million | $94 million | $19.6 billion | FDIC |
| 21 | RBC Bank, (Georgia) | Atlanta, GA | 27.2% | $203 million | $56 million | $9.6 billion | FDIC |
| 22 | Medallion Bank | Salt Lake City, UT | 27.7% | $117 million | $32 million | $2.8 billion | FDIC |
| 23 | Malaga Bank F.S.B. | Palos Verdes Pen, CA | 29.0% | $24 million | $7 million | $1.4 billion | FDIC |
| 24 | Stifel Bank | Saint Louis, MO | 29.1% | $170 million | $50 million | $14.6 billion | FDIC |
| 25 | Northbrook Bank and Trust Company | Northbrook, IL | 29.2% | $95 million | $28 million | $6.4 billion | FDIC |
| 26 | ServisFirst Bank | Birmingham, AL | 29.6% | $328 million | $97 million | $18.3 billion | FDIC |
| 27 | Parke Bank | Sewell, NJ | 29.6% | $47 million | $14 million | $2.3 billion | FDIC |
| 28 | Bank of New England | Salem, NH | 29.7% | $37 million | $11 million | $1.8 billion | FDIC |
| 29 | Village Bank and Trust | Arlington Height, IL | 30.4% | $70 million | $21 million | $3.6 billion | FDIC |
| 30 | River City Bank | Sacramento, CA | 30.6% | $79 million | $24 million | $6.0 billion | FDIC |
| 31 | Jonesboro State Bank | Jonesboro, LA | 30.6% | $19 million | $6 million | $1.3 billion | FDIC |
| 32 | The Yellowstone Bank | Laurel, MT | 31.2% | $29 million | $9 million | $1.3 billion | FDIC |
| 33 | First General Bank | Rowland Heights, CA | 31.7% | $28 million | $9 million | $1.2 billion | FDIC |
| 34 | Macatawa Bank | Holland, MI | 32.4% | $72 million | $32 million | $3.7 billion | FDIC |
| 35 | Quill Bank | Provo, UT | 32.4% | $136 million | $44 million | $1.6 billion | FDIC |
| 36 | Merrick Bank | South Jordan, UT | 32.4% | $946 million | $318 million | $9.1 billion | FDIC |
| 37 | Wheaton Bank & Trust | Wheaton, IL | 32.6% | $71 million | $23 million | $4.8 billion | FDIC |
| 38 | First American Trust, FSB | Santa Ana, CA | 32.8% | $122 million | $40 million | $9.2 billion | FDIC |
| 39 | Sallie Mae Bank | Salt Lake City, UT | 33.0% | $980 million | $323 million | $28.5 billion | FDIC |
| 40 | Preferred Bank | Los Angeles, CA | 33.0% | $143 million | $47 million | $7.7 billion | FDIC |
| 41 | Celtic Bank | Salt Lake City, UT | 33.2% | $212 million | $70 million | $5.3 billion | FDIC |
| 42 | The Bank of Commerce | Ammon, ID | 33.4% | $53 million | $18 million | $2.3 billion | FDIC |
| 43 | Libertyville Bank & Trust Company | Libertyville, IL | 33.4% | $58 million | $19 million | $3.3 billion | FDIC |
| 44 | InterBank | Oklahoma City, OK | 33.6% | $132 million | $45 million | $5.3 billion | FDIC |
| 45 | Crystal Lake Bank and Trust Company | Crystal Lake, IL | 34.0% | $39 million | $13 million | $2.3 billion | FDIC |
| 46 | Amboy Bank | Old Bridge, NJ | 34.2% | $58 million | $20 million | $3.1 billion | FDIC |
| 47 | Schaumburg Bank & Trust Company | Schaumburg, IL | 34.5% | $43 million | $15 million | $2.6 billion | FDIC |
| 48 | Bank of Utica | Utica, NY | 35.0% | $14 million | $5 million | $1.5 billion | FDIC |
| 49 | Raymond James Bank | Saint Petersburg, FL | 35.4% | $726 million | $257 million | $45.6 billion | FDIC |
| 50 | Northeast Bank | Portland, ME | 35.7% | $132 million | $47 million | $5.2 billion | FDIC |
Download this table (CSV), free. The full dataset, every bank in the ranking with its revenue, expense and identifiers, is one email away.
What this means for technology buyers
Overhead is where technology shows up on a bank's income statement: the cost of the systems that open and service accounts, process payments and loans, and produce reports, and of the people who work around them. These guides compare the options side by side:
- Cloud-based core banking systems: the ledger and product engine under every account.
- Financial BI and dashboarding for bank executives: measuring cost and revenue by line and product.
- Procurement platforms for financial institutions: controlling what the bank buys.
Planning the change before choosing the vendor? The Banking and Payments Capability Matrix states what a bank does, from taking deposits to originating credit, so a platform can be placed against the capabilities it supports.
More from Finantrix Atlas
- Most profitable US banks by return on assets
- Largest banks in the US, ranked by total assets
- US banks with the most branches
- US banks by size: how many in each asset tier
How this list was built
The population is every FDIC-insured commercial bank and savings institution that filed a Call Report for June 30, 2026 with $1 billion or more in total assets, read from the FDIC's BankFind Suite, including banks whose charter has ended since. 2 banks of that size reported no positive revenue for the period, for which the ratio has no meaning, and are left out. Banks are ranked by the FDIC field EEFFR, which the FDIC's field definitions describe as noninterest expense less amortization of intangible assets as a percent of net interest income plus noninterest income, year to date, and of which it says "a lower value indicates greater efficiency". Nothing on this page recomputes the ratio; each bank's figure is checked to be no higher than its noninterest expense over its revenue, as the FDIC's definition requires.
The FDIC's Quarterly Banking Profile, the edition for the second quarter of 2026, prints the industry's income statement for the quarter. Summed across the same 4,238 institutions, the banks' net interest income, noninterest income and noninterest expense for the quarter equal it to the million dollars.
Limits
- Costs a bank books itself. The ratio reflects the expenses on the bank's own income statement. It does not show costs carried elsewhere in its group.
- Business models differ. A bank with a few large clients, or one that does little but hold loans and securities, can run with less overhead than a bank with branches and many accounts. The ratio compares cost to revenue; it does not judge the business.
- Year to date. The figures cover the first half of 2026. A one-off cost or gain in the period moves the ratio.
- Banks of $1 billion or more, the floor the other Finantrix Atlas ratio pages use.
- Banks, not holding companies. A group with several charters appears once per charter.
Cite this
Free to quote, cite and republish, including the chart, with credit to Finantrix Atlas and a link to this page.
The median FDIC-insured US bank with $1 billion or more in assets spent 58.4% of its revenue on overhead in the first half of 2026, according to a Finantrix Atlas analysis of FDIC data.
Suggested citation: Finantrix Atlas, "Most Efficient US Banks by Efficiency Ratio," data for the first half of 2026, from FDIC Call Reports. https://www.finantrix.com/articles/most-efficient-banks
Embed the chart:
<a href="https://www.finantrix.com/articles/most-efficient-banks"><img src="https://www.finantrix.com/atlas/most-efficient-banks.png?v=2026-06-30" alt="The most efficient US banks by efficiency ratio, from FDIC data, by Finantrix Atlas"></a>
<p>Chart: <a href="https://www.finantrix.com/articles/most-efficient-banks">Finantrix Atlas</a>, from FDIC Call Reports.</p>
Frequently asked questions
Q: Which US bank has the lowest efficiency ratio? A: Among FDIC-insured banks with $1 billion or more in assets, Beal Bank USA, at 6.0% for the first half of 2026, according to FDIC data.
Q: What is a typical bank efficiency ratio? A: The median bank with $1 billion or more in assets reported 58.4% for the first half of 2026, according to FDIC data.
Q: Is a lower efficiency ratio better? A: The FDIC says "a lower value indicates greater efficiency": the bank spends less on overhead for each dollar of revenue. It says nothing on its own about risk, growth or service.
Download the data
Two CSV files, free: the 50 rows on this page, and the full dataset of all 1,046 rows, as of June 30, 2026.
Frequently Asked Questions
Which US bank has the lowest efficiency ratio?
Among FDIC-insured banks with $1 billion or more in assets, Beal Bank USA, at 6.0% for the first half of 2026, according to FDIC data.
What is a typical bank efficiency ratio?
The median bank with $1 billion or more in assets reported 58.4% for the first half of 2026, according to FDIC data.
Is a lower efficiency ratio better?
The FDIC says "a lower value indicates greater efficiency": the bank spends less on overhead for each dollar of revenue. It says nothing on its own about risk, growth or service.