
Key Takeaways
- Wells Fargo drew the most checking and savings account complaints to the CFPB from July 2025 through June 2026, 9,708 of 83,975, according to CFPB data.
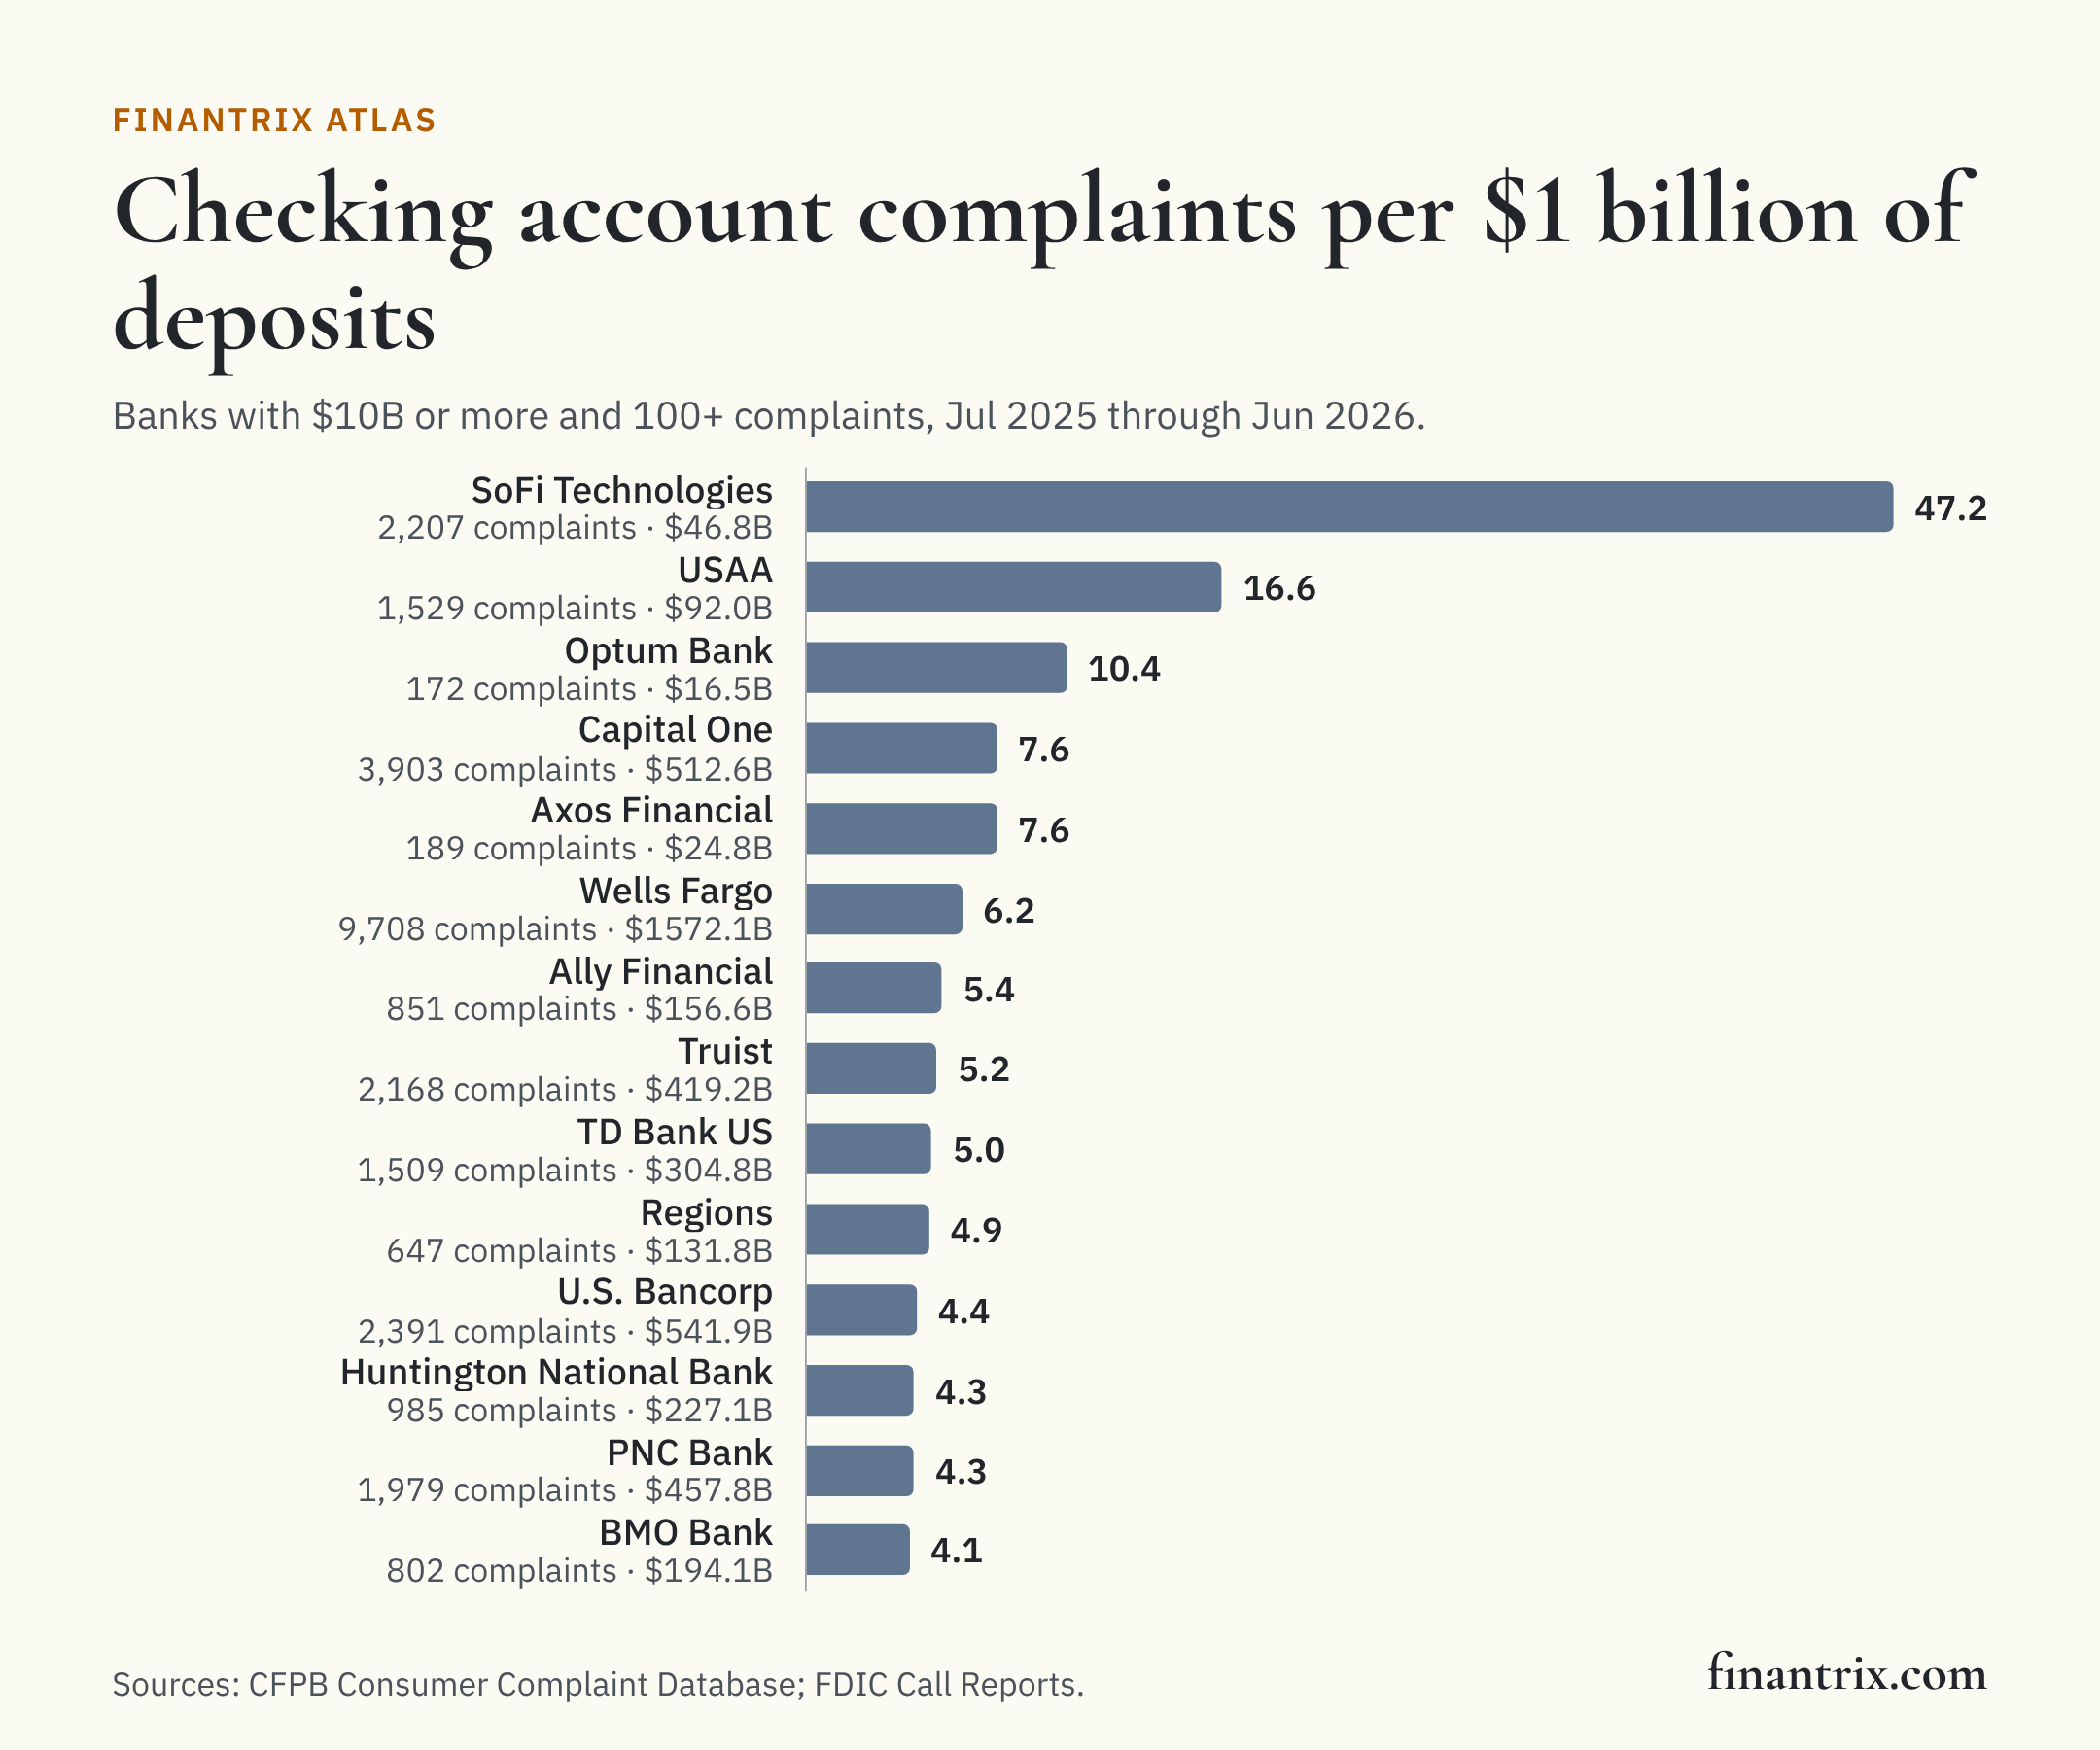
- Among banks with $10 billion or more of deposits, SoFi Technologies drew 47.2 complaints per billion dollars and Charles Schwab 1.2, by FDIC Call Report figures.
- Banks drew 67% of checking and savings account complaints; the rest were filed against credit unions, payment companies and others with no FDIC figure.
- The CFPB says complaints are not a representative sample; a rate per dollar of deposits adjusts for size, not for how many customers complain.
Wells Fargo drew more checking and savings account complaints to the Consumer Financial Protection Bureau than any other company from July 2025 through June 2026, 9,708 of 83,975, according to CFPB data, followed by JPMorgan Chase and Bank of America. Relative to their deposits, the 28 banks with $10 billion or more and at least 100 complaints differ by a factor of 41: SoFi Technologies drew 47.2 complaints per billion dollars of deposits and Charles Schwab 1.2.
A count says how many consumers complained; it does not say how many customers a bank has. According to the CFPB, its complaints are not a statistical sample, and complaint volume should be read against a company's size. The FDIC publishes every bank's deposits, so this page gives each bank a rate. Credit unions, payment companies and others file no FDIC report and are shown as counts.
The 30 companies with the most checking and savings account complaints
Ranked by complaints received July 2025 through June 2026, by the company the CFPB filed each against. A bank appears once, at its FDIC holding company, with every filed name that matched it. The rate is given where the bank holds $1 billion or more of deposits; a company with no FDIC figure is one its filed name did not match to an FDIC-insured bank.
| Rank | Company | Complaints | Share | FDIC-reported deposits | Complaints per $1B of deposits | Leading issue | Sources |
|---|---|---|---|---|---|---|---|
| 1 | Wells Fargo | 9,708 | 11.6% | $1.57 trillion | 6.2 | Managing an account | CFPB, FDIC FDIC FDIC |
| 2 | JPMorgan Chase | 9,556 | 11.4% | $2.82 trillion | 3.4 | Managing an account | CFPB, FDIC FDIC |
| 3 | Bank of America | 8,321 | 9.9% | $2.13 trillion | 3.9 | Managing an account | CFPB, FDIC FDIC |
| 4 | Chime | 7,477 | 8.9% | No FDIC-insured bank matched | – | Managing an account | CFPB |
| 5 | Capital One | 3,903 | 4.6% | $513 billion | 7.6 | Managing an account | CFPB, FDIC |
| 6 | Block | 3,737 | 4.5% | No FDIC-insured bank matched | – | Managing an account | CFPB |
| 7 | Citibank | 3,640 | 4.3% | $1.55 trillion | 2.4 | Managing an account | CFPB, FDIC |
| 8 | Navy Federal Credit Union | 3,279 | 3.9% | Credit union; reports to the NCUA, not the FDIC | – | Managing an account | CFPB |
| 9 | U.S. Bancorp | 2,391 | 2.8% | $542 billion | 4.4 | Managing an account | CFPB, FDIC |
| 10 | SoFi Technologies | 2,207 | 2.6% | $46.8 billion | 47.2 | Managing an account | CFPB, FDIC |
| 11 | Truist | 2,168 | 2.6% | $419 billion | 5.2 | Managing an account | CFPB, FDIC |
| 12 | PNC Bank | 1,979 | 2.4% | $458 billion | 4.3 | Managing an account | CFPB, FDIC |
| 13 | USAA | 1,529 | 1.8% | $92.0 billion | 16.6 | Managing an account | CFPB, FDIC |
| 14 | TD Bank US | 1,509 | 1.8% | $305 billion | 5.0 | Managing an account | CFPB, FDIC FDIC |
| 15 | PayPal | 1,452 | 1.7% | No FDIC-insured bank matched | – | Managing an account | CFPB |
| 16 | Citizens Financial Group | 1,089 | 1.3% | No FDIC-insured bank matched | – | Managing an account | CFPB |
| 17 | Huntington National Bank | 985 | 1.2% | $227 billion | 4.3 | Managing an account | CFPB, FDIC |
| 18 | Ally Financial | 851 | 1.0% | $157 billion | 5.4 | Managing an account | CFPB, FDIC |
| 19 | BMO Bank | 802 | 1.0% | $194 billion | 4.1 | Managing an account | CFPB, FDIC FDIC |
| 20 | Early Warning Services | 766 | 0.9% | No FDIC-insured bank matched | – | Opening an account | CFPB |
| 21 | Fidelity National Information Services | 725 | 0.9% | No FDIC-insured bank matched | – | CFPB | |
| 22 | Fifth Third | 715 | 0.9% | $241 billion | 3.0 | CFPB, FDIC | |
| 23 | Regions | 647 | 0.8% | $132 billion | 4.9 | CFPB, FDIC | |
| 24 | Goldman Sachs Bank USA | 635 | 0.8% | $499 billion | 1.3 | CFPB, FDIC | |
| 25 | Current (FinCo Services) | 631 | 0.8% | No FDIC-insured bank matched | – | CFPB | |
| 26 | Santander Holdings USA | 600 | 0.7% | No FDIC-insured bank matched | – | CFPB | |
| 27 | Netspend | 560 | 0.7% | No FDIC-insured bank matched | – | CFPB | |
| 28 | American Express | 536 | 0.6% | $172 billion | 3.1 | CFPB, FDIC | |
| 29 | KeyCorp | 530 | 0.6% | $158 billion | 3.3 | CFPB, FDIC | |
| 30 | Robinhood Markets | 440 | 0.5% | No FDIC-insured bank matched | – | CFPB |
Download this table (CSV), free. The full dataset, every company with a checking or savings account complaint in the window, with its match to the FDIC and the bank's deposits, is one email away.
Complaints per billion dollars of deposits
Banks with $10 billion or more of deposits on June 30, 2026 that drew 100 or more complaints in the window, by complaints per billion dollars; a rate on fewer complaints says little. Banks drew 67% of all checking and savings account complaints.
| Bank | Complaints | Deposits | Complaints per $1B | FDIC-insured banks |
|---|---|---|---|---|
| SoFi Technologies | 2,207 | $46.8 billion | 47.2 | SoFi Bank |
| USAA | 1,529 | $92.0 billion | 16.6 | USAA Federal Savings Bank |
| Optum Bank | 172 | $16.5 billion | 10.4 | Optum Bank, Inc. |
| Capital One | 3,903 | $513 billion | 7.6 | Capital One |
| Axos Financial | 189 | $24.8 billion | 7.6 | Axos Bank |
| Wells Fargo | 9,708 | $1.57 trillion | 6.2 | Wells Fargo Bank; Wells Fargo National Bank West; Wells Fargo Bank South Central |
| Ally Financial | 851 | $157 billion | 5.4 | Ally Bank |
| Truist | 2,168 | $419 billion | 5.2 | Truist Bank |
| TD Bank US | 1,509 | $305 billion | 5.0 | TD Bank; TD Bank USA |
| Regions | 647 | $132 billion | 4.9 | Regions Bank |
| U.S. Bancorp | 2,391 | $542 billion | 4.4 | U.S. Bank |
| Huntington National Bank | 985 | $227 billion | 4.3 | The Huntington National Bank |
| PNC Bank | 1,979 | $458 billion | 4.3 | PNC Bank |
| BMO Bank | 802 | $194 billion | 4.1 | BMO Bank; BMO Harris Central |
| Bank of America | 8,321 | $2.13 trillion | 3.9 | Bank of America; Bank of America California |
| JPMorgan Chase | 9,556 | $2.82 trillion | 3.4 | JPMorgan Chase Bank; JPMorgan Chase Bank, Dearborn |
| KeyCorp | 530 | $158 billion | 3.3 | KeyBank |
| American Express | 536 | $172 billion | 3.1 | American Express National Bank |
| Synchrony | 265 | $86.0 billion | 3.1 | Synchrony Bank |
| Barclays Bank Delaware | 108 | $35.3 billion | 3.1 | Barclays Bank Delaware |
| Fifth Third | 715 | $241 billion | 3.0 | Fifth Third Bank |
| Cullen/Frost Bankers | 117 | $43.7 billion | 2.7 | Frost Bank |
| Webster Bank | 188 | $70.7 billion | 2.7 | Webster Bank |
| M&T Bank | 436 | $172 billion | 2.5 | Manufacturers and Traders Trust Company; Wilmington Trust |
| Citibank | 3,640 | $1.55 trillion | 2.4 | Citibank |
| First Horizon Bank | 131 | $68.8 billion | 1.9 | First Horizon Bank |
| Goldman Sachs Bank USA | 635 | $499 billion | 1.3 | Goldman Sachs Bank USA |
| Charles Schwab | 299 | $259 billion | 1.2 | Charles Schwab Bank, SSB; Charles Schwab Premier Bank, SSB; Charles Schwab Trust Bank |
What this means for technology buyers
Account complaints are about the everyday work of a deposit account: opening and closing it, fees, transactions and the funds a bank holds or releases. These guides compare the options side by side:
- Deposit management platforms: account products, fees and servicing.
- Core banking systems: where accounts and transactions are held.
- Mobile banking apps: where customers see and dispute what happened.
Mapping the business? The Banking and Payments Capability Matrix covers deposit products and servicing alongside the rest of a bank.
More from Finantrix Atlas
- US banks by deposit service charges
- Credit card issuers by consumer complaints
- Companies with the most consumer complaints
- Largest banks in the US
How this list was built
Complaints are every complaint in the CFPB's Consumer Complaint Database with the product "Checking or savings account" and a date received from July 2025 through June 2026, four full quarters ending on the latest quarter the FDIC has published, by the company the CFPB filed it against. Every breakdown adds up to the API's own total. The size measure is total deposits as each bank reports them on its Call Report (the FDIC's DEP field), consumer and business alike, for June 30, 2026, the quarter the window ends on.
The CFPB files most large banks under the holding company and the FDIC reports by charter, so both are counted at the holding company the FDIC records. A filed name is matched when, reduced to its words, it equals exactly one bank's name or one holding company's name, or appears in a short list of recorded aliases whose FDIC names are re-read on every build; banks under one holding company are then one bank. Matched banks hold 74% of the $20.88 trillion of deposits FDIC-insured banks report.
Limits
- Complaints are what consumers report, not a sample. According to the CFPB, a complaint is published once the company responds or after 15 days, complaints are not "information" for the purposes of the Information Quality Act, and the database is not representative of all consumers' experiences.
- Deposits are not all consumer deposits. The FDIC figure includes business, government and brokered deposits, so a bank with a large business book has a rate that understates complaints per consumer account.
- Some banks are missing. The CFPB does not publish complaints it refers to other regulators, such as complaints about depository institutions with less than $10 billion in assets.
- One window. Complaints received July 2025 through June 2026, read on November 19, 2026; FDIC figures for June 30, 2026.
Cite this
Free to quote, cite and republish, including the chart, with credit to Finantrix Atlas and a link to this page.
Wells Fargo drew 9,708 checking and savings account complaints to the CFPB from July 2025 through June 2026, the most of any company, according to a Finantrix Atlas analysis of CFPB data.
Suggested citation: Finantrix Atlas, "Banks by Checking Account Complaints," complaints received July 2025 through June 2026, from the CFPB Consumer Complaint Database and FDIC Call Reports. https://www.finantrix.com/articles/banks-by-checking-account-complaints
Embed the chart:
<a href="https://www.finantrix.com/articles/banks-by-checking-account-complaints"><img src="https://www.finantrix.com/atlas/banks-by-checking-account-complaints.png?v=2026-06-30" alt="Checking account complaints per billion dollars of deposits, from Finantrix Atlas"></a>
<p>Chart: <a href="https://www.finantrix.com/articles/banks-by-checking-account-complaints">Finantrix Atlas</a>, from CFPB and FDIC data.</p>
Frequently asked questions
Q: Which bank has the most checking account complaints? A: Wells Fargo, with 9,708 checking and savings account complaints received July 2025 through June 2026, according to CFPB data. The CFPB says counts should be read against a company's size.
Q: Which large bank has the most complaints relative to its deposits? A: SoFi Technologies, with 47.2 checking and savings complaints per billion dollars of deposits, among banks with $10 billion or more, by CFPB and FDIC data.
Download the data
Two CSV files, free: the 30 rows on this page, and the full dataset of all 501 rows, as of June 30, 2026.
Frequently Asked Questions
Which bank has the most checking account complaints?
Wells Fargo, with 9,708 checking and savings account complaints received July 2025 through June 2026, according to CFPB data. The CFPB says counts should be read against a company's size.
Which large bank has the most complaints relative to its deposits?
SoFi Technologies, with 47.2 checking and savings complaints per billion dollars of deposits, among banks with $10 billion or more, by CFPB and FDIC data.