
Key Takeaways
- The median FDIC-insured US bank with $1 billion or more in assets reported a net interest margin of 3.68% for the first half of 2026: a yield on earning assets of 5.53% less a cost of funds of 1.90%, according to FDIC data.
- Square Financial Services, Inc. reports the highest margin of the 1,048 banks of that size, 42.73%; 9 of the 50 highest hold more than half their loans in credit cards.
- Among banks of that size funded mostly by deposits, Charles Schwab Premier Bank, SSB reports the lowest cost of funds, 0.05%, according to FDIC data.
- Every margin on the page is the FDIC's own, and each equals the bank's yield less its cost of funds.
The median FDIC-insured US bank with $1 billion or more in assets reported a net interest margin of 3.68% for the first half of 2026, according to FDIC Call Report data: a yield on earning assets of 5.53% less a cost of funds of 1.90%. Square Financial Services, Inc. reports the highest margin of the 1,048 banks of that size, 42.73%, followed by Credit One Bank at 24.80% and Comenity Bank at 21.93%. Comenity Bank has since closed, according to the FDIC; the figures are from its Call Report for June 30, 2026.
Net interest margin is what a bank earns on its loans and securities less what it pays for deposits and borrowing, as a share of the assets that earn interest. The highest margins belong to banks that lend at high rates, such as on credit cards and other consumer loans: 9 of the 50 highest hold more than half of their loans in cards. A high margin pays for the losses and costs that come with that lending, which the margin itself does not show.
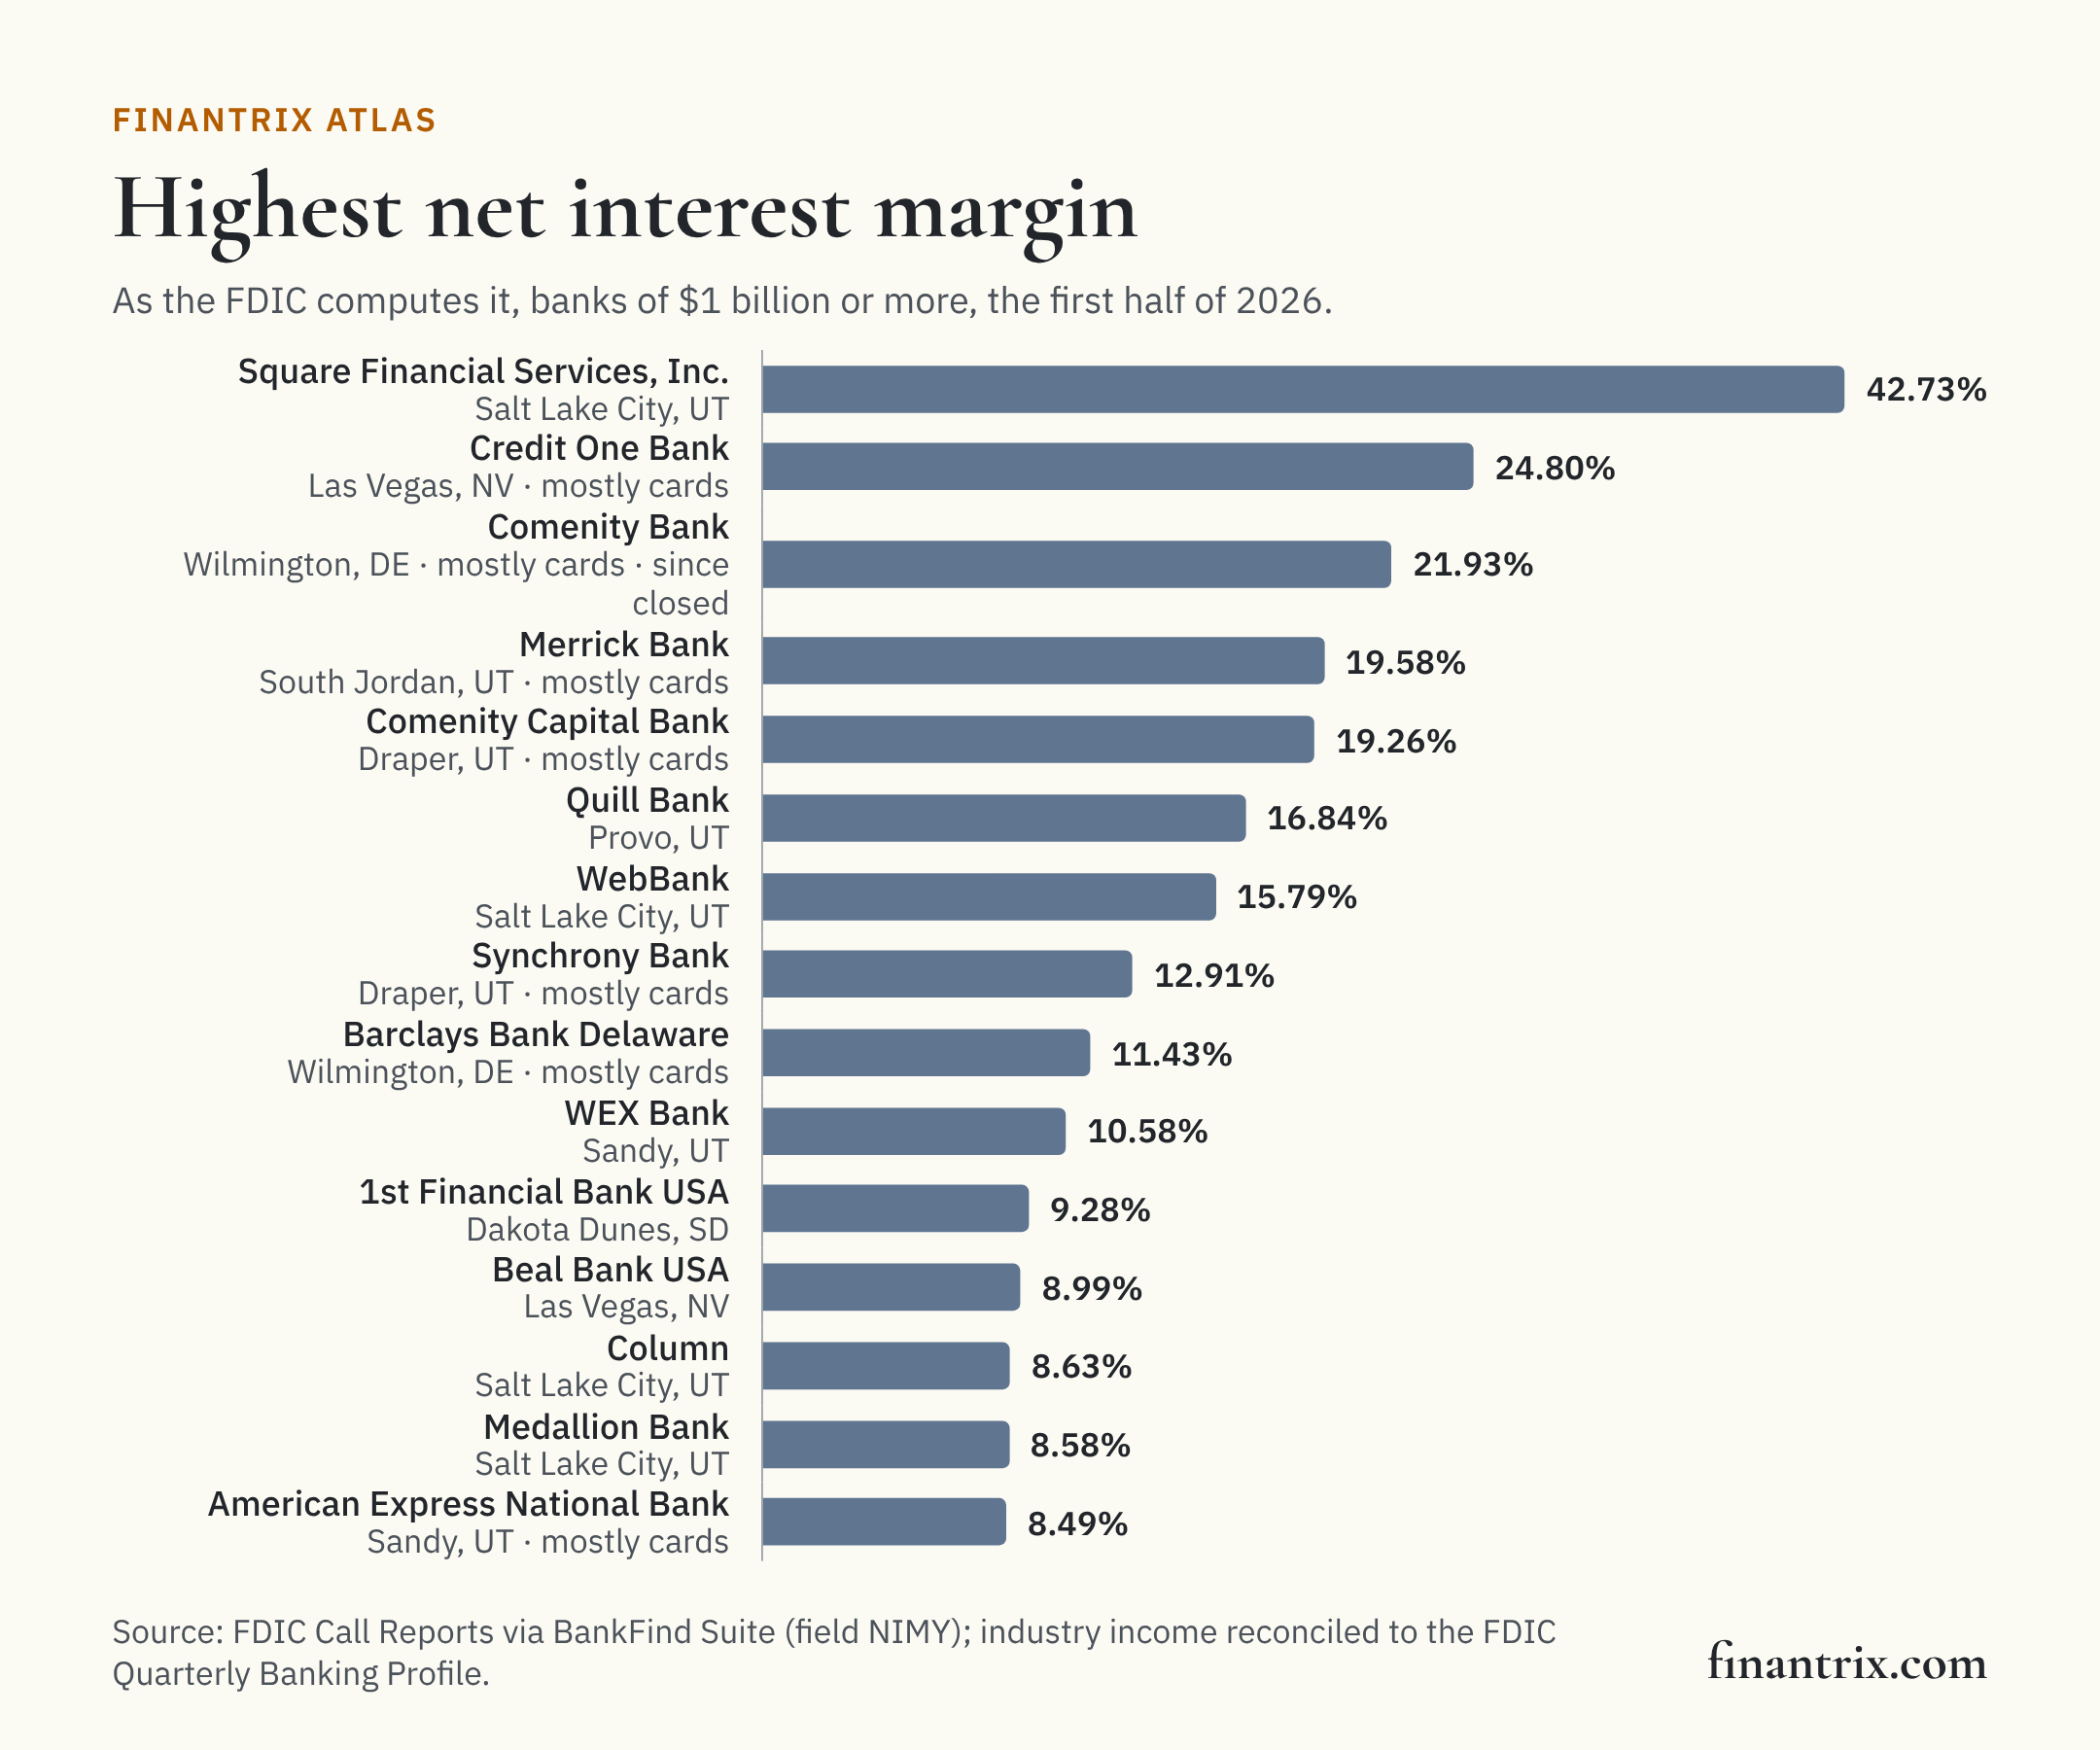
The 50 banks with the highest net interest margin
Ranked by net interest margin, as the FDIC computes it, for the first half of 2026, among banks with $1 billion or more in assets. Each row is one bank charter, with the yield and cost of funds the margin is made of and the share of its loans in credit cards. The margin needed to make this list is 5.24% or higher.
| Rank | Bank | Headquarters | Net interest margin | Yield on earning assets | Cost of funds | Credit cards, share of loans | Total assets | Source |
|---|---|---|---|---|---|---|---|---|
| 1 | Square Financial Services, Inc. | Salt Lake City, UT | 42.73% | 43.08% | 0.34% | 0.0% | $2.1 billion | FDIC |
| 2 | Credit One Bank | Las Vegas, NV | 24.80% | 27.45% | 2.66% | 100.0% | $2.4 billion | FDIC |
| 3 | Comenity Bank ‡ | Wilmington, DE | 21.93% | 26.02% | 4.09% | 100.0% | $7.4 billion | FDIC |
| 4 | Merrick Bank | South Jordan, UT | 19.58% | 22.78% | 3.20% | 72.4% | $9.1 billion | FDIC |
| 5 | Comenity Capital Bank | Draper, UT | 19.26% | 22.81% | 3.55% | 94.2% | $13.9 billion | FDIC |
| 6 | Quill Bank | Provo, UT | 16.84% | 19.77% | 2.92% | 0.0% | $1.6 billion | FDIC |
| 7 | WebBank | Salt Lake City, UT | 15.79% | 18.72% | 2.93% | 7.8% | $2.9 billion | FDIC |
| 8 | Synchrony Bank | Draper, UT | 12.91% | 16.26% | 3.35% | 91.9% | $115 billion | FDIC |
| 9 | Barclays Bank Delaware | Wilmington, DE | 11.43% | 14.82% | 3.39% | 95.4% | $43.5 billion | FDIC |
| 10 | WEX Bank | Sandy, UT | 10.58% | 13.51% | 2.93% | 0.0% | $10.7 billion | FDIC |
| 11 | 1st Financial Bank USA | Dakota Dunes, SD | 9.28% | 13.01% | 3.73% | 35.0% | $1.4 billion | FDIC |
| 12 | Beal Bank USA | Las Vegas, NV | 8.99% | 11.51% | 2.52% | 0.0% | $11.0 billion | FDIC |
| 13 | Column | Salt Lake City, UT | 8.63% | 11.92% | 3.29% | 28.7% | $1.8 billion | FDIC |
| 14 | Medallion Bank | Salt Lake City, UT | 8.58% | 11.85% | 3.27% | 0.0% | $2.8 billion | FDIC |
| 15 | American Express National Bank | Sandy, UT | 8.49% | 11.54% | 3.05% | 65.8% | $214 billion | FDIC |
| 16 | Capital One | McLean, VA | 8.47% | 11.17% | 2.70% | 54.8% | $662 billion | FDIC |
| 17 | First Savings Bank | Beresford, SD | 8.18% | 9.32% | 1.14% | 13.8% | $1.6 billion | FDIC |
| 18 | Lead Bank | Kansas City, MO | 7.93% | 8.86% | 0.92% | 25.9% | $2.8 billion | FDIC |
| 19 | Ixonia Bank | Ixonia, WI | 7.60% | 10.06% | 2.46% | 0.0% | $1.1 billion | FDIC |
| 20 | First National Bank | Fort Pierre, SD | 7.53% | 8.90% | 1.36% | 11.8% | $2.0 billion | FDIC |
| 21 | Pathward | Sioux Falls, SD | 7.41% | 7.59% | 0.17% | 0.0% | $7.3 billion | FDIC |
| 22 | Gulf Coast Bank and Trust Company | New Orleans, LA | 7.03% | 9.12% | 2.09% | 0.1% | $3.9 billion | FDIC |
| 23 | Coastal Community Bank | Everett, WA | 7.02% | 9.33% | 2.30% | 19.7% | $5.5 billion | FDIC |
| 24 | First National Bank of Omaha | Omaha, NE | 6.63% | 8.57% | 1.94% | 31.8% | $34.2 billion | FDIC |
| 25 | Transportation Alliance Bank, Inc. d/b/a TAB Bank | Ogden, UT | 6.60% | 9.75% | 3.15% | 2.6% | $1.6 billion | FDIC |
| 26 | TD Bank USA | Wilmington, DE | 6.39% | 9.73% | 3.34% | 97.8% | $32.1 billion | FDIC |
| 27 | Happen Bank | Lehi, UT | 6.30% | 9.41% | 3.11% | 0.0% | $12.5 billion | FDIC |
| 28 | TBK BANK, SSB | Dallas, TX | 6.25% | 7.55% | 1.30% | 0.0% | $7.4 billion | FDIC |
| 29 | Green Dot Bank DBA Bonneville Bank | Provo, UT | 6.17% | 6.40% | 0.23% | 21.5% | $5.4 billion | FDIC |
| 30 | Anderson Brothers Bank | Mullins, SC | 6.12% | 8.01% | 1.89% | 0.0% | $2.4 billion | FDIC |
| 31 | John Deere Financial, f.s.b. | Middleton, WI | 6.11% | 9.63% | 3.51% | 11.7% | $4.9 billion | FDIC |
| 32 | SoFi Bank | Cottonwood Heigh, UT | 6.07% | 8.72% | 2.64% | 1.1% | $56.8 billion | FDIC |
| 33 | Esquire Bank | Jericho, NY | 6.06% | 6.98% | 0.92% | 0.0% | $2.5 billion | FDIC |
| 34 | Celtic Bank | Salt Lake City, UT | 6.05% | 9.05% | 3.00% | 0.0% | $5.3 billion | FDIC |
| 35 | Stearns Bank | Saint Cloud, MN | 6.04% | 8.70% | 2.66% | 0.0% | $3.3 billion | FDIC |
| 36 | Sutton Bank | Attica, OH | 5.72% | 5.99% | 0.27% | 0.3% | $1.7 billion | FDIC |
| 37 | Capital Bank | Rockville, MD | 5.64% | 7.78% | 2.14% | 4.6% | $3.8 billion | FDIC |
| 38 | Northrim Bank | Anchorage, AK | 5.59% | 6.76% | 1.16% | 0.0% | $3.4 billion | FDIC |
| 39 | The Bancorp Bank | Sioux Falls, SD | 5.49% | 5.75% | 0.26% | 4.7% | $9.2 billion | FDIC |
| 40 | Sallie Mae Bank | Salt Lake City, UT | 5.48% | 9.35% | 3.87% | 0.0% | $28.5 billion | FDIC |
| 41 | Oriental Bank | San Juan, PR | 5.46% | 6.83% | 1.37% | 0.4% | $12.0 billion | FDIC |
| 42 | Citizens National Bank of Texas | Waxahachie, TX | 5.39% | 6.93% | 1.54% | 0.0% | $2.2 billion | FDIC |
| 43 | Great Plains National Bank | Elk City, OK | 5.35% | 7.57% | 2.23% | 0.0% | $1.9 billion | FDIC |
| 44 | State Bank of Texas | Irving, TX | 5.33% | 8.64% | 3.31% | 0.0% | $2.6 billion | FDIC |
| 45 | Western State Bank | Devils Lake, ND | 5.33% | 7.60% | 2.27% | 0.0% | $2.5 billion | FDIC |
| 46 | USAA Federal Savings Bank | Phoenix, AZ | 5.30% | 5.76% | 0.46% | 40.3% | $106 billion | FDIC |
| 47 | Apex Bank | Camden, TN | 5.26% | 7.55% | 2.29% | 0.0% | $1.5 billion | FDIC |
| 48 | Old Second National Bank | Aurora, IL | 5.26% | 6.31% | 1.05% | 0.0% | $6.9 billion | FDIC |
| 49 | Austin Bank, Texas | Jacksonville, TX | 5.25% | 6.47% | 1.22% | 0.0% | $3.3 billion | FDIC |
| 50 | Republic Bank & Trust Company | Louisville, KY | 5.24% | 6.58% | 1.35% | 0.0% | $7.1 billion | FDIC |
‡ Closed after June 30, 2026: Comenity Bank (Wilmington, DE) on October 1, 2026. The FDIC records the end of the charter; the figures shown are those it reported for June 30, 2026.
Download this table (CSV), free. The full dataset, every bank of $1 billion or more with its margin, yield, cost of funds, deposits and identifiers, is one email away.
The lowest cost of funds
The banks of $1 billion or more that pay the least for their funding, among the 962 funded mostly by deposits, with deposits of at least 75% of assets. Charles Schwab Premier Bank, SSB reports 0.05%, followed by Chain Bridge Bank at 0.13%. Cost of funds is interest paid on deposits and borrowing as a share of earning assets, so a bank with many deposits that pay no interest has a low one.
| Rank | Bank | Headquarters | Cost of funds | Net interest margin | Deposits |
|---|---|---|---|---|---|
| 1 | Charles Schwab Premier Bank, SSB | Westlake, TX | 0.05% | 2.44% | $24.5 billion |
| 2 | Chain Bridge Bank | McLean, VA | 0.13% | 3.34% | $2.0 billion |
| 3 | Stride Bank | Enid, OK | 0.17% | 2.95% | $5.0 billion |
| 4 | Pathward | Sioux Falls, SD | 0.17% | 7.41% | $6.0 billion |
| 5 | Ameriprise Bank, FSB | Minneapolis, MN | 0.18% | 4.44% | $23.9 billion |
| 6 | First National Bank and Trust Company of Newtown | Newtown, PA | 0.22% | 3.43% | $1.0 billion |
| 7 | Green Dot Bank DBA Bonneville Bank | Provo, UT | 0.23% | 6.17% | $5.0 billion |
| 8 | Westamerica Bank | San Rafael, CA | 0.25% | 3.86% | $4.8 billion |
| 9 | Charles Schwab Trust Bank | Westlake, TX | 0.25% | 2.48% | $9.7 billion |
| 10 | The Bancorp Bank | Sioux Falls, SD | 0.26% | 5.49% | $7.5 billion |
| 11 | Sutton Bank | Attica, OH | 0.27% | 5.72% | $1.5 billion |
| 12 | First Command Bank | Fort Worth, TX | 0.27% | 3.59% | $966 million |
| 13 | Charles Schwab Bank, SSB | Westlake, TX | 0.34% | 2.14% | $225 billion |
| 14 | Erebor Bank | Columbus, OH | 0.44% | 0.71% | $4.1 billion |
| 15 | RBC Bank, (Georgia) | Atlanta, GA | 0.46% | 4.04% | $8.5 billion |
What this means for technology buyers
A margin is set account by account: the rate on each deposit product, the price of each loan, and how quickly either changes when rates move. The systems that hold those prices decide how quickly a bank can change them. These guides compare the options side by side:
- Deposit management platforms for retail banks: product configuration, pricing and the account lifecycle.
- Cloud-based core banking systems: the ledger and product engine that apply each rate.
- Financial BI and dashboarding for bank executives: measuring margin by product and line.
Planning the change before choosing the vendor? The Banking and Payments Capability Matrix states what a bank does, from taking deposits to originating credit, so a platform can be placed against the capabilities it supports.
More from Finantrix Atlas
- Most profitable US banks by return on assets
- Most efficient US banks by efficiency ratio
- Largest credit card issuing banks
- US banks by uninsured deposits
How this list was built
The population is every FDIC-insured commercial bank and savings institution that filed a Call Report for June 30, 2026 with $1 billion or more in total assets, read from the FDIC's BankFind Suite, including banks whose charter has ended since. Banks are ranked by the FDIC field NIMY, which the FDIC's field definitions describe as total interest income less total interest expense, annualized, as a percent of average earning assets. The yield (INTINCY) and the cost of funds (INTEXPY) are the FDIC's fields on the same basis, and every bank's margin equals its yield less its cost of funds. Nothing on this page recomputes them.
The FDIC's Quarterly Banking Profile, the edition for the second quarter of 2026, prints the industry's income statement for the quarter. Summed across the same 4,238 institutions, the banks' net interest income for the quarter equals it to the million dollars, and their assets, deposits and credit card loans equal its balance sheet.
Limits
- A margin, not a profit. It is earned before credit losses, overhead and taxes. A bank lending at high rates can have a high margin and high losses.
- Business models differ. Card lenders, banks that hold mostly securities and banks with few interest-bearing accounts sit at the extremes for reasons of business mix.
- Year to date, annualized. The figures cover the first half of 2026. Averages are over the reporting periods in the year so far, so a bank that grew or shrank quickly can show an unusual ratio.
- Banks of $1 billion or more, the floor the other Finantrix Atlas ratio pages use.
- Banks, not holding companies. A group with several charters appears once per charter.
Cite this
Free to quote, cite and republish, including the chart, with credit to Finantrix Atlas and a link to this page.
The median FDIC-insured US bank with $1 billion or more in assets reported a net interest margin of 3.68% for the first half of 2026, according to a Finantrix Atlas analysis of FDIC data.
Suggested citation: Finantrix Atlas, "US Banks by Net Interest Margin," data for the first half of 2026, from FDIC Call Reports. https://www.finantrix.com/articles/banks-net-interest-margin
Embed the chart:
<a href="https://www.finantrix.com/articles/banks-net-interest-margin"><img src="https://www.finantrix.com/atlas/banks-net-interest-margin.png?v=2026-06-30" alt="The US banks with the highest net interest margin, from FDIC data, by Finantrix Atlas"></a>
<p>Chart: <a href="https://www.finantrix.com/articles/banks-net-interest-margin">Finantrix Atlas</a>, from FDIC Call Reports.</p>
Frequently asked questions
Q: What is a typical bank net interest margin? A: The median FDIC-insured bank with $1 billion or more in assets reported 3.68% for the first half of 2026, according to FDIC data.
Q: Which US bank has the highest net interest margin? A: Among banks with $1 billion or more in assets, Square Financial Services, Inc., at 42.73% for the first half of 2026, according to FDIC data.
Q: What is a bank's cost of funds? A: The interest it pays on deposits and borrowed money, as a share of the assets that earn interest. The median bank with $1 billion or more in assets reported 1.90% for the first half of 2026, according to FDIC data.
Download the data
Two CSV files, free: the 50 rows on this page, and the full dataset of all 1,048 rows, as of June 30, 2026.
Frequently Asked Questions
What is a typical bank net interest margin?
The median FDIC-insured bank with $1 billion or more in assets reported 3.68% for the first half of 2026, according to FDIC data.
Which US bank has the highest net interest margin?
Among banks with $1 billion or more in assets, Square Financial Services, Inc., at 42.73% for the first half of 2026, according to FDIC data.
What is a bank's cost of funds?
The interest it pays on deposits and borrowed money, as a share of the assets that earn interest. The median bank with $1 billion or more in assets reported 1.90% for the first half of 2026, according to FDIC data.