
Key Takeaways
- FDIC-insured US banks held $327 billion in net unrealized losses on their debt securities on June 30, 2026, 66% of it on securities held to maturity, according to FDIC data.
- 89 of the 1,048 banks with $1 billion or more in assets carry net unrealized losses larger than a quarter of their tier 1 capital, according to FDIC Call Report data.
- Union County Savings Bank reports the largest loss relative to tier 1 capital, 150.2%; in dollars, Bank of America reports the largest, $84.2 billion, according to FDIC data.
- The banks' securities at amortized cost and fair value add up to the FDIC's own Quarterly Banking Profile totals for the quarter, to the million dollars.
FDIC-insured US banks held $327 billion in net unrealized losses on their debt securities on June 30, 2026, according to FDIC data, and 66% of it was on securities held to maturity. Among the 1,048 banks with $1 billion or more in assets, 89 carry net unrealized losses larger than a quarter of their tier 1 capital, and 10 carry losses larger than half of it. Union County Savings Bank reports the largest relative to its capital, 150.2%, followed by CB&S Bank, Inc. at 72.7% and Independence Bank of Kentucky at 72.3%.
An unrealized loss is the gap between what a bank paid for a bond, adjusted over its life, and what the bond is worth today. It becomes a realized loss if the bank sells the bond below that cost.
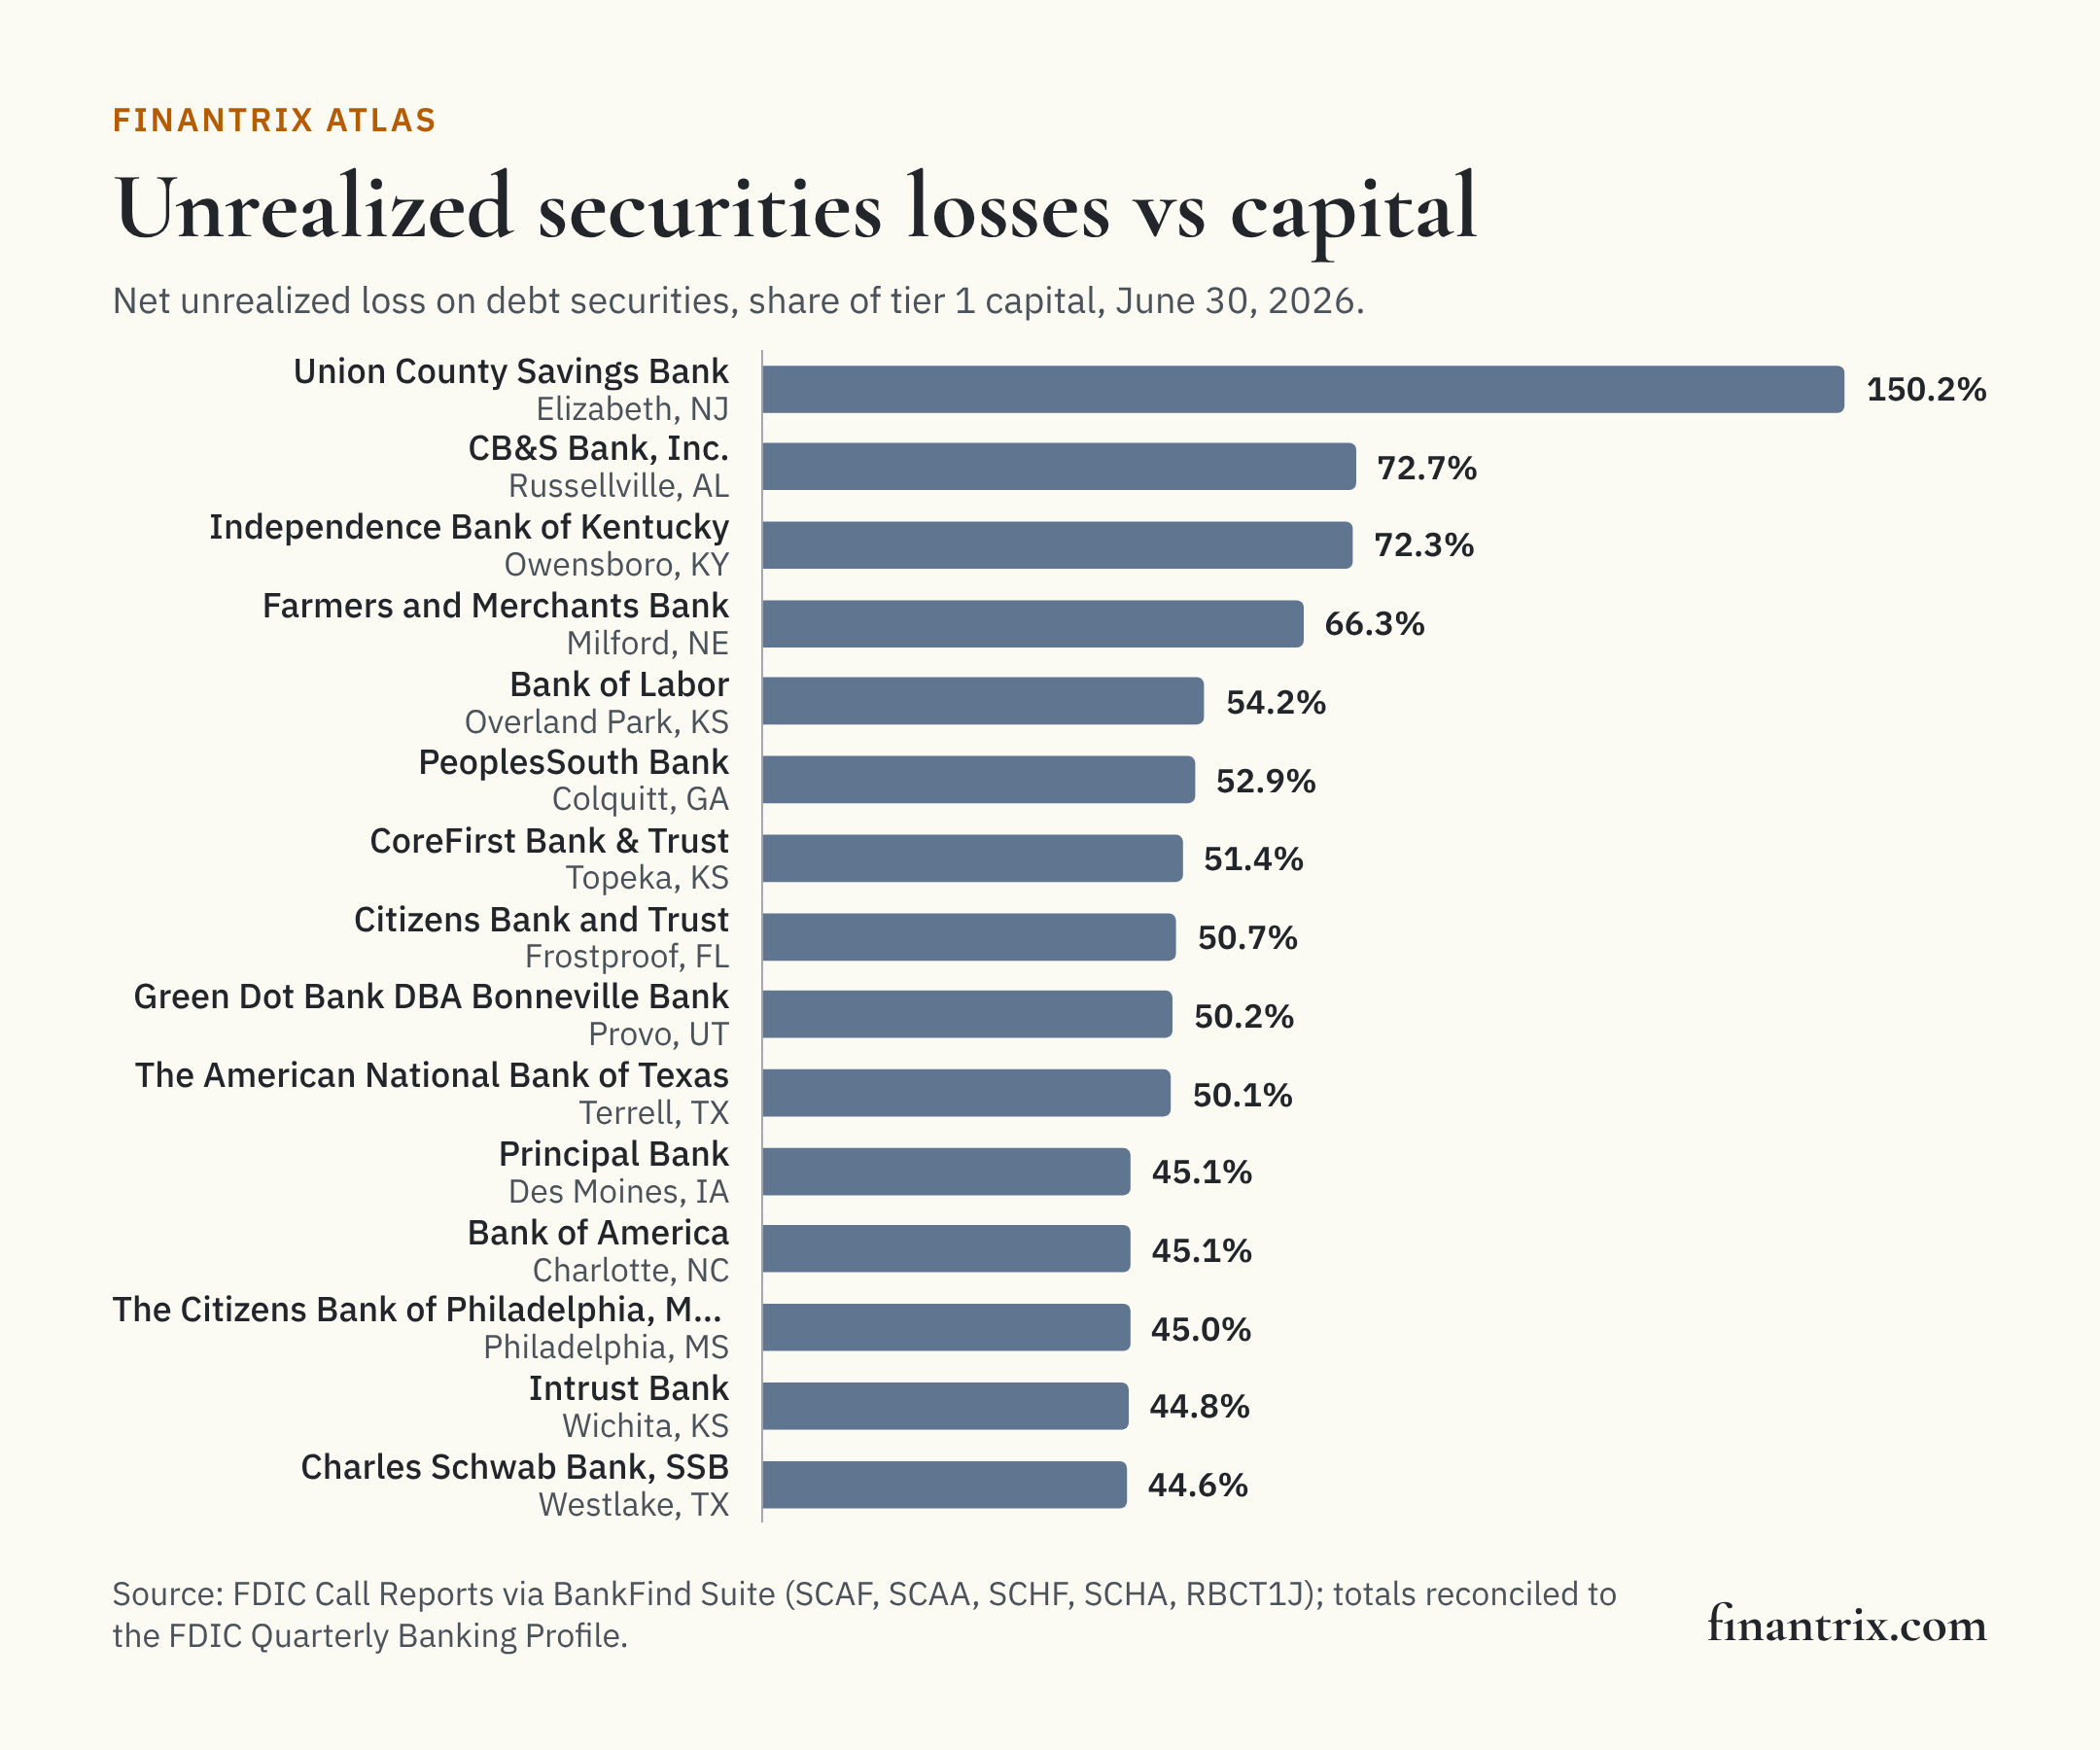
The 50 banks with the largest unrealized losses relative to capital
Ranked by net unrealized loss on available-for-sale and held-to-maturity debt securities, as a share of tier 1 capital, on June 30, 2026. Each row is one bank charter. The share needed to make this list is 30.1%.
| Rank | Bank | Headquarters | Net unrealized loss, share of tier 1 capital | Net unrealized loss | Available for sale | Held to maturity | Tier 1 capital | Source |
|---|---|---|---|---|---|---|---|---|
| 1 | Union County Savings Bank | Elizabeth, NJ | 150.2% | $196 million | $196 million | – | $130 million | FDIC |
| 2 | CB&S Bank, Inc. | Russellville, AL | 72.7% | $241 million | $241 million | – | $331 million | FDIC |
| 3 | Independence Bank of Kentucky | Owensboro, KY | 72.3% | $254 million | $30 million | $224 million | $351 million | FDIC |
| 4 | Farmers and Merchants Bank | Milford, NE | 66.3% | $72 million | $72 million | – | $109 million | FDIC |
| 5 | Bank of Labor | Overland Park, KS | 54.2% | $47 million | $47 million | $132,000 | $87 million | FDIC |
| 6 | PeoplesSouth Bank | Colquitt, GA | 52.9% | $69 million | $69 million | $4,000 | $131 million | FDIC |
| 7 | CoreFirst Bank & Trust | Topeka, KS | 51.4% | $57 million | $36 million | $21 million | $111 million | FDIC |
| 8 | Citizens Bank and Trust | Frostproof, FL | 50.7% | $62 million | $62 million | – | $123 million | FDIC |
| 9 | Green Dot Bank DBA Bonneville Bank | Provo, UT | 50.2% | $248 million | $248 million | – | $494 million | FDIC |
| 10 | The American National Bank of Texas | Terrell, TX | 50.1% | $253 million | $253 million | – | $504 million | FDIC |
| 11 | Principal Bank | Des Moines, IA | 45.1% | $326 million | $326 million | – | $722 million | FDIC |
| 12 | Bank of America | Charlotte, NC | 45.1% | $84.2 billion | $2.1 billion | $82.1 billion | $187 billion | FDIC |
| 13 | The Citizens Bank of Philadelphia, Mississippi | Philadelphia, MS | 45.0% | $62 million | $32 million | $31 million | $138 million | FDIC |
| 14 | Intrust Bank | Wichita, KS | 44.8% | $343 million | $343 million | – | $764 million | FDIC |
| 15 | Charles Schwab Bank, SSB | Westlake, TX | 44.6% | $12.1 billion | $3.6 billion | $8.5 billion | $27.1 billion | FDIC |
| 16 | Horizon Bank, SSB | Austin, TX | 42.8% | $95 million | $24 million | $71 million | $221 million | FDIC |
| 17 | Brannen Bank | Inverness, FL | 42.3% | $27 million | $27 million | – | $64 million | FDIC |
| 18 | USAA Federal Savings Bank | Phoenix, AZ | 41.2% | $4.1 billion | $1.1 billion | $2.9 billion | $9.9 billion | FDIC |
| 19 | First Bank | St. Louis, MO | 40.5% | $264 million | $118 million | $146 million | $651 million | FDIC |
| 20 | Bank of Hawaii | Honolulu, HI | 38.7% | $778 million | $160 million | $618 million | $2.0 billion | FDIC |
| 21 | First National Bank and Trust Company of Newtown | Newtown, PA | 38.0% | $57 million | $57 million | – | $149 million | FDIC |
| 22 | Inwood National Bank | Dallas, TX | 37.8% | $176 million | – | $176 million | $465 million | FDIC |
| 23 | Bank of Guam | Hagatna, GU | 37.2% | $100 million | $42 million | $58 million | $268 million | FDIC |
| 24 | First Bank Chicago | Highland Park, IL | 36.9% | $72 million | $908,000 | $71 million | $196 million | FDIC |
| 25 | Citizens Bank & Trust | Guntersville, AL | 36.9% | $39 million | $36 million | $3 million | $105 million | FDIC |
| 26 | First American Trust, FSB | Santa Ana, CA | 35.6% | $243 million | $243 million | – | $685 million | FDIC |
| 27 | First Arkansas Bank and Trust | Jacksonville, AR | 35.5% | $44 million | $44 million | – | $125 million | FDIC |
| 28 | Armstrong Bank | Muskogee, OK | 35.4% | $105 million | $105 million | – | $296 million | FDIC |
| 29 | First Command Bank | Fort Worth, TX | 34.9% | $37 million | $924,000 | $36 million | $106 million | FDIC |
| 30 | Uplift Bank | Arkadelphia, AR | 34.5% | $120 million | $40 million | $80 million | $348 million | FDIC |
| 31 | Arvest Bank | Fayetteville, AR | 34.5% | $893 million | $893 million | – | $2.6 billion | FDIC |
| 32 | 1st Summit Bank | Johnstown, PA | 34.4% | $45 million | $27 million | $18 million | $131 million | FDIC |
| 33 | First State Bank of Uvalde | Uvalde, TX | 34.0% | $97 million | $97 million | – | $285 million | FDIC |
| 34 | Montecito Bank & Trust | Santa Barbara, CA | 33.6% | $80 million | $80 million | – | $237 million | FDIC |
| 35 | First Bank of Alabama | Talladega, AL | 33.6% | $45 million | $45 million | – | $133 million | FDIC |
| 36 | Woodforest National Bank | The Woodlands, TX | 33.1% | $280 million | $87 million | $192 million | $845 million | FDIC |
| 37 | Security Bank of Kansas City | Kansas City, KS | 32.9% | $163 million | $163 million | – | $496 million | FDIC |
| 38 | First National Bank Texas | Killeen, TX | 32.3% | $140 million | $123 million | $17 million | $435 million | FDIC |
| 39 | Savings Bank of Mendocino County | Ukiah, CA | 32.0% | $77 million | $77 million | – | $239 million | FDIC |
| 40 | First Fidelity Bank | Oklahoma City, OK | 31.8% | $97 million | $97 million | $248,000 | $306 million | FDIC |
| 41 | American Business Bank | Los Angeles, CA | 31.8% | $155 million | $70 million | $85 million | $487 million | FDIC |
| 42 | First Bank of Berne | Berne, IN | 31.5% | $34 million | $34 million | – | $109 million | FDIC |
| 43 | The Nodaway Valley Bank | Maryville, MO | 31.4% | $61 million | $61 million | – | $193 million | FDIC |
| 44 | Citizens Business Bank | Ontario, CA | 31.1% | $671 million | $320 million | $351 million | $2.2 billion | FDIC |
| 45 | Westamerica Bank | San Rafael, CA | 31.0% | $184 million | $167 million | $17 million | $595 million | FDIC |
| 46 | The North Side Bank and Trust Company | Cincinnati, OH | 30.6% | $41 million | $36 million | $5 million | $133 million | FDIC |
| 47 | Community Financial Services Bank | Benton, KY | 30.6% | $45 million | $45 million | $76,000 | $147 million | FDIC |
| 48 | Greene County Commercial Bank | Catskill, NY | 30.4% | $42 million | $15 million | $26 million | $137 million | FDIC |
| 49 | Southern Bank and Trust Company | Mount Olive, NC | 30.2% | $159 million | $159 million | – | $528 million | FDIC |
| 50 | Ledyard National Bank | Norwich, VT | 30.1% | $26 million | $8 million | $18 million | $87 million | FDIC |
Download this table (CSV), free. The full dataset, every bank in the ranking with its securities at cost and at fair value, is one email away.
The largest losses in dollars
Bank of America reports the largest net unrealized loss, $84.2 billion, 98% of it on securities held to maturity, followed by Wells Fargo Bank with $35.5 billion, according to FDIC data. The 15 largest in dollars are below, each with its rank relative to capital.
| Rank | Bank | Headquarters | Net unrealized loss | Of which held to maturity | Share of tier 1 capital | Rank by share |
|---|---|---|---|---|---|---|
| 1 | Bank of America | Charlotte, NC | $84.2 billion | $82.1 billion | 45.1% | 12 |
| 2 | Wells Fargo Bank | Sioux Falls, SD | $35.5 billion | $32.5 billion | 23.9% | 106 |
| 3 | JPMorgan Chase Bank | Columbus, OH | $20.9 billion | $18.2 billion | 6.9% | 556 |
| 4 | U.S. Bank | Cincinnati, OH | $13.9 billion | $9.5 billion | 21.9% | 125 |
| 5 | Truist Bank | Charlotte, NC | $12.8 billion | $8.2 billion | 24.6% | 96 |
| 6 | Charles Schwab Bank, SSB | Westlake, TX | $12.1 billion | $8.5 billion | 44.6% | 15 |
| 7 | Citibank | Sioux Falls, SD | $11.3 billion | $10.2 billion | 7.3% | 529 |
| 8 | Capital One | McLean, VA | $7.0 billion | $24 million | 10.3% | 399 |
| 9 | PNC Bank | Wilmington, DE | $5.1 billion | $2.9 billion | 9.4% | 435 |
| 10 | Morgan Stanley Private Bank | Purchase, NY | $4.6 billion | $4.2 billion | 27.6% | 69 |
| 11 | State Street Bank and Trust Company | Boston, MA | $4.1 billion | $4.2 billion | 20.0% | 162 |
| 12 | Morgan Stanley Bank | Salt Lake City, UT | $4.1 billion | $2.6 billion | 10.0% | 414 |
| 13 | USAA Federal Savings Bank | Phoenix, AZ | $4.1 billion | $2.9 billion | 41.2% | 18 |
| 14 | The Huntington National Bank | Columbus, OH | $4.1 billion | $1.7 billion | 15.8% | 235 |
| 15 | The Bank of New York Mellon | New York, NY | $3.6 billion | $2.9 billion | 16.2% | 230 |
Two accounts, two treatments
The FDIC's field definitions describe available-for-sale securities as reported at fair value and held-to-maturity securities at amortized cost. So a loss on an available-for-sale bond already shows in its value on the balance sheet, while a loss on a held-to-maturity bond does not: its fair value is reported in the bank's securities schedule, not in the balance-sheet figure. Across all insured banks, the loss on available-for-sale securities was $110 billion and on held-to-maturity securities $217 billion, according to FDIC data.
Of the 1,048 banks in the ranking, 1,018 carry a net unrealized loss, 19 a net gain, and 11 report neither. The median bank's net loss is 7.3% of its tier 1 capital.
What this means for technology buyers
A securities portfolio whose value moves with interest rates is managed alongside the deposits that fund it, which puts asset-liability measurement, liquidity planning and regulatory reporting in the same conversation. These guides compare the options side by side:
- Treasury and liquidity management solutions: positions, funding and liquidity measurement.
- Fixed income attribution and analytics software: analyzing a bond portfolio's risk and return.
- Regulatory reporting platforms for Basel compliance: capital and liquidity reporting.
Planning the change before choosing the vendor? The Banking and Payments Capability Matrix states what a bank does, from taking deposits to managing liquidity, so a platform can be placed against the capabilities it supports.
More from Finantrix Atlas
- US banks by share of uninsured deposits
- Largest banks in the US, ranked by total assets
- US banks by size: how many in each asset tier
- US bank failures since the FDIC began
How this list was built
The population is every FDIC-insured commercial bank and savings institution that filed a Call Report for June 30, 2026 with $1 billion or more in total assets and positive tier 1 capital, read from the FDIC's BankFind Suite, including banks whose charter has ended since.
Each bank's net unrealized gain or loss is its available-for-sale debt securities at fair value less their amortized cost (FDIC fields SCAF and SCAA), plus its held-to-maturity securities at fair value less their amortized cost (SCHF and SCHA). Equity securities are not included. The capital measure is tier 1 capital, the FDIC field RBCT1J.
The FDIC's Quarterly Banking Profile, the edition for the second quarter of 2026, prints all four securities totals for its population of 4,238 institutions. Summed across the same institutions, the banks' figures equal each of them to the million dollars, and the industry loss on this page equals the profile's own total unrealized loss line, a test that a dropped or double-counted bank would fail.
Limits
- Unrealized, at one date. A loss changes with interest rates and narrows as a bond approaches maturity. It is not a loss the bank has taken.
- A measure of exposure, not of solvency. The ranking compares one loss to one measure of capital. It does not show the bank's earnings, its liquidity, its hedges, or whether it intends or needs to sell.
- Debt securities only. Loans also change in value with rates, and are not counted here.
- Banks of $1 billion or more, so that small portfolios do not dominate a ranking by share.
- Banks, not holding companies. A group with several charters appears once per charter.
- One quarter. The date of the data is June 30, 2026.
Cite this
Free to quote, cite and republish, including the chart, with credit to Finantrix Atlas and a link to this page.
FDIC-insured US banks held $327 billion in net unrealized losses on their debt securities on June 30, 2026, 66% of it on securities held to maturity, according to a Finantrix Atlas analysis of FDIC data.
89 US banks with $1 billion or more in assets carried net unrealized securities losses larger than a quarter of their tier 1 capital on June 30, 2026, according to Finantrix Atlas, from FDIC Call Reports.
Suggested citation: Finantrix Atlas, "US Banks by Unrealized Losses on Securities," data as of June 30, 2026, from FDIC Call Reports and the FDIC Quarterly Banking Profile. https://www.finantrix.com/articles/banks-unrealized-securities-losses
Embed the chart:
<a href="https://www.finantrix.com/articles/banks-unrealized-securities-losses"><img src="https://www.finantrix.com/atlas/banks-unrealized-securities-losses.png?v=2026-06-30" alt="US banks with the largest unrealized securities losses relative to capital, from FDIC data, by Finantrix Atlas"></a>
<p>Chart: <a href="https://www.finantrix.com/articles/banks-unrealized-securities-losses">Finantrix Atlas</a>, from FDIC Call Reports.</p>
Frequently asked questions
Q: How much do US banks have in unrealized losses on securities? A: $327 billion in net unrealized losses on debt securities on June 30, 2026, across all FDIC-insured banks, according to FDIC data: $110 billion on available-for-sale securities and $217 billion on securities held to maturity.
Q: Which US bank has the largest unrealized securities losses? A: In dollars, Bank of America, with $84.2 billion on June 30, 2026. Relative to tier 1 capital, among banks of $1 billion or more, Union County Savings Bank, at 150.2%, according to FDIC data.
Q: Why does it matter whether a bond is held to maturity? A: The FDIC's definitions describe held-to-maturity securities as reported at amortized cost and available-for-sale securities at fair value. A loss on a held-to-maturity bond therefore does not reduce its value on the balance sheet unless the bank sells it.
Q: Does an unrealized loss mean a bank is in trouble? A: Not on its own. It is a loss in market value at one date, which narrows as securities near maturity and moves with interest rates. Whether it matters depends on whether the bank needs to sell, which this ranking does not show.
Download the data
Two CSV files, free: the 50 rows on this page, and the full dataset of all 1,048 rows, as of June 30, 2026.
Frequently Asked Questions
How much do US banks have in unrealized losses on securities?
$327 billion in net unrealized losses on debt securities on June 30, 2026, across all FDIC-insured banks, according to FDIC data: $110 billion on available-for-sale securities and $217 billion on securities held to maturity.
Which US bank has the largest unrealized securities losses?
In dollars, Bank of America, with $84.2 billion on June 30, 2026. Relative to tier 1 capital, among banks of $1 billion or more, Union County Savings Bank, at 150.2%, according to FDIC data.
Why does it matter whether a bond is held to maturity?
The FDIC's definitions describe held-to-maturity securities as reported at amortized cost and available-for-sale securities at fair value. A loss on a held-to-maturity bond therefore does not reduce its value on the balance sheet unless the bank sells it.
Does an unrealized loss mean a bank is in trouble?
Not on its own. It is a loss in market value at one date, which narrows as securities near maturity and moves with interest rates. Whether it matters depends on whether the bank needs to sell, which this ranking does not show.