
Key Takeaways
- JPMorgan Chase Bank made more jumbo home loans than any other US lender in 2025, 9,682, according to HMDA data.
- Jumbo loans were 5.1% of conventional first-lien home loans in 2025 by count, 167,603 loans, according to HMDA data.
- Banks made 54% of jumbo loans in 2025 and independent mortgage companies 38%, according to HMDA filings.
- The ten largest jumbo lenders made 35% of jumbo loans, according to HMDA data.
JPMorgan Chase Bank made 9,682 jumbo home loans in 2025, more than any other US lender, according to HMDA data, followed by Bank of America and Wells Fargo Bank. Lenders made 167,603 jumbo loans in all, up 18% from 2024, 5.1% of the 3,274,269 conventional first-lien loans on one-to-four family homes.
A jumbo loan is a mortgage larger than the conforming loan limit, the most that Fannie Mae and Freddie Mac can buy in the county where the home is. Because the agencies cannot buy it, the lender either keeps the loan or sells it elsewhere. Banks made 54% of jumbo loans in 2025 and independent mortgage companies 38%, according to HMDA filings.
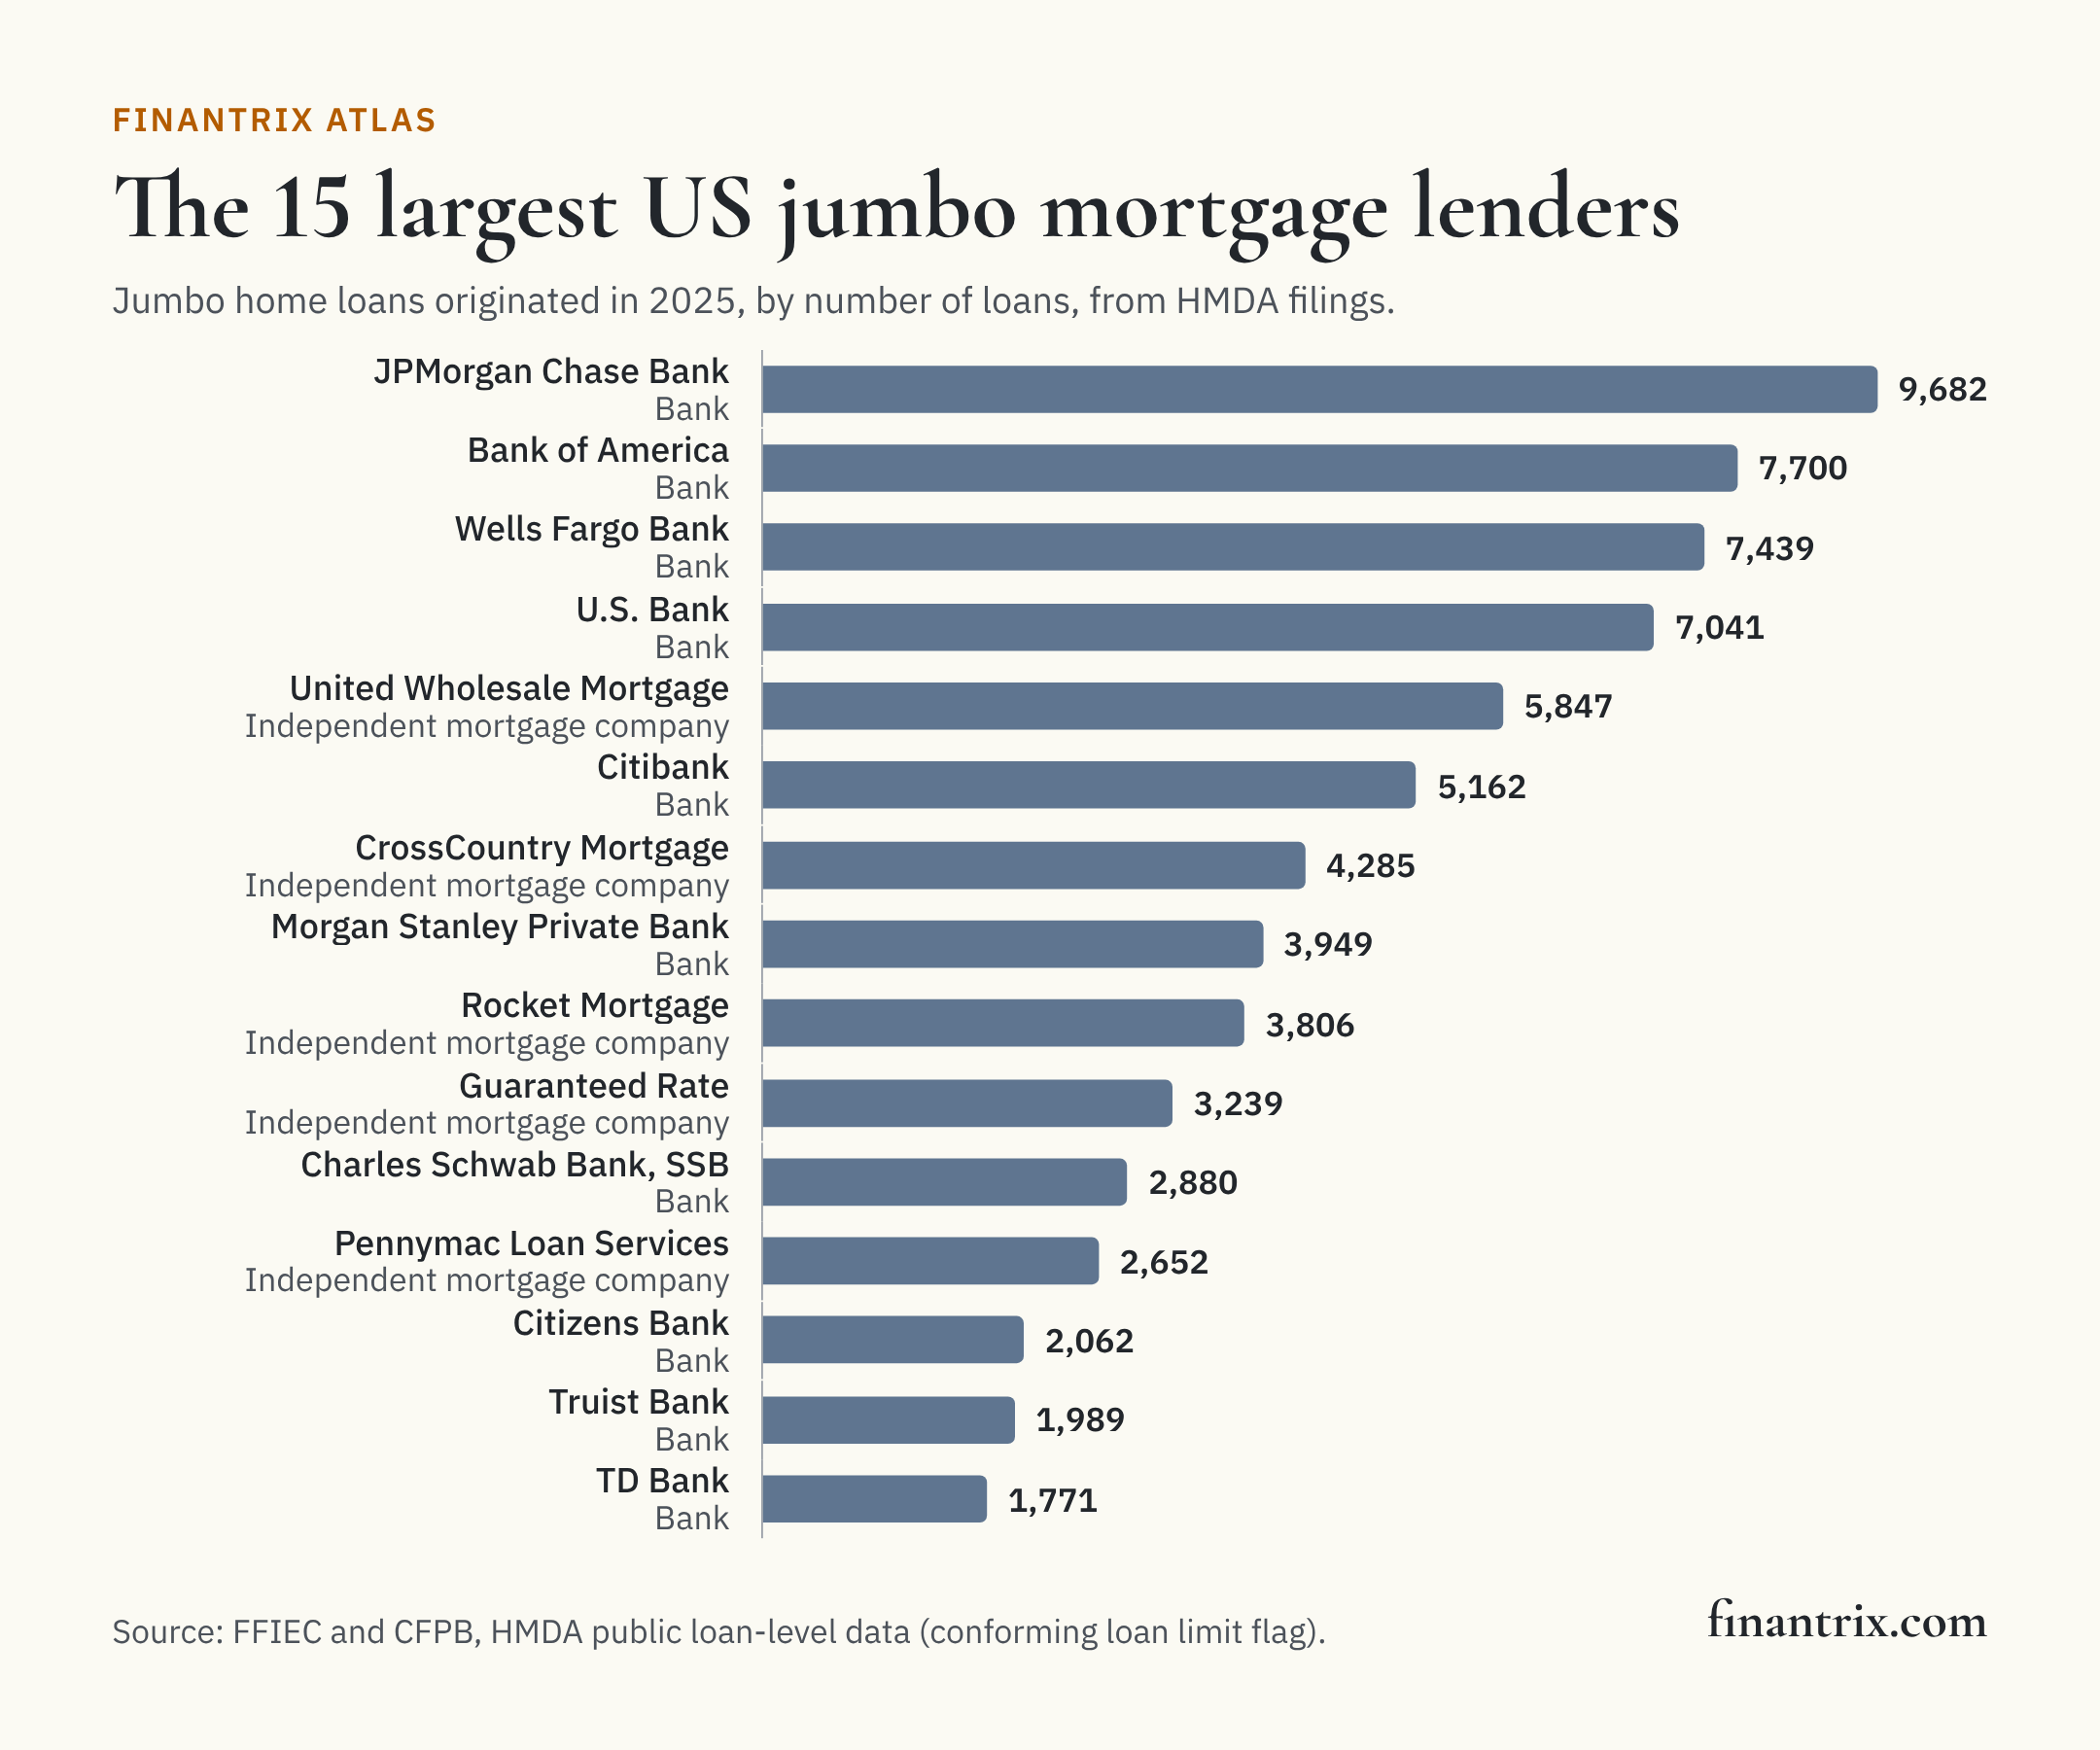
The 50 largest jumbo lenders
Ranked by the number of jumbo loans originated in 2025, as each lender reported them under the Home Mortgage Disclosure Act. "Jumbo share of its conventional home loans" is jumbo loans as a share of the lender's conventional first-lien home loans. Each row is one reporting institution.
| Rank | Lender | Type | Jumbo loans | Amount | Average loan | Share of reported jumbo loans | Jumbo share of its conventional home loans | Change from a year earlier | Source |
|---|---|---|---|---|---|---|---|---|---|
| 1 | JPMorgan Chase Bank | Bank | 9,682 | $19.4 billion | $2.00 million | 5.8% | 12% | +39% | FFIEC |
| 2 | Bank of America | Bank | 7,700 | $14.9 billion | $1.94 million | 4.6% | 25% | +18% | FFIEC |
| 3 | Wells Fargo Bank | Bank | 7,439 | $14.1 billion | $1.90 million | 4.4% | 19% | +28% | FFIEC |
| 4 | U.S. Bank | Bank | 7,041 | $12.0 billion | $1.70 million | 4.2% | 18% | +1% | FFIEC |
| 5 | United Wholesale Mortgage | Independent mortgage company | 5,847 | $8.0 billion | $1.37 million | 3.5% | 2% | −15% | FFIEC |
| 6 | Citibank | Bank | 5,162 | $10.0 billion | $1.94 million | 3.1% | 39% | +6% | FFIEC |
| 7 | CrossCountry Mortgage | Independent mortgage company | 4,285 | $6.1 billion | $1.42 million | 2.6% | 6% | +37% | FFIEC |
| 8 | Morgan Stanley Private Bank | Bank | 3,949 | $7.7 billion | $1.95 million | 2.4% | 38% | −1% | FFIEC |
| 9 | Rocket Mortgage | Independent mortgage company | 3,806 | $5.0 billion | $1.31 million | 2.3% | 2% | +28% | FFIEC |
| 10 | Guaranteed Rate | Independent mortgage company | 3,239 | $4.5 billion | $1.40 million | 1.9% | 7% | +37% | FFIEC |
| 11 | Charles Schwab Bank, SSB | Bank | 2,880 | $4.5 billion | $1.58 million | 1.7% | 51% | +67% | FFIEC |
| 12 | Pennymac Loan Services | Independent mortgage company | 2,652 | $3.5 billion | $1.33 million | 1.6% | 7% | +154% | FFIEC |
| 13 | Citizens Bank | Bank | 2,062 | $4.5 billion | $2.17 million | 1.2% | 19% | +33% | FFIEC |
| 14 | Truist Bank | Bank | 1,989 | $2.8 billion | $1.40 million | 1.2% | 13% | +30% | FFIEC |
| 15 | TD Bank | Bank | 1,771 | $2.7 billion | $1.51 million | 1.1% | 27% | +8% | FFIEC |
| 16 | BMO Bank | Bank | 1,580 | $2.9 billion | $1.85 million | 0.9% | 36% | −44% | FFIEC |
| 17 | UBS Bank USA | Bank | 1,575 | $3.6 billion | $2.26 million | 0.9% | 47% | +13% | FFIEC |
| 18 | CMG Mortgage | Independent mortgage company | 1,463 | $2.1 billion | $1.42 million | 0.9% | 4% | +69% | FFIEC |
| 19 | The Huntington National Bank | Bank | 1,448 | $1.9 billion | $1.33 million | 0.9% | 8% | −5% | FFIEC |
| 20 | PNC Bank | Bank | 1,173 | $2.2 billion | $1.86 million | 0.7% | 10% | −25% | FFIEC |
| 21 | Movement Mortgage | Independent mortgage company | 1,156 | $1.5 billion | $1.30 million | 0.7% | 4% | +4% | FFIEC |
| 22 | HSBC Bank USA | Bank | 1,150 | $2.5 billion | $2.21 million | 0.7% | 43% | −34% | FFIEC |
| 23 | Fairway Independent Mortgage | Independent mortgage company | 1,104 | $1.4 billion | $1.24 million | 0.7% | 3% | +27% | FFIEC |
| 24 | Commerce Home Mortgage | Independent mortgage company | 1,061 | $1.8 billion | $1.67 million | 0.6% | 14% | +86% | FFIEC |
| 25 | City National Bank | Bank | 1,052 | $2.2 billion | $2.06 million | 0.6% | 36% | +303% | FFIEC |
| 26 | Fifth Third Bank | Bank | 1,033 | $1.4 billion | $1.39 million | 0.6% | 9% | −2% | FFIEC |
| 27 | Regions Bank | Bank | 1,026 | $1.3 billion | $1.27 million | 0.6% | 9% | +6% | FFIEC |
| 28 | Newrez | Independent mortgage company | 1,013 | $1.4 billion | $1.36 million | 0.6% | 3% | +133% | FFIEC |
| 29 | First National Bank of Pennsylvania | Bank | 965 | $1.2 billion | $1.21 million | 0.6% | 13% | −4% | FFIEC |
| 30 | OriginPoint | Independent mortgage company | 943 | $1.4 billion | $1.51 million | 0.6% | 18% | +79% | FFIEC |
| 31 | First-Citizens Bank & Trust | Bank | 912 | $1.4 billion | $1.56 million | 0.5% | 18% | −14% | FFIEC |
| 32 | Manufacturers and Traders Trust | Bank | 911 | $1.4 billion | $1.58 million | 0.5% | 12% | +25% | FFIEC |
| 33 | Cadence Bank | Bank | 851 | $1.1 billion | $1.34 million | 0.5% | 12% | +10% | FFIEC |
| 34 | Guild Mortgage | Independent mortgage company | 832 | $1.0 billion | $1.24 million | 0.5% | 2% | +12% | FFIEC |
| 35 | Nexera Holding | Independent mortgage company | 815 | $1.3 billion | $1.54 million | 0.5% | 17% | +25% | FFIEC |
| 36 | First Horizon Bank | Bank | 808 | $1.2 billion | $1.46 million | 0.5% | 18% | −15% | FFIEC |
| 37 | The Loan Store | Independent mortgage company | 805 | $1.1 billion | $1.35 million | 0.5% | 3% | +107% | FFIEC |
| 38 | loanDepot.com | Independent mortgage company | 798 | $1.1 billion | $1.38 million | 0.5% | 2% | +42% | FFIEC |
| 39 | Kiavi Funding | Bank- or credit union-affiliated | 752 | $1.2 billion | $1.58 million | 0.4% | 3% | +9% | FFIEC |
| 40 | Citadel Servicing | Independent mortgage company | 744 | $1.2 billion | $1.60 million | 0.4% | 11% | +11% | FFIEC |
| 41 | Goldman Sachs Bank USA | Bank | 740 | $2.2 billion | $2.99 million | 0.4% | 73% | +41% | FFIEC |
| 42 | Guaranteed Rate Affinity | Independent mortgage company | 739 | $1.1 billion | $1.44 million | 0.4% | 6% | +41% | FFIEC |
| 43 | Raymond James Bank | Bank | 728 | $1.2 billion | $1.71 million | 0.4% | 43% | +43% | FFIEC |
| 44 | Zions Bancorporation | Bank | 714 | $1.4 billion | $1.99 million | 0.4% | 26% | +19% | FFIEC |
| 45 | SouthState Bank | Bank | 685 | $947 million | $1.38 million | 0.4% | 13% | +134% | FFIEC |
| 46 | NexBank | Bank | 676 | $858 million | $1.27 million | 0.4% | 12% | +120% | FFIEC |
| 47 | Champions Funding | Independent mortgage company | 641 | $933 million | $1.46 million | 0.4% | 6% | +114% | FFIEC |
| 48 | New American Funding | Independent mortgage company | 627 | $907 million | $1.45 million | 0.4% | 3% | +42% | FFIEC |
| 49 | Cake Mortgage | Independent mortgage company | 624 | $1.2 billion | $1.88 million | 0.4% | 24% | +339% | FFIEC |
| 50 | Stifel Bank and Trust | Bank | 614 | $1.1 billion | $1.72 million | 0.4% | 17% | +48% | FFIEC |
Download this table (CSV), free. The full dataset, every HMDA filer with its jumbo loans, amounts and conventional first-lien home loans, is one email away.
The jumbo market in 2025
- According to HMDA data, jumbo loans totaled $272 billion, an average of about $1.62 million each.
- The ten largest jumbo lenders made 35% of jumbo loans and the 50 in the table 61%.
- Banks made 54%, independent mortgage companies 38%, credit unions 7%, and mortgage companies owned by or affiliated with a bank or credit union 2%, according to HMDA filings.
What this means for technology buyers
A jumbo loan is underwritten to the lender's own standards or an investor's rather than the agencies', and a lender that keeps one carries its risk, so the decisioning, documentation and portfolio systems behind it matter more. These guides compare the options side by side:
- Loan origination systems for mortgage banks: taking, underwriting and closing a home loan.
- Credit decision engines for consumer lending: the rules behind a decision outside agency guidelines.
- Private banking solutions: serving the clients who borrow above the limit.
Mapping the business? The Banking and Payments Capability Matrix covers retail lending, where mortgage origination sits, alongside the rest of a bank.
More from Finantrix Atlas
- Largest mortgage lenders in the US
- Largest FHA and VA lenders
- Bank and nonbank shares of mortgage lending
- Largest mortgage lender in each state
How this list was built
The universe is every conventional, closed-end, first-lien origination on a one-to-four family dwelling, reverse mortgages excluded, in the FFIEC's public HMDA loan-level file for 2025, the same file as our ranking of the largest mortgage lenders. A loan is jumbo when the file's conforming loan limit field marks it nonconforming: the FFIEC derives that field by comparing the loan amount with the limit for the property's county and number of units. 648 loans whose status could not be determined are left out of both sides. Each lender's type comes from the FDIC's and NCUA's records first and the FFIEC's own lender codes after them, as on our page on banks and nonbanks in mortgage lending.
Lenders are ranked by number of loans, so an amount keyed in error cannot move one up the table; a lender whose filed amounts were set aside on our state-leader page shows no dollar figure here. The file's total originations match the FFIEC Data Browser's national count for both years, and each lender's record count matches the FFIEC's filer list.
Limits
- Lenders below HMDA's thresholds are missing. Small lenders that do not report under HMDA are not counted.
- Conventional first liens only. A government-backed loan or a second lien above the limit is not counted.
- Lenders, not groups. A bank and its mortgage subsidiary file separately and are ranked separately.
- Amounts are rounded. The FFIEC's public file rounds each loan amount to the midpoint of a $10,000 band. The data are for 2025.
Cite this
Free to quote, cite and republish, including the chart, with credit to Finantrix Atlas and a link to this page.
JPMorgan Chase Bank made 9,682 jumbo home loans in 2025, the most of any US lender, according to a Finantrix Atlas analysis of HMDA data.
Suggested citation: Finantrix Atlas, "Largest Jumbo Mortgage Lenders in the US," 2025, from FFIEC and CFPB HMDA data. https://www.finantrix.com/articles/largest-jumbo-mortgage-lenders
Embed the chart:
<a href="https://www.finantrix.com/articles/largest-jumbo-mortgage-lenders"><img src="https://www.finantrix.com/atlas/largest-jumbo-mortgage-lenders.png?v=2025-12-31" alt="The largest US jumbo mortgage lenders, from Finantrix Atlas"></a>
<p>Chart: <a href="https://www.finantrix.com/articles/largest-jumbo-mortgage-lenders">Finantrix Atlas</a>, from HMDA data.</p>
Frequently asked questions
Q: Who is the largest jumbo mortgage lender? A: JPMorgan Chase Bank, which made 9,682 jumbo home loans in 2025, according to HMDA data.
Q: How many jumbo loans were made in 2025? A: 167,603, according to HMDA filings, 5.1% of conventional first-lien loans on one-to-four family homes.
Q: Do banks or mortgage companies make most jumbo loans? A: Banks made 54% of jumbo loans in 2025 and independent mortgage companies 38%, according to HMDA data.
Download the data
Two CSV files, free: the 50 rows on this page, and the full dataset of all 1,817 rows, as of December 31, 2025.
Frequently Asked Questions
Who is the largest jumbo mortgage lender?
JPMorgan Chase Bank, which made 9,682 jumbo home loans in 2025, according to HMDA data.
How many jumbo loans were made in 2025?
167,603, according to HMDA filings, 5.1% of conventional first-lien loans on one-to-four family homes.
Do banks or mortgage companies make most jumbo loans?
Banks made 54% of jumbo loans in 2025 and independent mortgage companies 38%, according to HMDA data.