
Key Takeaways
- Fidelity Government Money Market Fund is the largest U.S. money market fund, with $458 billion in net assets at the end of October 2026, according to its Form N-MFP filing with the SEC.
- U.S. money market funds held $8.41 trillion across 311 funds; government funds held 82% of it and prime funds 16%.
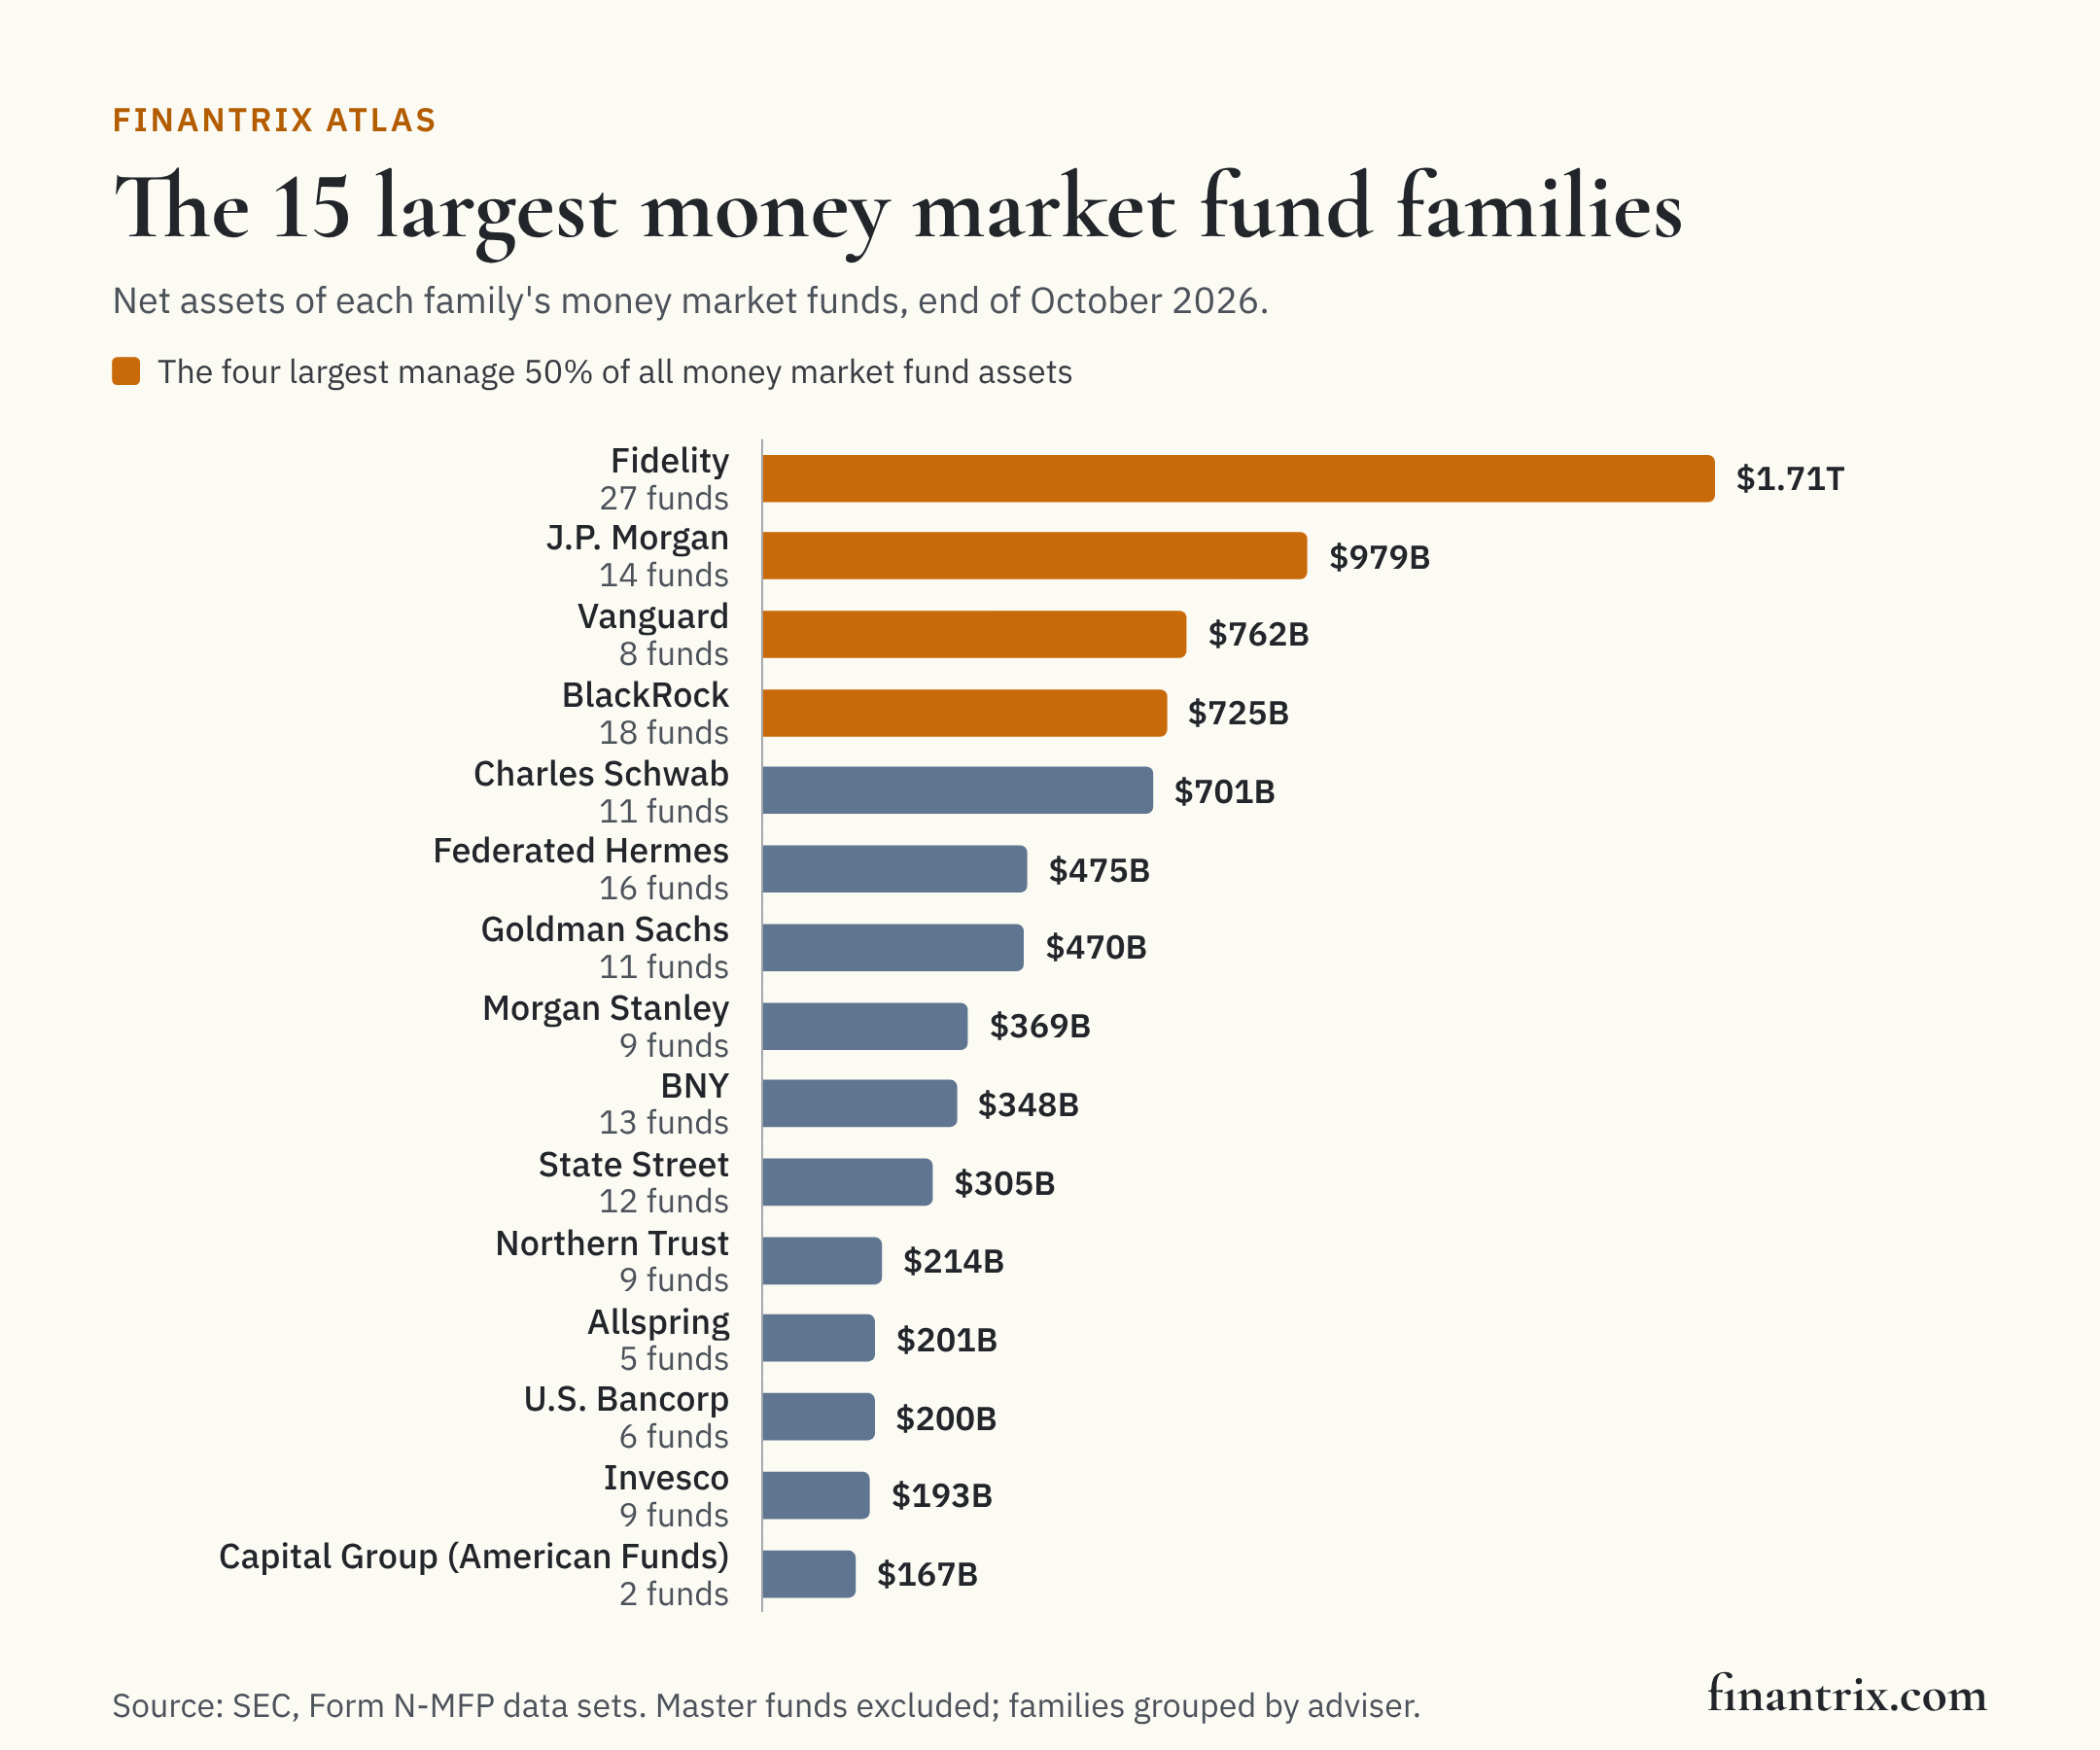
- Fidelity manages the most money market fund assets, $1.71 trillion, and the four largest families, Fidelity, J.P. Morgan, Vanguard and BlackRock, manage 50% of the total.
- Money market fund assets were up 0.8% from the end of September 2026, according to the SEC's N-MFP data.
Fidelity Government Money Market Fund is the largest U.S. money market fund, with $458 billion in net assets at the end of October 2026, 5.4% of all money market fund assets, according to its monthly filing with the SEC. It is followed by Schwab Prime Advantage Money Fund and Vanguard Federal Money Market Fund. Counted by fund family, Fidelity manages the most, $1.71 trillion across 27 funds, and the four largest families, Fidelity, J.P. Morgan, Vanguard and BlackRock, manage 50% of the $8.41 trillion total.
Every money market fund reports its full portfolio to the SEC each month on Form N-MFP. Across the 311 funds counted here for October 2026, government funds, which hold Treasury and agency debt and repurchase agreements backed by it, held $6.89 trillion or 82%. Prime funds, which also hold bank and corporate debt, held $1.36 trillion or 16%, and tax-exempt funds held $165 billion. Total assets were up 0.8% from the end of September 2026.
The 25 largest money market funds
Ranked by net assets at the end of October 2026, as each fund reported on Form N-MFP. A feeder fund invests all its assets in a master fund; the feeder is ranked and the master is not, so no dollar is counted twice. A fund marked as an internal cash fund is one its filing describes as a cash management vehicle for affiliated funds: it exists mainly to hold the cash of its own family's other funds.
| Rank | Fund | Family | Category | Net assets | Share of all money market fund assets | Change from September 2026 | Source |
|---|---|---|---|---|---|---|---|
| 1 | Fidelity Government Money Market Fund | Fidelity | Government | $458B | 5.4% | −1.6% | SEC N-MFP |
| 2 | Schwab Prime Advantage Money Fund | Charles Schwab | Prime | $390B | 4.6% | −0.5% | SEC N-MFP |
| 3 | Vanguard Federal Money Market Fund | Vanguard | Government | $374B | 4.4% | −0.7% | SEC N-MFP |
| 4 | JPMorgan 100% U.S. Treasury Securities Money Market Fund | J.P. Morgan | Government | $354B | 4.2% | +4.0% | SEC N-MFP |
| 5 | JPMorgan U.S. Government Money Market Fund | J.P. Morgan | Government | $347B | 4.1% | −2.7% | SEC N-MFP |
| 6 | Goldman Sachs Financial Square Fund - Government | Goldman Sachs | Government | $281B | 3.3% | +1.1% | SEC N-MFP |
| 7 | Fidelity Investments Money Market Government Portfolio | Fidelity | Government | $246B | 2.9% | −1.4% | SEC N-MFP |
| 8 | Fidelity Government Cash Reserves | Fidelity | Government | $245B | 2.9% | −1.3% | SEC N-MFP |
| 9 | Government Portfolio | Morgan Stanley | Government | $238B | 2.8% | +5.1% | SEC N-MFP |
| 10 | State Street Institutional U.S. Government Money Market Fund (feeder) | State Street | Government | $204B | 2.4% | +1.7% | SEC N-MFP |
| 11 | FEDFUND | BlackRock | Government | $188B | 2.2% | −1.7% | SEC N-MFP |
| 12 | TREASURY TRUST FUND | BlackRock | Government | $186B | 2.2% | +1.4% | SEC N-MFP |
| 13 | FEDERATED HERMES GOVERNMENT OBLIGATIONS FUND | Federated Hermes | Government | $177B | 2.1% | −0.3% | SEC N-MFP |
| 14 | BNY Dreyfus Government Cash Management | BNY | Government | $164B | 2.0% | +4.2% | SEC N-MFP |
| 15 | Fidelity Investments Money Market Money Market Portfolio | Fidelity | Prime | $156B | 1.9% | 0.0% | SEC N-MFP |
| 16 | Fidelity Investments Money Market Treasury Only Portfolio | Fidelity | Government | $143B | 1.7% | +2.7% | SEC N-MFP |
| 17 | Capital Group Central Fund Series - Capital Group Central Cash Fund (internal cash fund) | Capital Group (American Funds) | Government | $132B | 1.6% | +15.7% | SEC N-MFP |
| 18 | T-FUND | BlackRock | Government | $131B | 1.6% | +2.3% | SEC N-MFP |
| 19 | Fidelity Money Market Fund | Fidelity | Prime | $127B | 1.5% | −4.2% | SEC N-MFP |
| 20 | Vanguard Market Liquidity Fund (internal cash fund) | Vanguard | Government | $125B | 1.5% | +16.4% | SEC N-MFP |
| 21 | Government Obligations Fund | U.S. Bancorp | Government | $123B | 1.5% | −2.7% | SEC N-MFP |
| 22 | Vanguard Treasury Money Market Fund | Vanguard | Government | $118B | 1.4% | +3.2% | SEC N-MFP |
| 23 | Allspring Government Money Market Fund | Allspring | Government | $116B | 1.4% | −3.1% | SEC N-MFP |
| 24 | Vanguard Cash Reserves Federal Money Market Fund | Vanguard | Government | $116B | 1.4% | −0.2% | SEC N-MFP |
| 25 | Schwab U.S. Treasury Money Fund | Charles Schwab | Government | $114B | 1.4% | +1.8% | SEC N-MFP |
Download this table (CSV), free. The full dataset, every money market fund with its registrant, adviser and SEC file number, category and both months' net assets, is one email away.
The 15 largest money market fund families
Each fund is counted under the family of the investment adviser its filing names, grouped by company, so a family's separate advisory entities count once. The ten largest families manage 81% of all money market fund assets, out of 79 families in all.
| Rank | Fund family | Money market funds | Net assets | Share of all money market fund assets | Government funds' share of the family | Change from September 2026 | Source |
|---|---|---|---|---|---|---|---|
| 1 | Fidelity | 27 | $1.71T | 20.3% | 75% | −0.5% | SEC N-MFP |
| 2 | J.P. Morgan | 14 | $979B | 11.6% | 79% | +1.3% | SEC N-MFP |
| 3 | Vanguard | 8 | $762B | 9.1% | 96% | +2.6% | SEC N-MFP |
| 4 | BlackRock | 18 | $725B | 8.6% | 82% | −1.4% | SEC N-MFP |
| 5 | Charles Schwab | 11 | $701B | 8.3% | 39% | +0.1% | SEC N-MFP |
| 6 | Federated Hermes | 16 | $475B | 5.6% | 69% | +1.7% | SEC N-MFP |
| 7 | Goldman Sachs | 11 | $470B | 5.6% | 96% | +1.5% | SEC N-MFP |
| 8 | Morgan Stanley | 9 | $369B | 4.4% | 95% | +3.6% | SEC N-MFP |
| 9 | BNY | 13 | $348B | 4.1% | 99% | +1.7% | SEC N-MFP |
| 10 | State Street | 12 | $305B | 3.6% | 100% | +5.2% | SEC N-MFP |
| 11 | Northern Trust | 9 | $214B | 2.5% | 100% | +7.5% | SEC N-MFP |
| 12 | Allspring | 5 | $201B | 2.4% | 78% | −2.2% | SEC N-MFP |
| 13 | U.S. Bancorp | 6 | $200B | 2.4% | 98% | +1.3% | SEC N-MFP |
| 14 | Invesco | 9 | $193B | 2.3% | 95% | −15.0% | SEC N-MFP |
| 15 | Capital Group (American Funds) | 2 | $167B | 2.0% | 100% | +12.0% | SEC N-MFP |
What this means for technology buyers
A money market fund strikes a price at least daily, reports its whole portfolio monthly, and must hold set shares of its assets in cash and securities that mature within a day or a week. These guides compare the systems on the fund's side and the investor's:
- Order management systems for asset managers: how a fund manager places and tracks its trades in Treasury bills, commercial paper and repurchase agreements.
- Treasury and liquidity management solutions: where a corporate treasury decides how much cash to sweep into these funds.
More from Finantrix Atlas
How this list was built
The figures are the SEC's Form N-MFP data sets: reports from 329 funds for October 2026, one per fund, with an amended filing replacing the one it amends. 17 master funds, holding $648 billion, are left out because their assets belong to the feeder funds that are counted, and so is the one fund reporting no net assets; 32 feeder funds are in the ranking. 31 funds marked as cash vehicles for affiliated funds hold $537 billion and are included.
Two checks ran before publication. Each fund's net assets equal the sum of its share classes' net assets. The reader was also run on the month before and compared with the SEC Division of Investment Management's own list of money market funds for September 2026: the same 328 funds appear in both, in the same categories.
Limits
- Assets, not investors. Net assets say how large a fund is, not how many investors own it or which investors it is open to.
- Internal cash funds are other funds' cash. An internal cash fund holds the cash of its family's mutual funds and exchange-traded funds, so its assets are money those funds already report. A money market fund that invests in another money market fund, which a few do, is counted along with the fund it invests in.
- One month-end. Money market fund assets move with tax dates and quarter-ends; these figures are for the end of October 2026.
- Families by adviser. A fund is placed in the family of its adviser of record, not of a sub-adviser or the firm that sells it.
Cite this
Free to quote, cite and republish, including the chart, with credit to Finantrix Atlas and a link to this page.
Fidelity Government Money Market Fund is the largest U.S. money market fund, with $458 billion in net assets at the end of October 2026, according to a Finantrix Atlas analysis of SEC Form N-MFP data.
Suggested citation: Finantrix Atlas, "Largest Money Market Funds by Assets," October 2026, from SEC Form N-MFP data sets. https://www.finantrix.com/articles/largest-money-market-funds
Embed the chart:
<a href="https://www.finantrix.com/articles/largest-money-market-funds"><img src="https://www.finantrix.com/atlas/largest-money-market-funds.png?v=2026-10-31" alt="The largest money market fund families, from Finantrix Atlas"></a>
<p>Chart: <a href="https://www.finantrix.com/articles/largest-money-market-funds">Finantrix Atlas</a>, from SEC data.</p>
Frequently asked questions
Q: What is the largest money market fund? A: Fidelity Government Money Market Fund, managed by Fidelity, with $458 billion in net assets at the end of October 2026, according to its Form N-MFP filing with the SEC.
Q: How much money is in money market funds? A: $8.41 trillion at the end of October 2026, across 311 funds, counting feeder funds and not the master funds they invest in. Government funds held 82% of it, and $537 billion of it was in funds that hold other funds' cash.
Q: Which company manages the most money market fund assets? A: Fidelity, with $1.71 trillion across 27 money market funds, 20% of the total, according to SEC Form N-MFP data.
Download the data
Two CSV files, free: the 25 rows on this page, and the full dataset of all 311 rows, as of October 31, 2026.
Frequently Asked Questions
What is the largest money market fund?
Fidelity Government Money Market Fund, managed by Fidelity, with $458 billion in net assets at the end of October 2026, according to its Form N-MFP filing with the SEC.
How much money is in money market funds?
$8.41 trillion at the end of October 2026, across 311 funds, counting feeder funds and not the master funds they invest in. Government funds held 82% of it, and $537 billion of it was in funds that hold other funds' cash.
Which company manages the most money market fund assets?
Fidelity, with $1.71 trillion across 27 money market funds, 20% of the total, according to SEC Form N-MFP data.