
Key Takeaways
- On comparable 30-year conventional home purchase loans in 2025, the median US loan carried a rate spread of 0.13 points over the average prime offer rate, according to HMDA data.
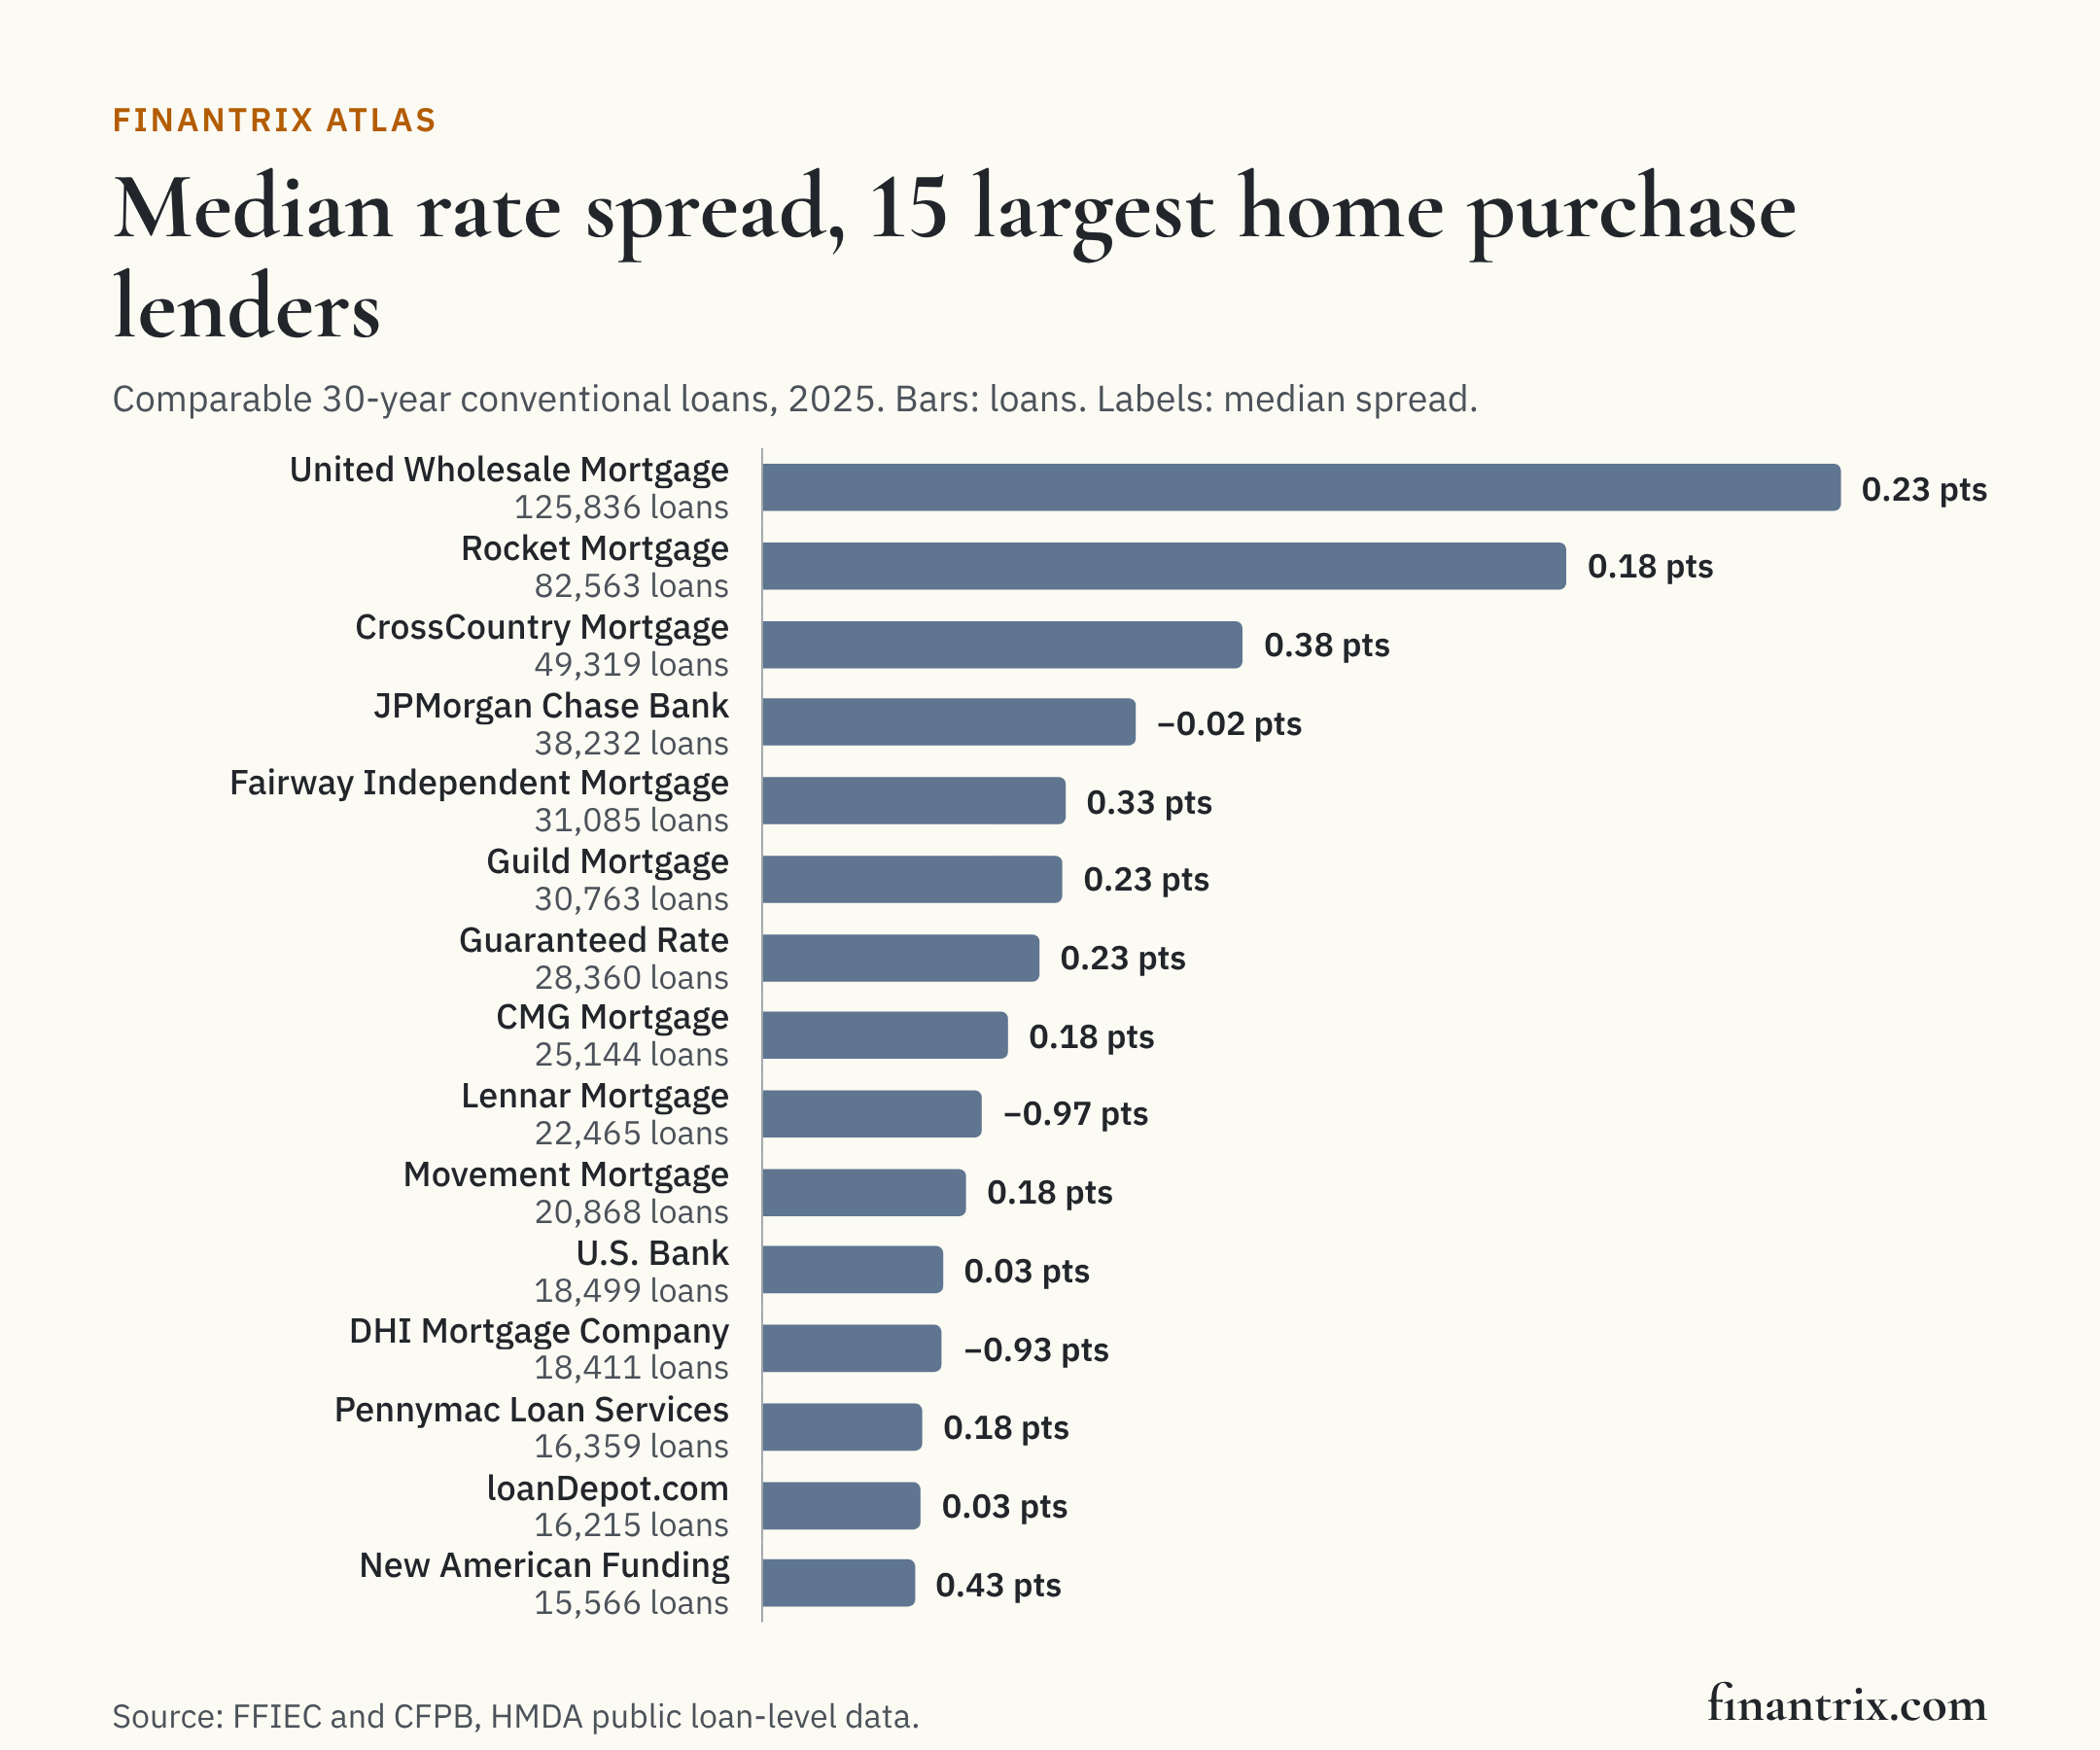
- Among the 50 lenders that made the most such loans, median spreads ranged from −0.97 points at Lennar Mortgage to 0.48 at Everett Financial.
- 2.0% of these loans had a spread of 1.5 points or more, the margin at which Regulation Z treats a loan of this kind as higher-priced.
- The public data do not include credit scores, so a spread is a price comparison among like loans, not a measure of how a lender treats like borrowers.
On comparable 30-year conventional home purchase loans made in 2025, the median US loan carried an annual percentage rate 0.13 points above the average prime offer rate, according to HMDA data. Among the 50 lenders that made the most of these loans, the median ranged from −0.97 points at Lennar Mortgage to 0.48 at Everett Financial. 2.0% of the loans had a spread of 1.5 points or more.
The rate spread is the difference between what a loan costs the borrower, its annual percentage rate, and the average prime offer rate, a benchmark the CFPB publishes for low-risk loans of the same type on the date the rate was set. A negative spread means the borrower paid less than the benchmark. HMDA requires lenders to report it for loans subject to Regulation Z, other than assumptions, purchased loans and reverse mortgages.
Which loans are compared
A spread depends on the kind of loan, so only loans that are alike are compared: originated home purchase loans: closed-end, first lien, conventional, conforming, 30-year term (360 months), site-built one-to-four family, principal residence, not reverse, not for a business purpose. That is 1,614,905 loans from 2,341 lenders. Spreads reported as exempt or left blank (3,645 loans) are left out, as are 1,315 spreads outside −5 to 15 points, which no comparable loan carries. Medians are read from the spreads in 0.05-point steps.
What the controls cannot hold equal is the borrower. The public file does not carry credit scores, and a borrower can pay points up front to reduce the rate. So a lender's spread is the price its borrowers paid for like loans, not a measure of how it would price the same borrower.
The 50 largest lenders
The lenders that made the most comparable loans in 2025, as each reported them under the Home Mortgage Disclosure Act. "Share at 1.5 points or more" is the share of the lender's loans with a spread at or above the margin that makes a loan of this kind higher-priced under Regulation Z. Each row is one reporting institution.
| Rank | Lender | Type | Comparable loans | Median spread (points) | Mean spread (points) | Share at 1.5 points or more | Mean interest rate | Source |
|---|---|---|---|---|---|---|---|---|
| 1 | United Wholesale Mortgage | Independent mortgage company | 125,836 | 0.23 | 0.26 | 2.2% | 6.61% | FFIEC |
| 2 | Rocket Mortgage | Independent mortgage company | 82,563 | 0.18 | 0.24 | 0.5% | 6.59% | FFIEC |
| 3 | CrossCountry Mortgage | Independent mortgage company | 49,319 | 0.38 | 0.44 | 3.2% | 6.77% | FFIEC |
| 4 | JPMorgan Chase Bank | Bank | 38,232 | −0.02 | −0.02 | 0.3% | 6.41% | FFIEC |
| 5 | Fairway Independent Mortgage | Independent mortgage company | 31,085 | 0.33 | 0.35 | 1.4% | 6.71% | FFIEC |
| 6 | Guild Mortgage | Independent mortgage company | 30,763 | 0.23 | 0.26 | 0.7% | 6.61% | FFIEC |
| 7 | Guaranteed Rate | Independent mortgage company | 28,360 | 0.23 | 0.26 | 1.3% | 6.60% | FFIEC |
| 8 | CMG Mortgage | Independent mortgage company | 25,144 | 0.18 | 0.19 | 1.3% | 6.58% | FFIEC |
| 9 | Lennar Mortgage | Independent mortgage company | 22,465 | −0.97 | −1.02 | 0.1% | 5.16% | FFIEC |
| 10 | Movement Mortgage | Independent mortgage company | 20,868 | 0.18 | 0.24 | 0.8% | 6.62% | FFIEC |
| 11 | U.S. Bank | Bank | 18,499 | 0.03 | 0.07 | 0.4% | 6.47% | FFIEC |
| 12 | DHI Mortgage Company | Bank- or credit union-affiliated | 18,411 | −0.93 | −0.90 | 0.0% | 5.42% | FFIEC |
| 13 | Pennymac Loan Services | Independent mortgage company | 16,359 | 0.18 | 0.23 | 0.6% | 6.59% | FFIEC |
| 14 | loanDepot.com | Independent mortgage company | 16,215 | 0.03 | −0.15 | 0.9% | 6.21% | FFIEC |
| 15 | New American Funding | Independent mortgage company | 15,566 | 0.43 | 0.46 | 2.9% | 6.73% | FFIEC |
| 16 | Bank of America | Bank | 14,794 | −0.23 | −0.34 | 0.1% | 6.05% | FFIEC |
| 17 | Wells Fargo Bank | Bank | 14,619 | −0.07 | −0.08 | 0.4% | 6.29% | FFIEC |
| 18 | Union Home Mortgage | Independent mortgage company | 13,629 | 0.33 | 0.37 | 1.4% | 6.69% | FFIEC |
| 19 | The Loan Store | Independent mortgage company | 12,913 | 0.23 | 0.31 | 3.2% | 6.60% | FFIEC |
| 20 | Navy Federal Credit Union | Credit union | 11,779 | −0.02 | 0.06 | 1.3% | 6.61% | FFIEC |
| 21 | Pulte Mortgage | Independent mortgage company | 11,547 | −0.43 | −0.55 | 0.0% | 5.86% | FFIEC |
| 22 | Newrez | Independent mortgage company | 10,889 | 0.28 | 0.37 | 3.3% | 6.73% | FFIEC |
| 23 | Prosperity Home Mortgage | Independent mortgage company | 10,606 | 0.23 | 0.26 | 0.8% | 6.66% | FFIEC |
| 24 | PrimeLending, A PlainsCapital | Bank- or credit union-affiliated | 10,584 | 0.18 | 0.11 | 0.9% | 6.52% | FFIEC |
| 25 | The Huntington National Bank | Bank | 9,608 | 0.23 | 0.24 | 0.7% | 6.60% | FFIEC |
| 26 | Zillow Home Loans | Independent mortgage company | 9,403 | 0.23 | 0.30 | 2.0% | 6.53% | FFIEC |
| 27 | American Pacific Mortgage | Independent mortgage company | 9,240 | 0.38 | 0.44 | 2.4% | 6.72% | FFIEC |
| 28 | NFM | Independent mortgage company | 8,475 | 0.33 | 0.32 | 2.0% | 6.64% | FFIEC |
| 29 | Guaranteed Rate Affinity | Independent mortgage company | 8,389 | 0.18 | 0.21 | 1.0% | 6.58% | FFIEC |
| 30 | Kind Lending | Independent mortgage company | 8,219 | 0.28 | 0.35 | 4.0% | 6.69% | FFIEC |
| 31 | Provident Funding Associates | Independent mortgage company | 8,150 | −0.07 | −0.08 | 0.0% | 6.40% | FFIEC |
| 32 | State Employees' Credit Union | Credit union | 7,731 | −0.47 | −0.61 | 0.0% | 5.90% | FFIEC |
| 33 | NVR Mortgage Finance | Independent mortgage company | 7,663 | −0.02 | −0.04 | 0.1% | 6.42% | FFIEC |
| 34 | Paramount Residential Mortgage Group | Independent mortgage company | 7,571 | 0.33 | 0.37 | 2.6% | 6.65% | FFIEC |
| 35 | Truist Bank | Bank | 7,537 | −0.02 | −0.03 | 0.1% | 6.37% | FFIEC |
| 36 | PNC Bank | Bank | 6,882 | 0.03 | 0.06 | 0.0% | 6.44% | FFIEC |
| 37 | Lower | Independent mortgage company | 6,487 | 0.28 | 0.31 | 1.2% | 6.63% | FFIEC |
| 38 | Flat Branch Mortgage | Independent mortgage company | 6,247 | 0.23 | 0.27 | 0.7% | 6.61% | FFIEC |
| 39 | Fifth Third Bank | Bank | 5,680 | 0.08 | 0.11 | 0.7% | 6.46% | FFIEC |
| 40 | GREENSTATE Credit Union | Credit union | 5,579 | −0.12 | −0.10 | 0.1% | 6.35% | FFIEC |
| 41 | Plains Commerce Bank | Bank | 5,565 | 0.23 | 0.24 | 1.7% | 6.57% | FFIEC |
| 42 | Everett Financial | Independent mortgage company | 5,558 | 0.48 | 0.55 | 3.4% | 6.79% | FFIEC |
| 43 | Ark-La-Tex Financial Services | Independent mortgage company | 5,460 | 0.28 | 0.25 | 0.9% | 6.64% | FFIEC |
| 44 | Taylor Morrison Home Funding | Independent mortgage company | 5,311 | −0.82 | −0.81 | 0.0% | 5.64% | FFIEC |
| 45 | Bell Bank | Bank | 5,206 | 0.18 | 0.21 | 0.3% | 6.58% | FFIEC |
| 46 | Ruoff Mortgage Company | Independent mortgage company | 5,038 | 0.33 | 0.38 | 0.9% | 6.75% | FFIEC |
| 47 | A&D Mortgage | Independent mortgage company | 4,946 | 0.33 | 0.51 | 9.5% | 6.76% | FFIEC |
| 48 | American Neighborhood Mortgage Acceptance Company | Independent mortgage company | 4,915 | 0.38 | 0.41 | 1.7% | 6.72% | FFIEC |
| 49 | Ameris Bank | Bank | 4,913 | 0.08 | 0.13 | 1.4% | 6.51% | FFIEC |
| 50 | Citizens Bank | Bank | 4,897 | −0.07 | −0.06 | 0.1% | 6.33% | FFIEC |
Download this table (CSV), free. The full dataset, every lender with a comparable loan, with its median, mean, higher-priced count, mean interest rate and excluded loans, is one email away.
The lowest and highest median spreads
Among the 260 lenders with 1,000 or more comparable loans, these 15 had the lowest median spread; HomeAmerican Mortgage had the lowest, −1.57 points.
| Rank | Lender | Type | Comparable loans | Median spread (points) | Mean spread (points) | Share at 1.5 points or more | Mean interest rate | Source |
|---|---|---|---|---|---|---|---|---|
| 1 | HomeAmerican Mortgage | Bank- or credit union-affiliated | 2,369 | −1.57 | −1.44 | 0.0% | 4.95% | FFIEC |
| 2 | Velocio Mortgage | Independent mortgage company | 1,150 | −1.48 | −1.18 | 0.1% | 5.24% | FFIEC |
| 3 | Lennar Mortgage | Independent mortgage company | 22,465 | −0.97 | −1.02 | 0.1% | 5.16% | FFIEC |
| 4 | DHI Mortgage Company | Bank- or credit union-affiliated | 18,411 | −0.93 | −0.90 | 0.0% | 5.42% | FFIEC |
| 5 | Mattamy Home Funding | Independent mortgage company | 1,374 | −0.87 | −0.75 | 0.0% | 5.79% | FFIEC |
| 6 | Taylor Morrison Home Funding | Independent mortgage company | 5,311 | −0.82 | −0.81 | 0.0% | 5.64% | FFIEC |
| 7 | Suncoast Credit Union | Credit union | 1,096 | −0.72 | −0.69 | 0.0% | 5.37% | FFIEC |
| 8 | Inspire Home Loans | Independent mortgage company | 1,874 | −0.62 | −0.60 | 0.1% | 5.54% | FFIEC |
| 9 | JET Homeloans | Independent mortgage company | 2,100 | −0.52 | −0.37 | 0.2% | 6.01% | FFIEC |
| 10 | State Employees' Credit Union | Credit union | 7,731 | −0.47 | −0.61 | 0.0% | 5.90% | FFIEC |
| 11 | CLM Mortgage | Independent mortgage company | 2,003 | −0.47 | −0.46 | 0.0% | 5.77% | FFIEC |
| 12 | M/I Financial | Independent mortgage company | 3,549 | −0.47 | −0.46 | 0.0% | 6.04% | FFIEC |
| 13 | Pulte Mortgage | Independent mortgage company | 11,547 | −0.43 | −0.55 | 0.0% | 5.86% | FFIEC |
| 14 | Victory Mortgage | Independent mortgage company | 1,509 | −0.37 | −0.38 | 0.0% | 6.10% | FFIEC |
| 15 | Citibank | Bank | 4,791 | −0.27 | −0.26 | 0.0% | 6.10% | FFIEC |
And these 15 had the highest; First National Bank of America had the highest, 2.68 points.
| Rank | Lender | Type | Comparable loans | Median spread (points) | Mean spread (points) | Share at 1.5 points or more | Mean interest rate | Source |
|---|---|---|---|---|---|---|---|---|
| 1 | First National Bank of America | Bank | 1,875 | 2.68 | 3.01 | 99.4% | 9.15% | FFIEC |
| 2 | Champions Funding | Independent mortgage company | 2,070 | 2.23 | 2.21 | 73.3% | 8.39% | FFIEC |
| 3 | Commerce Home Mortgage | Independent mortgage company | 2,874 | 1.38 | 1.59 | 48.0% | 7.83% | FFIEC |
| 4 | Deephaven Mortgage | Independent mortgage company | 1,109 | 1.13 | 1.42 | 36.2% | 7.78% | FFIEC |
| 5 | Citadel Servicing | Independent mortgage company | 1,413 | 1.08 | 1.35 | 35.8% | 7.65% | FFIEC |
| 6 | OCMBC | Independent mortgage company | 3,182 | 1.02 | 1.14 | 34.1% | 7.35% | FFIEC |
| 7 | Angel Oak Mortgage Solutions | Independent mortgage company | 1,147 | 0.98 | 1.15 | 25.7% | 7.47% | FFIEC |
| 8 | Nexera Holding | Independent mortgage company | 1,193 | 0.98 | 1.07 | 22.5% | 7.42% | FFIEC |
| 9 | NQM Funding | Independent mortgage company | 1,375 | 0.93 | 1.00 | 23.1% | 7.44% | FFIEC |
| 10 | New Wave Lending Group | Independent mortgage company | 1,947 | 0.63 | 0.65 | 10.1% | 6.96% | FFIEC |
| 11 | Community Bank | Bank | 1,162 | 0.63 | 0.60 | 1.1% | 7.10% | FFIEC |
| 12 | Securitynational Mortgage | Independent mortgage company | 1,547 | 0.58 | 0.63 | 5.9% | 6.89% | FFIEC |
| 13 | Geneva Financial | Independent mortgage company | 1,473 | 0.53 | 0.57 | 4.0% | 6.80% | FFIEC |
| 14 | Ixonia Bank | Bank | 3,599 | 0.48 | 0.56 | 4.3% | 6.85% | FFIEC |
| 15 | Everett Financial | Independent mortgage company | 5,558 | 0.48 | 0.55 | 3.4% | 6.79% | FFIEC |
By type of lender
On the same loans, the mean spread was 0.08 points at banks, −0.04 at credit unions, 0.24 at independent mortgage companies and −0.20 at mortgage companies owned by or affiliated with a bank or credit union, according to HMDA filings. The national median was 0.13 points in 2025, against 0.18 in 2024, and the mean interest rate was 6.51%.
What this means for technology buyers
A lender sets its price through its pricing engine and secondary marketing desk, and reports the result through its HMDA filing, where examiners and the public can compare it with everyone else's. These guides compare the options side by side:
- Loan origination systems for mortgage banks: pricing, disclosure and HMDA data captured as the loan is made.
- Credit decision engines for consumer lending: the rules that set a loan's terms.
- Financial BI and dashboarding: comparing a lender's pricing with the market's.
Mapping the business? The Banking and Payments Capability Matrix covers retail lending, where mortgage pricing sits, alongside the rest of a bank.
More from Finantrix Atlas
- Mortgage closing costs by state
- Mortgage denial rates by lender
- Largest mortgage lenders in the US
- Largest jumbo mortgage lenders
How this list was built
The rate spread is HMDA's own field, defined in 12 CFR 1003.4(a)(12) as the difference between the loan's annual percentage rate and the average prime offer rate for a comparable transaction as of the date the interest rate is set. The 1.5-point margin is from 12 CFR 1026.35(a)(1)(i), which makes a first-lien loan on a principal dwelling, at or below the conforming limit, higher-priced when its rate exceeds the benchmark by 1.5 or more percentage points. Each lender's type comes from the FDIC's and NCUA's records first and the FFIEC's own lender codes after them, as on our page on banks and nonbanks in mortgage lending.
The loans are from the FFIEC's public HMDA loan-level file for 2025, the same file as our ranking of the largest mortgage lenders. Its total originations match the FFIEC Data Browser's national count, and each lender's record count matches the FFIEC's filer list. Every lender's spreads add up to its count of comparable loans, and every median and mean lies within the spreads the lender reported.
Limits
- Like loans, not like borrowers. Credit score, loan-to-value and points paid to reduce the rate all move a spread, and none is held equal here.
- One kind of loan. The comparison covers conforming 30-year conventional home purchase loans only; other loans would rank lenders differently.
- Lenders below HMDA's thresholds are missing, and lenders with fewer than 1,000 comparable loans are in the dataset but not the tables.
- The data are for 2025, and the benchmark moves week to week, which the spread already accounts for.
Cite this
Free to quote, cite and republish, including the chart, with credit to Finantrix Atlas and a link to this page.
On comparable 30-year conventional home purchase loans in 2025, the median US mortgage carried a rate 0.13 points above the average prime offer rate, according to a Finantrix Atlas analysis of HMDA data.
Suggested citation: Finantrix Atlas, "Mortgage Rate Spread by Lender," 2025, from FFIEC and CFPB HMDA data. https://www.finantrix.com/articles/mortgage-rate-spread-by-lender
Embed the chart:
<a href="https://www.finantrix.com/articles/mortgage-rate-spread-by-lender"><img src="https://www.finantrix.com/atlas/mortgage-rate-spread-by-lender.png?v=2025-12-31" alt="Median mortgage rate spread of the largest US lenders, from Finantrix Atlas"></a>
<p>Chart: <a href="https://www.finantrix.com/articles/mortgage-rate-spread-by-lender">Finantrix Atlas</a>, from HMDA data.</p>
Frequently asked questions
Q: What is a mortgage rate spread? A: The difference between a loan's annual percentage rate and the average prime offer rate for a comparable loan on the date the rate was set, as HMDA defines it. The median on comparable 30-year conventional home purchase loans in 2025 was 0.13 points, according to HMDA data.
Q: What makes a mortgage higher-priced? A: Under Regulation Z, a first-lien loan on a principal dwelling at or below the conforming limit is higher-priced when its rate exceeds the average prime offer rate by 1.5 or more percentage points. 2.0% of comparable loans in 2025 did, according to HMDA data.
Q: Which large lender had the lowest rate spread? A: Among the 50 lenders that made the most comparable loans in 2025, Lennar Mortgage, with a median of −0.97 points, according to HMDA data.
Download the data
Two CSV files, free: the 50 rows on this page, and the full dataset of all 2,341 rows, as of December 31, 2025.
Frequently Asked Questions
What is a mortgage rate spread?
The difference between a loan's annual percentage rate and the average prime offer rate for a comparable loan on the date the rate was set, as HMDA defines it. The median on comparable 30-year conventional home purchase loans in 2025 was 0.13 points, according to HMDA data.
What makes a mortgage higher-priced?
Under Regulation Z, a first-lien loan on a principal dwelling at or below the conforming limit is higher-priced when its rate exceeds the average prime offer rate by 1.5 or more percentage points. 2.0% of comparable loans in 2025 did, according to HMDA data.
Which large lender had the lowest rate spread?
Among the 50 lenders that made the most comparable loans in 2025, Lennar Mortgage, with a median of −0.97 points, according to HMDA data.