
Key Takeaways
- FDIC-insured US banks earned $187 billion in noninterest income in the first half of 2026, 32.4% of their revenue, according to FDIC Call Report data.
- JPMorgan Chase Bank earned the most, $38.7 billion, followed by Bank of America with $16.4 billion; the ten largest earned 65.5% of the total.
- Among banks with $1 billion or more in assets, the median bank earned 14.8% of its revenue from noninterest income, and The Bank of New York Mellon Trust Company the largest share, 97.3%.
- Banks' noninterest income, fiduciary income and service charges for the quarter add up to the FDIC's Quarterly Banking Profile, to the million dollars.
FDIC-insured US banks earned $187 billion in noninterest income in the first half of 2026, 32.4% of their revenue, according to FDIC Call Report data. JPMorgan Chase Bank earned the most, $38.7 billion, followed by Bank of America with $16.4 billion and American Express National Bank with $16.1 billion. The ten largest earned 65.5% of the total.
Noninterest income is what a bank earns other than interest: fees, commissions, trading and gains on sales. The FDIC reports it in four parts. Across all banks in the first half of 2026, fiduciary activities brought in $26.5 billion, service charges on deposit accounts $18.4 billion, and trading gains and fees $38.2 billion. Everything else, $104 billion or 55.5% of the total, is reported together, including card and other fees, investment banking and brokerage, servicing fees, insurance commissions and gains on loan sales.
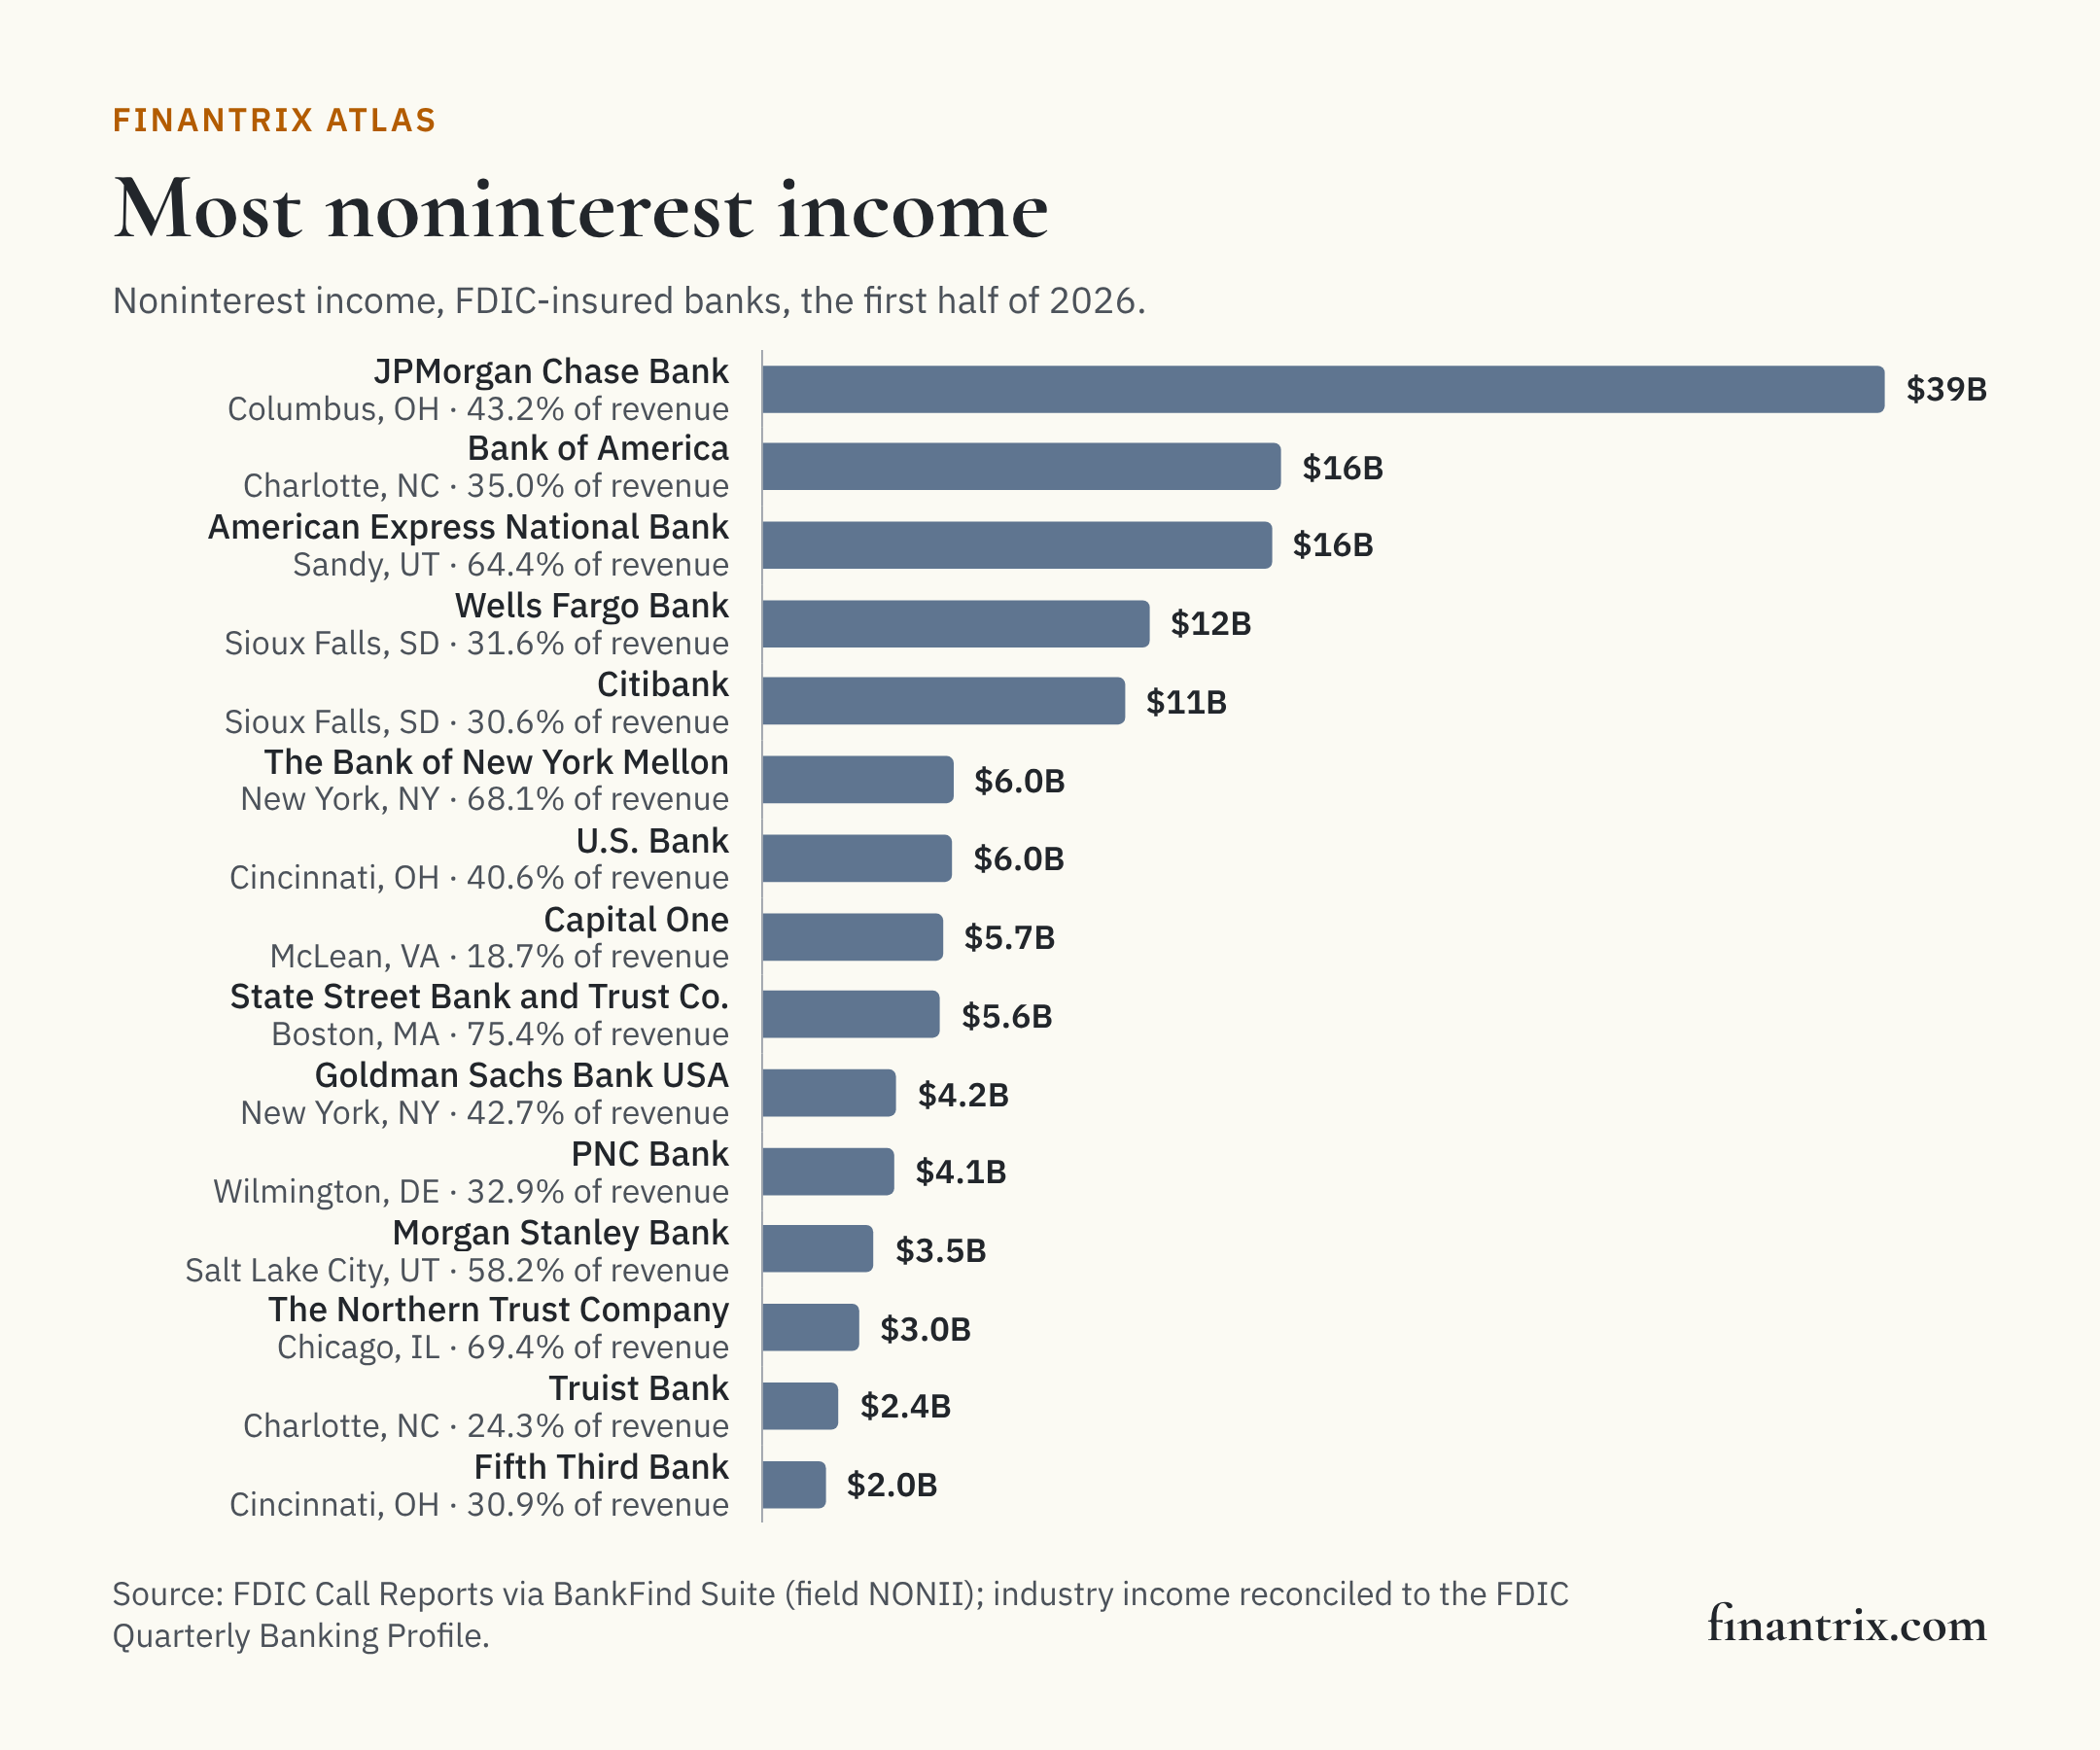
The 50 banks that earn the most noninterest income
Ranked by noninterest income for the first half of 2026. Each row is one bank charter, with the share of its revenue the income makes up and the four parts the FDIC reports.
| Rank | Bank | Headquarters | Noninterest income | Share of revenue | Fiduciary activities | Deposit service charges | Trading gains and fees | All other | Source |
|---|---|---|---|---|---|---|---|---|---|
| 1 | JPMorgan Chase Bank | Columbus, OH | $38.7 billion | 43.2% | $3.3 billion | $3.4 billion | $17.3 billion | $14.7 billion | FDIC |
| 2 | Bank of America | Charlotte, NC | $16.4 billion | 35.0% | $1.4 billion | $2.1 billion | $3.8 billion | $9.1 billion | FDIC |
| 3 | American Express National Bank | Sandy, UT | $16.1 billion | 64.4% | $0 | $2 million | $0 | $16.1 billion | FDIC |
| 4 | Wells Fargo Bank | Sioux Falls, SD | $12.2 billion | 31.6% | $463 million | $2.4 billion | $1.9 billion | $7.4 billion | FDIC |
| 5 | Citibank | Sioux Falls, SD | $11.4 billion | 30.6% | $1.5 billion | $671 million | $7.3 billion | $2.0 billion | FDIC |
| 6 | The Bank of New York Mellon | New York, NY | $6.0 billion | 68.1% | $3.8 billion | $377 million | $566 million | $1.2 billion | FDIC |
| 7 | U.S. Bank | Cincinnati, OH | $6.0 billion | 40.6% | $1.2 billion | $621 million | $327 million | $3.9 billion | FDIC |
| 8 | Capital One | McLean, VA | $5.7 billion | 18.7% | $0 | $58 million | $49 million | $5.6 billion | FDIC |
| 9 | State Street Bank and Trust Company | Boston, MA | $5.6 billion | 75.4% | $3.3 billion | $1 million | $737 million | $1.6 billion | FDIC |
| 10 | Goldman Sachs Bank USA | New York, NY | $4.2 billion | 42.7% | $6 million | $0 | $2.7 billion | $1.5 billion | FDIC |
| 11 | PNC Bank | Wilmington, DE | $4.1 billion | 32.9% | $527 million | $989 million | $207 million | $2.4 billion | FDIC |
| 12 | Morgan Stanley Bank | Salt Lake City, UT | $3.5 billion | 58.2% | $0 | $0 | $1.8 billion | $1.7 billion | FDIC |
| 13 | The Northern Trust Company | Chicago, IL | $3.0 billion | 69.4% | $2.6 billion | $23 million | $186 million | $183 million | FDIC |
| 14 | Truist Bank | Charlotte, NC | $2.4 billion | 24.3% | $225 million | $484 million | $173 million | $1.5 billion | FDIC |
| 15 | Fifth Third Bank | Cincinnati, OH | $2.0 billion | 30.9% | $315 million | $419 million | $177 million | $1.1 billion | FDIC |
| 16 | Northwestern Mutual Wealth Management | Milwaukee, WI | $1.5 billion | 99.4% | $1.5 billion | $2,000 | $0 | $586,000 | FDIC |
| 17 | First-Citizens Bank & Trust Company | Raleigh, NC | $1.5 billion | 30.6% | $56 million | $117 million | $0 | $1.3 billion | FDIC |
| 18 | Santander Bank | Wilmington, DE | $1.3 billion | 47.1% | $197 million | $50 million | $45 million | $1.0 billion | FDIC |
| 19 | Regions Bank | Birmingham, AL | $1.2 billion | 32.4% | $185 million | $341 million | $0 | $695 million | FDIC |
| 20 | The Huntington National Bank | Columbus, OH | $1.2 billion | 22.2% | $133 million | $252 million | $72 million | $719 million | FDIC |
| 21 | Manufacturers and Traders Trust Company | Buffalo, NY | $1.1 billion | 23.7% | $129 million | $206 million | $0 | $809 million | FDIC |
| 22 | KeyBank | Cleveland, OH | $1.1 billion | 30.2% | $174 million | $154 million | $30 million | $774 million | FDIC |
| 23 | Ally Bank | Sandy, UT | $1.1 billion | 23.8% | $0 | $3 million | $0 | $1.1 billion | FDIC |
| 24 | Citizens Bank | Providence, RI | $1.1 billion | 24.7% | $12 million | $217 million | $69 million | $775 million | FDIC |
| 25 | HSBC Bank USA | Tysons, VA | $1.1 billion | 44.4% | $84 million | $110 million | $412 million | $445 million | FDIC |
| 26 | USAA Federal Savings Bank | Phoenix, AZ | $987 million | 27.4% | $0 | $51 million | $0 | $936 million | FDIC |
| 27 | BMO Bank | Chicago, IL | $839 million | 18.5% | $155 million | $261 million | $16 million | $406 million | FDIC |
| 28 | Barclays Bank Delaware | Wilmington, DE | $833 million | 25.7% | $0 | $0 | $-1 million | $834 million | FDIC |
| 29 | Green Dot Bank DBA Bonneville Bank | Provo, UT | $806 million | 85.9% | $0 | $184,000 | $0 | $806 million | FDIC |
| 30 | Credit One Bank | Las Vegas, NV | $796 million | 76.8% | $0 | $0 | $0 | $796 million | FDIC |
| 31 | TD Bank | Wilmington, DE | $782 million | 13.4% | $19 million | $484 million | $-11 million | $290 million | FDIC |
| 32 | SoFi Bank | Cottonwood Heigh, UT | $652 million | 30.7% | $0 | $45,000 | $145,000 | $652 million | FDIC |
| 33 | Western Alliance Bank | Phoenix, AZ | $592 million | 27.4% | $0 | $38 million | $56 million | $498 million | FDIC |
| 34 | Pinnacle Bank | Nashville, TN | $493 million | 20.5% | $61 million | $80 million | $14 million | $337 million | FDIC |
| 35 | Bessemer Trust Company | New York, NY | $489 million | 96.4% | $471 million | $0 | $0 | $19 million | FDIC |
| 36 | BNY Mellon | Pittsburgh, PA | $443 million | 73.3% | $414 million | $0 | $0 | $29 million | FDIC |
| 37 | Zions Bancorporation | Salt Lake City, UT | $424 million | 24.0% | $34 million | $113 million | $-43,000 | $277 million | FDIC |
| 38 | City National Bank | Los Angeles, CA | $407 million | 21.0% | $70 million | $40 million | $-3,000 | $298 million | FDIC |
| 39 | First Horizon Bank | Memphis, TN | $389 million | 22.1% | $32 million | $71 million | $91 million | $195 million | FDIC |
| 40 | TowneBank | Portsmouth, VA | $364 million | 50.4% | $3 million | $9 million | $0 | $352 million | FDIC |
| 41 | Commerce Bank | Kansas City, MO | $353 million | 36.7% | $140 million | $58 million | $11 million | $145 million | FDIC |
| 42 | BOKF | Tulsa, OK | $346 million | 33.3% | $124 million | $53 million | $24 million | $145 million | FDIC |
| 43 | Square Financial Services, Inc. | Salt Lake City, UT | $340 million | 48.5% | $0 | $0 | $0 | $340 million | FDIC |
| 44 | Toyota Financial Savings Bank | Henderson, NV | $331 million | 83.6% | $0 | $0 | $0 | $331 million | FDIC |
| 45 | Morgan Stanley Private Bank | Purchase, NY | $322 million | 12.7% | $0 | $2 million | $0 | $320 million | FDIC |
| 46 | UMB Bank | Kansas City, MO | $321 million | 22.9% | $103 million | $60 million | $10 million | $148 million | FDIC |
| 47 | Mizuho Bank (USA) | New York, NY | $312 million | 88.7% | $8 million | $0 | $136,000 | $304 million | FDIC |
| 48 | Synchrony Bank | Draper, UT | $305 million | 4.2% | $0 | $0 | $0 | $305 million | FDIC |
| 49 | Capital Bank and Trust Company | Irvine, CA | $284 million | 99.0% | $182 million | $0 | $0 | $102 million | FDIC |
| 50 | WEX Bank | Sandy, UT | $270 million | 36.1% | $0 | $0 | $0 | $270 million | FDIC |
Download this table (CSV), free. The full dataset, every insured bank that reports noninterest income with its parts, net interest income and identifiers, is one email away.
Where it is the largest share of revenue
Among the 1,046 banks with $1 billion or more in assets, the median bank earned 14.8% of its revenue from noninterest income. These earn the largest share. The Bank of New York Mellon Trust Company leads at 97.3%, followed by Bessemer Trust Company at 96.4%.
| Rank | Bank | Headquarters | Noninterest income, share of revenue | Noninterest income | Revenue |
|---|---|---|---|---|---|
| 1 | The Bank of New York Mellon Trust Company | Los Angeles, CA | 97.3% | $227 million | $233 million |
| 2 | Bessemer Trust Company | New York, NY | 96.4% | $489 million | $507 million |
| 3 | Bessemer Trust Company | Woodbridge, NJ | 91.1% | $80 million | $88 million |
| 4 | Mizuho Bank (USA) | New York, NY | 88.7% | $312 million | $352 million |
| 5 | Green Dot Bank DBA Bonneville Bank | Provo, UT | 85.9% | $806 million | $939 million |
| 6 | Toyota Financial Savings Bank | Henderson, NV | 83.6% | $331 million | $396 million |
| 7 | The Federal Savings Bank | Chicago, IL | 82.2% | $80 million | $98 million |
| 8 | Cornerstone Capital Bank, SSB | Houston, TX | 77.7% | $143 million | $184 million |
| 9 | Credit One Bank | Las Vegas, NV | 76.8% | $796 million | $1.0 billion |
| 10 | State Street Bank and Trust Company | Boston, MA | 75.4% | $5.6 billion | $7.4 billion |
| 11 | BNY Mellon | Pittsburgh, PA | 73.3% | $443 million | $604 million |
| 12 | The Northern Trust Company | Chicago, IL | 69.4% | $3.0 billion | $4.4 billion |
| 13 | Texas Exchange Bank | Crowley, TX | 69.1% | $69 million | $100 million |
| 14 | First National Bank Texas | Killeen, TX | 69.0% | $172 million | $250 million |
| 15 | The Bank of New York Mellon | New York, NY | 68.1% | $6.0 billion | $8.8 billion |
6 banks of that size with net interest income or noninterest income below zero are left out of this table, because a share of revenue has no plain meaning for them; they remain in the dataset.
What this means for technology buyers
Fee income comes from separate businesses, each with its own systems: trust and custody, payments and cards, brokerage and advice, and servicing loans for others. Growing one means buying for that line, not for the bank as a whole. These guides compare the options side by side:
- Trust accounting systems for banks and trust companies: the books behind fiduciary income.
- Financial BI and dashboarding for bank executives: measuring revenue by line and product.
- Payment gateway solutions for banks: accepting and routing the payments that fees are earned on.
Planning the change before choosing the vendor? The Banking and Payments Capability Matrix states what a bank does, from taking deposits to serving customers, so a platform can be placed against the capabilities it supports.
More from Finantrix Atlas
- US banks by service charges on deposit accounts
- Largest trust banks
- US banks by net interest margin
- Most profitable US banks by return on assets
How this list was built
The universe is every FDIC-insured commercial bank and savings institution that filed a Call Report for June 30, 2026, read from the FDIC's BankFind Suite, including banks whose charter has ended since. Banks are ranked by the FDIC field NONII, total noninterest income, year to date. Its four parts are the FDIC fields IFIDUC (fiduciary activities), ISERCHG (service charges on deposit accounts), IGLTRAD (trading gains and fees) and ADDNONII (additional noninterest income), as the FDIC's field definitions describe them, and for every bank they add up to the total. The share of revenue divides noninterest income by net interest income plus noninterest income for the same period, so it needs no annualizing.
The FDIC's Quarterly Banking Profile, the edition for the second quarter of 2026, prints the industry's income statement for the quarter. Summed across the same 4,238 institutions, the banks' noninterest income, fiduciary income, deposit service charges and net interest income for the quarter equal it to the million dollars.
Limits
- Four parts, not every source. The FDIC's public data reports card fees, interchange and most other fees within one combined figure, so the page does not rank banks by any of them.
- Gains and losses included. Trading results and gains on loan sales can be negative, and a one-off gain moves a bank's total.
- Year to date. The figures cover the first half of 2026.
- Banks, not holding companies. Income earned in a holding company's other subsidiaries, such as a broker-dealer, is not in a bank's Call Report.
Cite this
Free to quote, cite and republish, including the chart, with credit to Finantrix Atlas and a link to this page.
FDIC-insured US banks earned $187 billion in noninterest income in the first half of 2026, 32.4% of their revenue, according to a Finantrix Atlas analysis of FDIC Call Report data.
Suggested citation: Finantrix Atlas, "US Banks by Noninterest Income," data for the first half of 2026, from FDIC Call Reports. https://www.finantrix.com/articles/banks-noninterest-income
Embed the chart:
<a href="https://www.finantrix.com/articles/banks-noninterest-income"><img src="https://www.finantrix.com/atlas/banks-noninterest-income.png?v=2026-06-30" alt="The US banks that earn the most noninterest income, from FDIC data, by Finantrix Atlas"></a>
<p>Chart: <a href="https://www.finantrix.com/articles/banks-noninterest-income">Finantrix Atlas</a>, from FDIC Call Reports.</p>
Frequently asked questions
Q: Which US bank earns the most noninterest income? A: JPMorgan Chase Bank, with $38.7 billion in the first half of 2026, according to its Call Report filed with the FDIC.
Q: How much of bank revenue is noninterest income? A: 32.4% across all FDIC-insured banks in the first half of 2026, according to FDIC data. The median bank with $1 billion or more in assets earned 14.8% of its revenue this way.
Q: What counts as noninterest income? A: Everything a bank earns other than interest: fiduciary income, service charges on deposit accounts, trading gains and fees, and other fees, commissions and gains, as the FDIC reports them.
Download the data
Two CSV files, free: the 50 rows on this page, and the full dataset of all 4,207 rows, as of June 30, 2026.
Frequently Asked Questions
Which US bank earns the most noninterest income?
JPMorgan Chase Bank, with $38.7 billion in the first half of 2026, according to its Call Report filed with the FDIC.
How much of bank revenue is noninterest income?
32.4% across all FDIC-insured banks in the first half of 2026, according to FDIC data. The median bank with $1 billion or more in assets earned 14.8% of its revenue this way.
What counts as noninterest income?
Everything a bank earns other than interest: fiduciary income, service charges on deposit accounts, trading gains and fees, and other fees, commissions and gains, as the FDIC reports them.