
Key Takeaways
- United Wholesale Mortgage made more FHA, VA and USDA home loans than any other US lender in 2025, 159,663, according to HMDA data.
- Government-backed loans were 22% of US mortgage originations in 2025, 1,507,858 loans, according to HMDA data: 906,942 FHA, 561,783 VA and 39,133 USDA.
- Independent mortgage companies made 83.7% of government-backed loans in 2025, according to HMDA filings; banks and credit unions made 10.9%.
- United Wholesale Mortgage led in FHA loans and Veterans United Home Loans in VA loans, according to HMDA data.
United Wholesale Mortgage made 159,663 FHA, VA and USDA home loans in 2025, more than any other US lender, according to HMDA data, followed by Rocket Mortgage and Veterans United Home Loans. Lenders made 1,507,858 government-backed home loans in all, 22% of the 6,827,891 mortgages originated, up 11% from 2024.
Of them, 906,942 were insured by the Federal Housing Administration, 561,783 were guaranteed by the Department of Veterans Affairs, and 39,133 were guaranteed by the Department of Agriculture's rural housing or farm programs, according to HMDA filings. Independent mortgage companies made 83.7% of them.
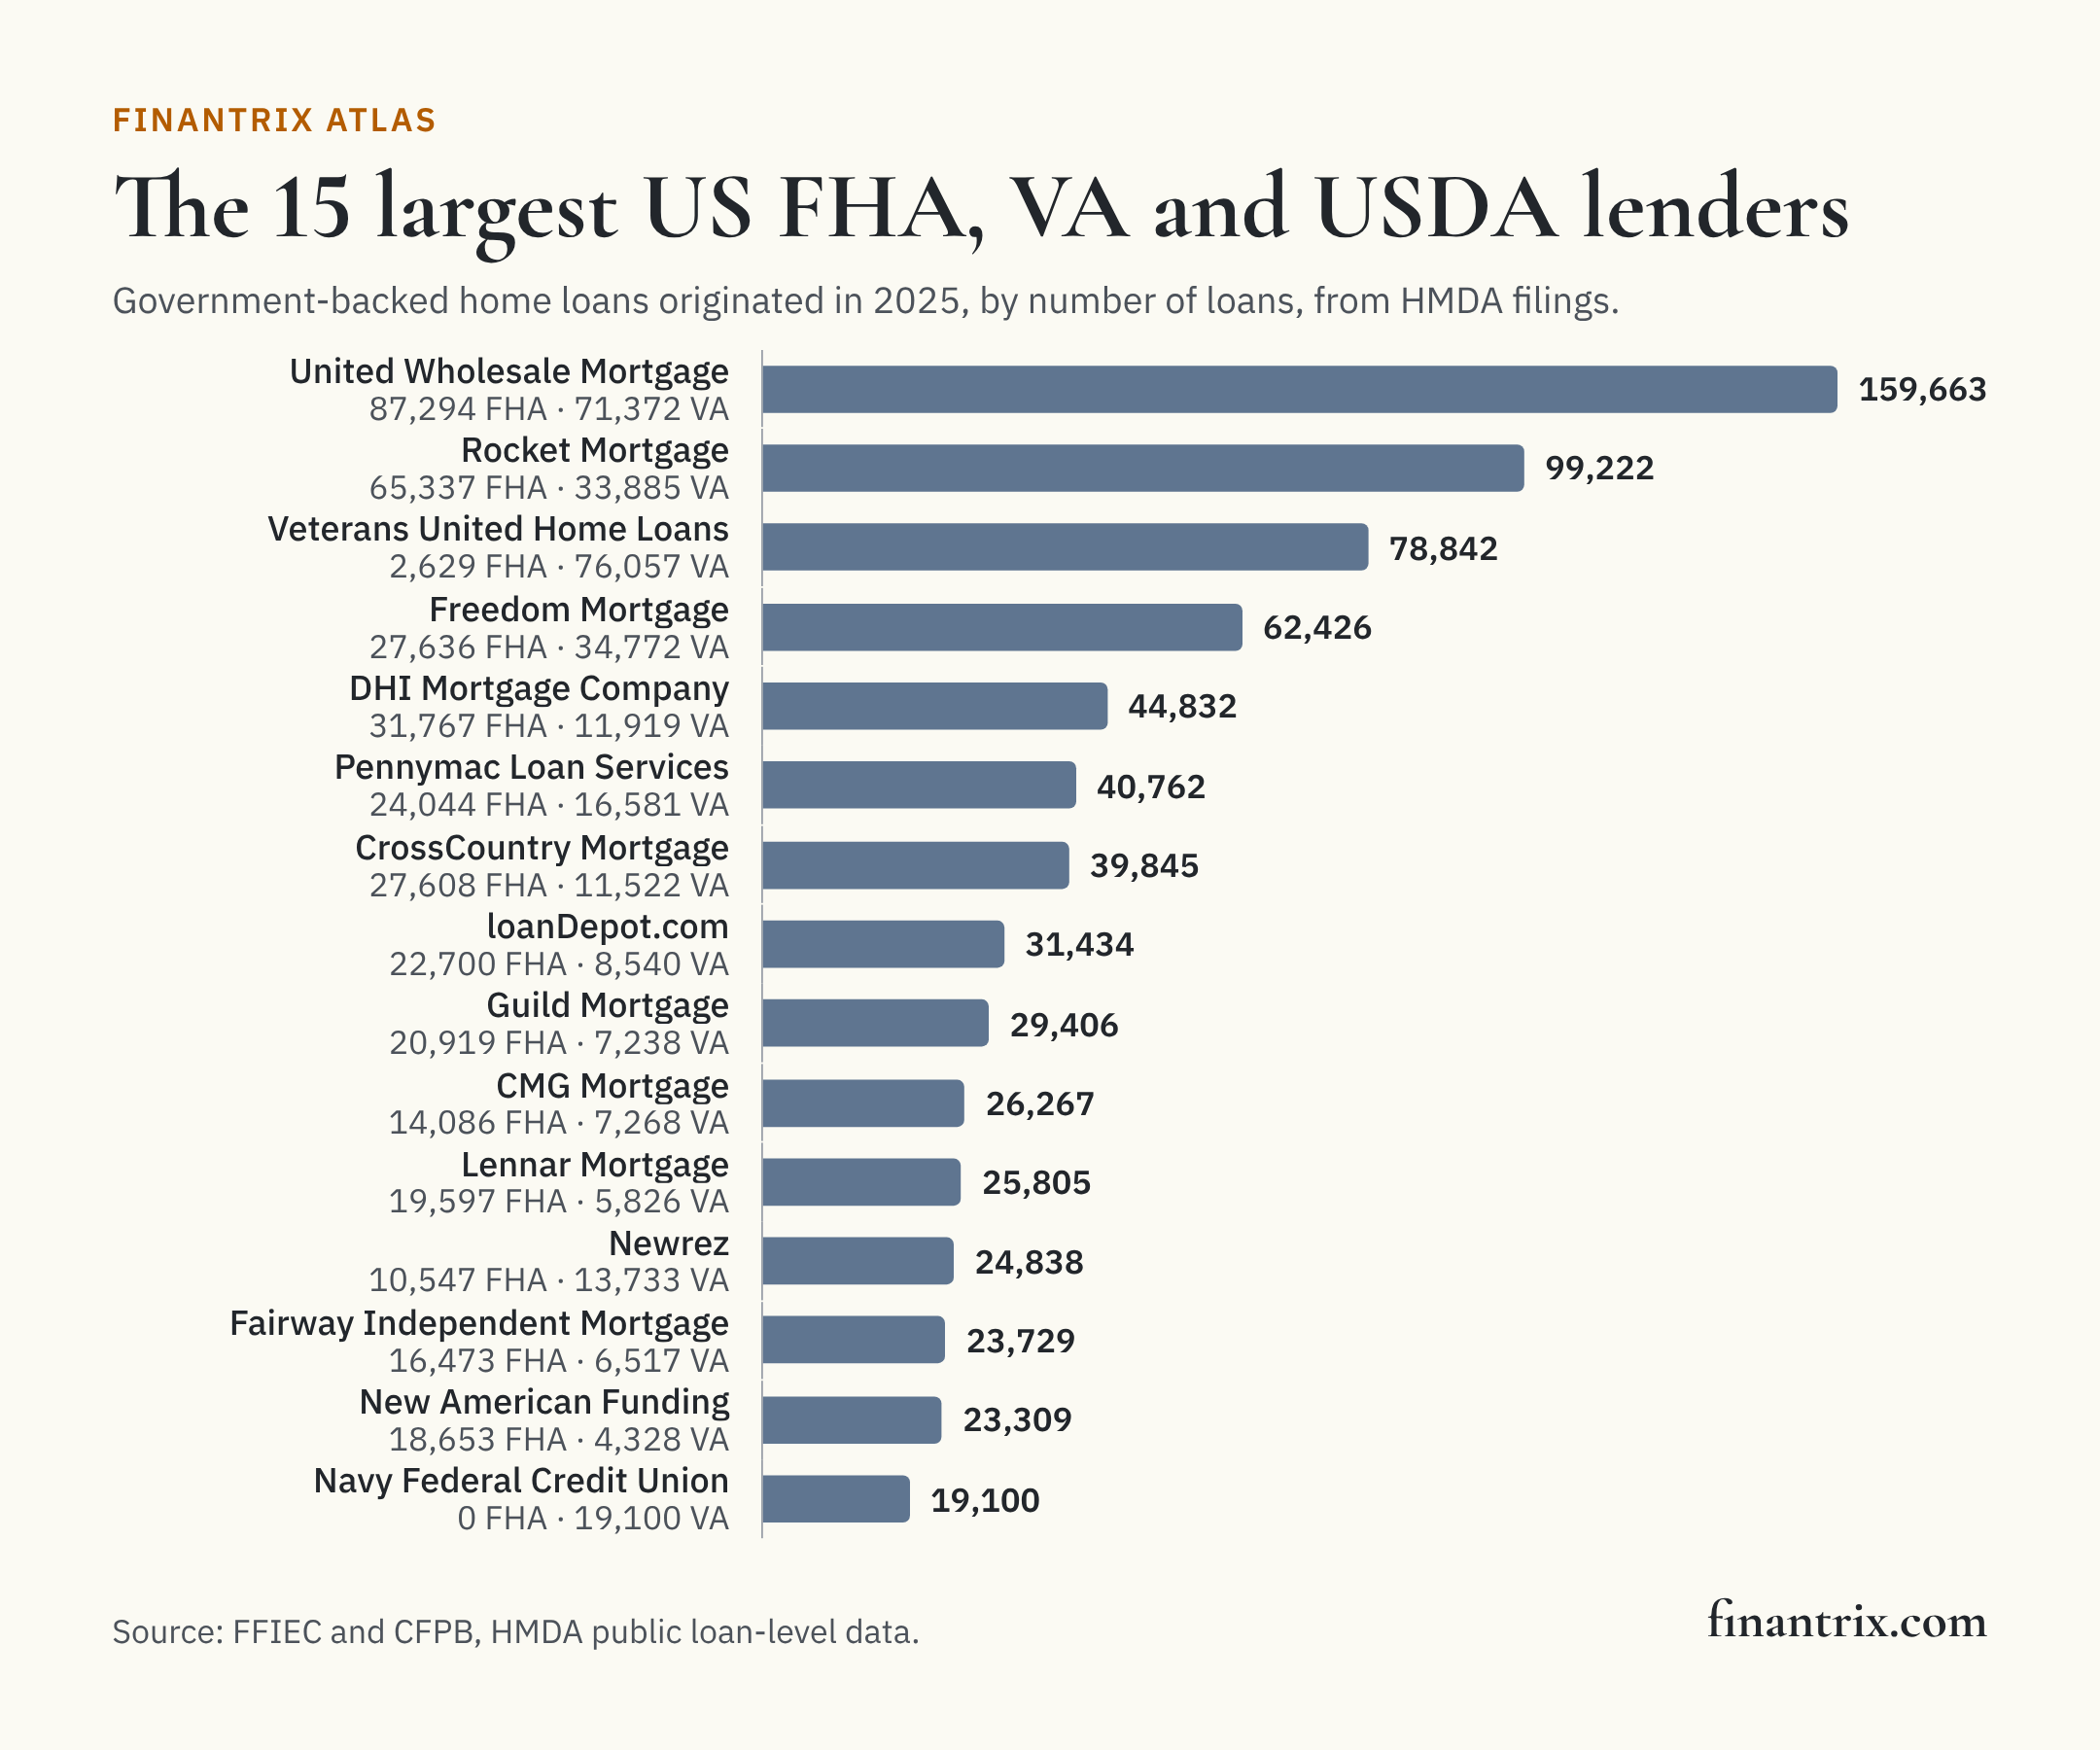
The 50 largest government-backed mortgage lenders
Ranked by FHA, VA and USDA loans originated in 2025, as each lender reported them under the Home Mortgage Disclosure Act. "Share of its originations" is government-backed loans as a share of all the lender's originations; 18 of the 50 made most of their loans this way. Each row is one reporting institution.
| Rank | Lender | Type | FHA, VA and USDA loans | FHA | VA | USDA | Amount | Share of its originations | Change from a year earlier | Source |
|---|---|---|---|---|---|---|---|---|---|---|
| 1 | United Wholesale Mortgage | Independent mortgage company | 159,663 | 87,294 | 71,372 | 997 | $61.6 billion | 38% | +24% | FFIEC |
| 2 | Rocket Mortgage | Independent mortgage company | 99,222 | 65,337 | 33,885 | 0 | $31.5 billion | 23% | +5% | FFIEC |
| 3 | Veterans United Home Loans | Independent mortgage company | 78,842 | 2,629 | 76,057 | 156 | $26.6 billion | 95% | +12% | FFIEC |
| 4 | Freedom Mortgage | Independent mortgage company | 62,426 | 27,636 | 34,772 | 18 | $21.5 billion | 89% | +23% | FFIEC |
| 5 | DHI Mortgage Company | Bank- or credit union-affiliated | 44,832 | 31,767 | 11,919 | 1,146 | $15.7 billion | 65% | +5% | FFIEC |
| 6 | Pennymac Loan Services | Independent mortgage company | 40,762 | 24,044 | 16,581 | 137 | $14.4 billion | 40% | +35% | FFIEC |
| 7 | CrossCountry Mortgage | Independent mortgage company | 39,845 | 27,608 | 11,522 | 715 | $14.0 billion | 32% | +21% | FFIEC |
| 8 | loanDepot.com | Independent mortgage company | 31,434 | 22,700 | 8,540 | 194 | $10.4 billion | 34% | +7% | FFIEC |
| 9 | Guild Mortgage | Independent mortgage company | 29,406 | 20,919 | 7,238 | 1,249 | $9.6 billion | 34% | +17% | FFIEC |
| 10 | CMG Mortgage | Independent mortgage company | 26,267 | 14,086 | 7,268 | 4,913 | $8.5 billion | 37% | +21% | FFIEC |
| 11 | Lennar Mortgage | Independent mortgage company | 25,805 | 19,597 | 5,826 | 382 | $8.8 billion | 45% | +18% | FFIEC |
| 12 | Newrez | Independent mortgage company | 24,838 | 10,547 | 13,733 | 558 | $9.5 billion | 37% | +33% | FFIEC |
| 13 | Fairway Independent Mortgage | Independent mortgage company | 23,729 | 16,473 | 6,517 | 739 | $7.6 billion | 32% | +2% | FFIEC |
| 14 | New American Funding | Independent mortgage company | 23,309 | 18,653 | 4,328 | 328 | $6.9 billion | 41% | +21% | FFIEC |
| 15 | Navy Federal Credit Union | Credit union | 19,100 | 0 | 19,100 | 0 | $7.5 billion | 24% | +12% | FFIEC |
| 16 | Movement Mortgage | Independent mortgage company | 18,632 | 11,656 | 6,668 | 308 | $6.5 billion | 32% | −3% | FFIEC |
| 17 | Guaranteed Rate | Independent mortgage company | 17,759 | 10,677 | 6,768 | 314 | $6.7 billion | 25% | +15% | FFIEC |
| 18 | Mutual of Omaha Mortgage | Independent mortgage company | 13,232 | 10,518 | 2,685 | 29 | $3.7 billion | 55% | +15% | FFIEC |
| 19 | Union Home Mortgage | Independent mortgage company | 12,101 | 8,048 | 3,392 | 661 | $3.6 billion | 32% | +48% | FFIEC |
| 20 | Equity Prime Mortgage | Independent mortgage company | 11,563 | 6,940 | 3,637 | 986 | $3.4 billion | 96% | +14% | FFIEC |
| 21 | Kind Lending | Independent mortgage company | 10,909 | 7,692 | 2,736 | 481 | $4.0 billion | 37% | +70% | FFIEC |
| 22 | Village Capital & Investment | Independent mortgage company | 10,837 | 3,255 | 7,566 | 16 | $4.1 billion | 100% | −6% | FFIEC |
| 23 | Planet Home Lending | Independent mortgage company | 10,467 | 5,823 | 4,532 | 112 | $3.6 billion | 72% | +52% | FFIEC |
| 24 | Paramount Residential Mortgage Group | Independent mortgage company | 9,776 | 7,515 | 1,806 | 455 | $3.7 billion | 42% | +5% | FFIEC |
| 25 | American Pacific Mortgage | Independent mortgage company | 9,721 | 7,137 | 2,184 | 400 | $3.3 billion | 39% | +24% | FFIEC |
| 26 | Nationstar Mortgage | Independent mortgage company | 8,691 | 5,480 | 3,211 | 0 | $2.7 billion | 17% | −2% | FFIEC |
| 27 | New DAY Financial | Independent mortgage company | 8,390 | 49 | 8,341 | 0 | $2.4 billion | 100% | +17% | FFIEC |
| 28 | Lakeview Loan Servicing | Independent mortgage company | 8,228 | 5,048 | 3,180 | 0 | $3.0 billion | 50% | +16% | FFIEC |
| 29 | USAA Federal Savings Bank | Bank | 7,648 | 0 | 7,648 | 0 | $2.9 billion | 65% | −10% | FFIEC |
| 30 | Carrington Mortgage Services | Independent mortgage company | 7,648 | 5,141 | 2,492 | 15 | $2.2 billion | 51% | +1% | FFIEC |
| 31 | PrimeLending, A PlainsCapital | Bank- or credit union-affiliated | 7,385 | 4,862 | 2,274 | 249 | $2.5 billion | 30% | +3% | FFIEC |
| 32 | NVR Mortgage Finance | Independent mortgage company | 7,229 | 4,857 | 2,214 | 158 | $2.8 billion | 44% | −5% | FFIEC |
| 33 | Ark-La-Tex Financial Services | Independent mortgage company | 6,965 | 4,395 | 2,314 | 256 | $2.3 billion | 45% | −8% | FFIEC |
| 34 | American Financial Resources | Independent mortgage company | 6,909 | 4,846 | 1,590 | 473 | $2.1 billion | 60% | +98% | FFIEC |
| 35 | Flat Branch Mortgage | Independent mortgage company | 6,680 | 4,062 | 1,626 | 992 | $1.6 billion | 43% | +16% | FFIEC |
| 36 | Lower | Independent mortgage company | 6,650 | 4,731 | 1,798 | 121 | $2.2 billion | 37% | +8% | FFIEC |
| 37 | American Financial Network | Independent mortgage company | 6,590 | 5,106 | 1,331 | 153 | $2.3 billion | 50% | +18% | FFIEC |
| 38 | NFM | Independent mortgage company | 6,470 | 4,609 | 1,817 | 44 | $2.5 billion | 34% | +7% | FFIEC |
| 39 | Plaza Home Mortgage | Independent mortgage company | 6,267 | 4,502 | 1,489 | 276 | $2.0 billion | 43% | +9% | FFIEC |
| 40 | Finance of America Reverse | Independent mortgage company | 6,075 | 6,075 | 0 | 0 | $1.5 billion | 70% | −12% | FFIEC |
| 41 | Click n' Close | Independent mortgage company | 6,053 | 4,976 | 543 | 534 | $1.8 billion | 56% | +22% | FFIEC |
| 42 | AmeriSave Mortgage | Independent mortgage company | 5,804 | 4,774 | 1,030 | 0 | $1.4 billion | 24% | +38% | FFIEC |
| 43 | Cardinal Financial Company | Independent mortgage company | 5,784 | 4,856 | 857 | 71 | $1.7 billion | 46% | −23% | FFIEC |
| 44 | Prosperity Home Mortgage | Independent mortgage company | 5,780 | 3,315 | 2,403 | 62 | $2.1 billion | 28% | +7% | FFIEC |
| 45 | Everett Financial | Independent mortgage company | 5,778 | 4,752 | 890 | 136 | $1.8 billion | 36% | +8% | FFIEC |
| 46 | Mortgage Solutions of Colorado | Independent mortgage company | 5,704 | 1,127 | 4,544 | 33 | $1.8 billion | 91% | +8% | FFIEC |
| 47 | Sun West Mortgage Company | Independent mortgage company | 5,644 | 3,575 | 1,990 | 79 | $2.0 billion | 63% | +15% | FFIEC |
| 48 | The Federal Savings Bank | Bank | 5,211 | 1,035 | 4,160 | 16 | $2.0 billion | 63% | +2% | FFIEC |
| 49 | Pulte Mortgage | Independent mortgage company | 5,144 | 2,917 | 2,181 | 46 | $2.2 billion | 27% | +2% | FFIEC |
| 50 | American Neighborhood Mortgage Acceptance Company | Independent mortgage company | 5,075 | 3,347 | 1,647 | 81 | $1.8 billion | 42% | +19% | FFIEC |
Download this table (CSV), free. The full dataset, every HMDA filer with its FHA, VA, USDA and conventional originations and amounts, is one email away.
The largest FHA lenders
United Wholesale Mortgage made 87,294 FHA-insured loans in 2025, 9.6% of the 906,942 reported, according to HMDA data.
| Rank | Lender | Loans | Amount | Share of the program |
|---|---|---|---|---|
| 1 | United Wholesale Mortgage | 87,294 | $30.3 billion | 9.6% |
| 2 | Rocket Mortgage | 65,337 | $18.2 billion | 7.2% |
| 3 | DHI Mortgage Company | 31,767 | $11.0 billion | 3.5% |
| 4 | Freedom Mortgage | 27,636 | $8.4 billion | 3.0% |
| 5 | CrossCountry Mortgage | 27,608 | $8.7 billion | 3.0% |
| 6 | Pennymac Loan Services | 24,044 | $7.4 billion | 2.7% |
| 7 | loanDepot.com | 22,700 | $6.9 billion | 2.5% |
| 8 | Guild Mortgage | 20,919 | $6.4 billion | 2.3% |
| 9 | Lennar Mortgage | 19,597 | $6.5 billion | 2.2% |
| 10 | New American Funding | 18,653 | $5.2 billion | 2.1% |
The largest VA lenders
Veterans United Home Loans made 76,057 VA-guaranteed loans in 2025, 13.5% of the 561,783 reported, according to HMDA data.
| Rank | Lender | Loans | Amount | Share of the program |
|---|---|---|---|---|
| 1 | Veterans United Home Loans | 76,057 | $25.9 billion | 13.5% |
| 2 | United Wholesale Mortgage | 71,372 | $31.0 billion | 12.7% |
| 3 | Freedom Mortgage | 34,772 | $13.1 billion | 6.2% |
| 4 | Rocket Mortgage | 33,885 | $13.3 billion | 6.0% |
| 5 | Navy Federal Credit Union | 19,100 | $7.5 billion | 3.4% |
| 6 | Pennymac Loan Services | 16,581 | $6.9 billion | 3.0% |
| 7 | Newrez | 13,733 | $6.0 billion | 2.4% |
| 8 | DHI Mortgage Company | 11,919 | $4.3 billion | 2.1% |
| 9 | CrossCountry Mortgage | 11,522 | $5.1 billion | 2.1% |
| 10 | loanDepot.com | 8,540 | $3.4 billion | 1.5% |
Who makes government-backed loans
According to HMDA filings for 2025, independent mortgage companies made 83.7% of FHA, VA and USDA loans, banks 8.8%, credit unions 2.1%, and mortgage companies owned by or affiliated with a bank or credit union 5.4%. The ten largest lenders made 41% of all government-backed loans, and the 50 in the table made 68%.
What this means for technology buyers
A government-backed loan carries its program's own eligibility, documentation and insurance or guarantee steps on top of an ordinary mortgage, and the lender's systems have to handle them. These guides compare the options side by side:
- Loan origination systems for mortgage banks: taking, underwriting and closing a home loan, government programs included.
- Credit decision engines for consumer lending: the rules behind an approval.
- Loan servicing platforms: payments, escrow and loss mitigation once the loan closes.
Mapping the business? The Banking and Payments Capability Matrix covers retail lending, where mortgage origination sits, alongside the rest of a bank.
More from Finantrix Atlas
- Largest mortgage lenders in the US
- Bank and nonbank shares of mortgage lending
- Mortgage denial rates by lender
- Largest HELOC lenders
How this list was built
The universe is every institution in the FFIEC's public HMDA loan-level file for 2025, the same file as our ranking of the largest mortgage lenders. A loan is counted when the lender originated it, and its program is HMDA's loan type field: FHA-insured, VA-guaranteed, or USDA Rural Housing Service or Farm Service Agency guaranteed. Each lender's type comes from the FDIC's and NCUA's records first and the FFIEC's own lender codes after them, as on our page on banks and nonbanks in mortgage lending.
The file's total originations match the FFIEC Data Browser's national count for both years, each lender's record count matches the FFIEC's filer list, and the originations of each loan type match the Data Browser's own counts by loan type, to the loan.
Limits
- Lenders below HMDA's thresholds are missing. Small lenders that do not report under HMDA are not counted, so the totals understate the market slightly; the ranking is complete at the top.
- Originations, not servicing. A lender that sells the loans it makes is ranked on what it made, not on what it services or holds.
- Lenders, not groups. A bank and its mortgage subsidiary file separately and are ranked separately.
- Amounts are rounded. The FFIEC's public file rounds each loan amount to the midpoint of a $10,000 band. The data are for 2025.
Cite this
Free to quote, cite and republish, including the chart, with credit to Finantrix Atlas and a link to this page.
United Wholesale Mortgage made 159,663 FHA, VA and USDA home loans in 2025, the most of any US lender, according to a Finantrix Atlas analysis of HMDA data.
Independent mortgage companies made 83.7% of US government-backed home loans in 2025, according to Finantrix Atlas.
Suggested citation: Finantrix Atlas, "Largest FHA and VA Lenders in the US," 2025, from FFIEC and CFPB HMDA data. https://www.finantrix.com/articles/largest-fha-va-lenders
Embed the chart:
<a href="https://www.finantrix.com/articles/largest-fha-va-lenders"><img src="https://www.finantrix.com/atlas/largest-fha-va-lenders.png?v=2025-12-31" alt="The largest US FHA, VA and USDA lenders, from Finantrix Atlas"></a>
<p>Chart: <a href="https://www.finantrix.com/articles/largest-fha-va-lenders">Finantrix Atlas</a>, from HMDA data.</p>
Frequently asked questions
Q: Who is the largest FHA lender? A: United Wholesale Mortgage, which made 87,294 FHA-insured home loans in 2025, according to HMDA data.
Q: Who is the largest VA lender? A: Veterans United Home Loans, which made 76,057 VA-guaranteed home loans in 2025, according to HMDA data.
Q: How many FHA and VA loans were made in 2025? A: According to HMDA filings, 906,942 FHA loans and 561,783 VA loans, with 39,133 USDA loans, 22% of all mortgage originations.
Q: Do banks or mortgage companies make most FHA and VA loans? A: Independent mortgage companies made 83.7% of government-backed loans in 2025, according to HMDA data, and banks and credit unions 10.9%.
Download the data
Two CSV files, free: the 50 rows on this page, and the full dataset of all 1,507 rows, as of December 31, 2025.
Frequently Asked Questions
Who is the largest FHA lender?
United Wholesale Mortgage, which made 87,294 FHA-insured home loans in 2025, according to HMDA data.
Who is the largest VA lender?
Veterans United Home Loans, which made 76,057 VA-guaranteed home loans in 2025, according to HMDA data.
How many FHA and VA loans were made in 2025?
According to HMDA filings, 906,942 FHA loans and 561,783 VA loans, with 39,133 USDA loans, 22% of all mortgage originations.
Do banks or mortgage companies make most FHA and VA loans?
Independent mortgage companies made 83.7% of government-backed loans in 2025, according to HMDA data, and banks and credit unions 10.9%.