
Key Takeaways
- 273 of the 2,440 FDIC-insured US banks that report total risk-based capital hold commercial real estate loans of 300% or more of that capital, the level named in the interagency CRE guidance, according to FDIC Call Report data for June 30, 2026.
- 64 of them also grew their CRE loans by 50% or more over the prior three years, which together make the guidance's second criterion; 160 banks hold construction and land loans of 100% or more of total capital, its first.
- Tioga-Franklin Savings Bank reports the highest ratio, 822% of total capital; the median bank in the ranking reports 158%, according to FDIC data.
- The guidance describes these levels as indicators that may identify a bank for further supervisory analysis, not limits on lending.
273 of the 2,440 FDIC-insured US banks that report total risk-based capital hold commercial real estate loans of 300% or more of that capital, according to FDIC Call Report data for June 30, 2026. That is the level named in the interagency guidance on commercial real estate concentrations, measured the way the guidance measures it. Tioga-Franklin Savings Bank reports the highest ratio, 822%, followed by Nano Banc at 755% and River City Bank at 649%. Tioga-Franklin Savings Bank and Nano Banc have since closed, according to the FDIC; the figures are from their Call Reports for June 30, 2026. The median bank in the ranking reports 158%.
The guidance sets out two supervisory criteria. A bank meets the first if its construction, land development and other land loans are 100% or more of total capital: 160 banks do. It meets the second if its commercial real estate loans are 300% or more of total capital and the portfolio has grown by 50% or more over the prior thirty-six months: 64 banks do. 205 meet at least one of the two. The guidance says the criteria "do not constitute limits on an institution's lending activity"; a bank near or above them "may be identified for further supervisory analysis".
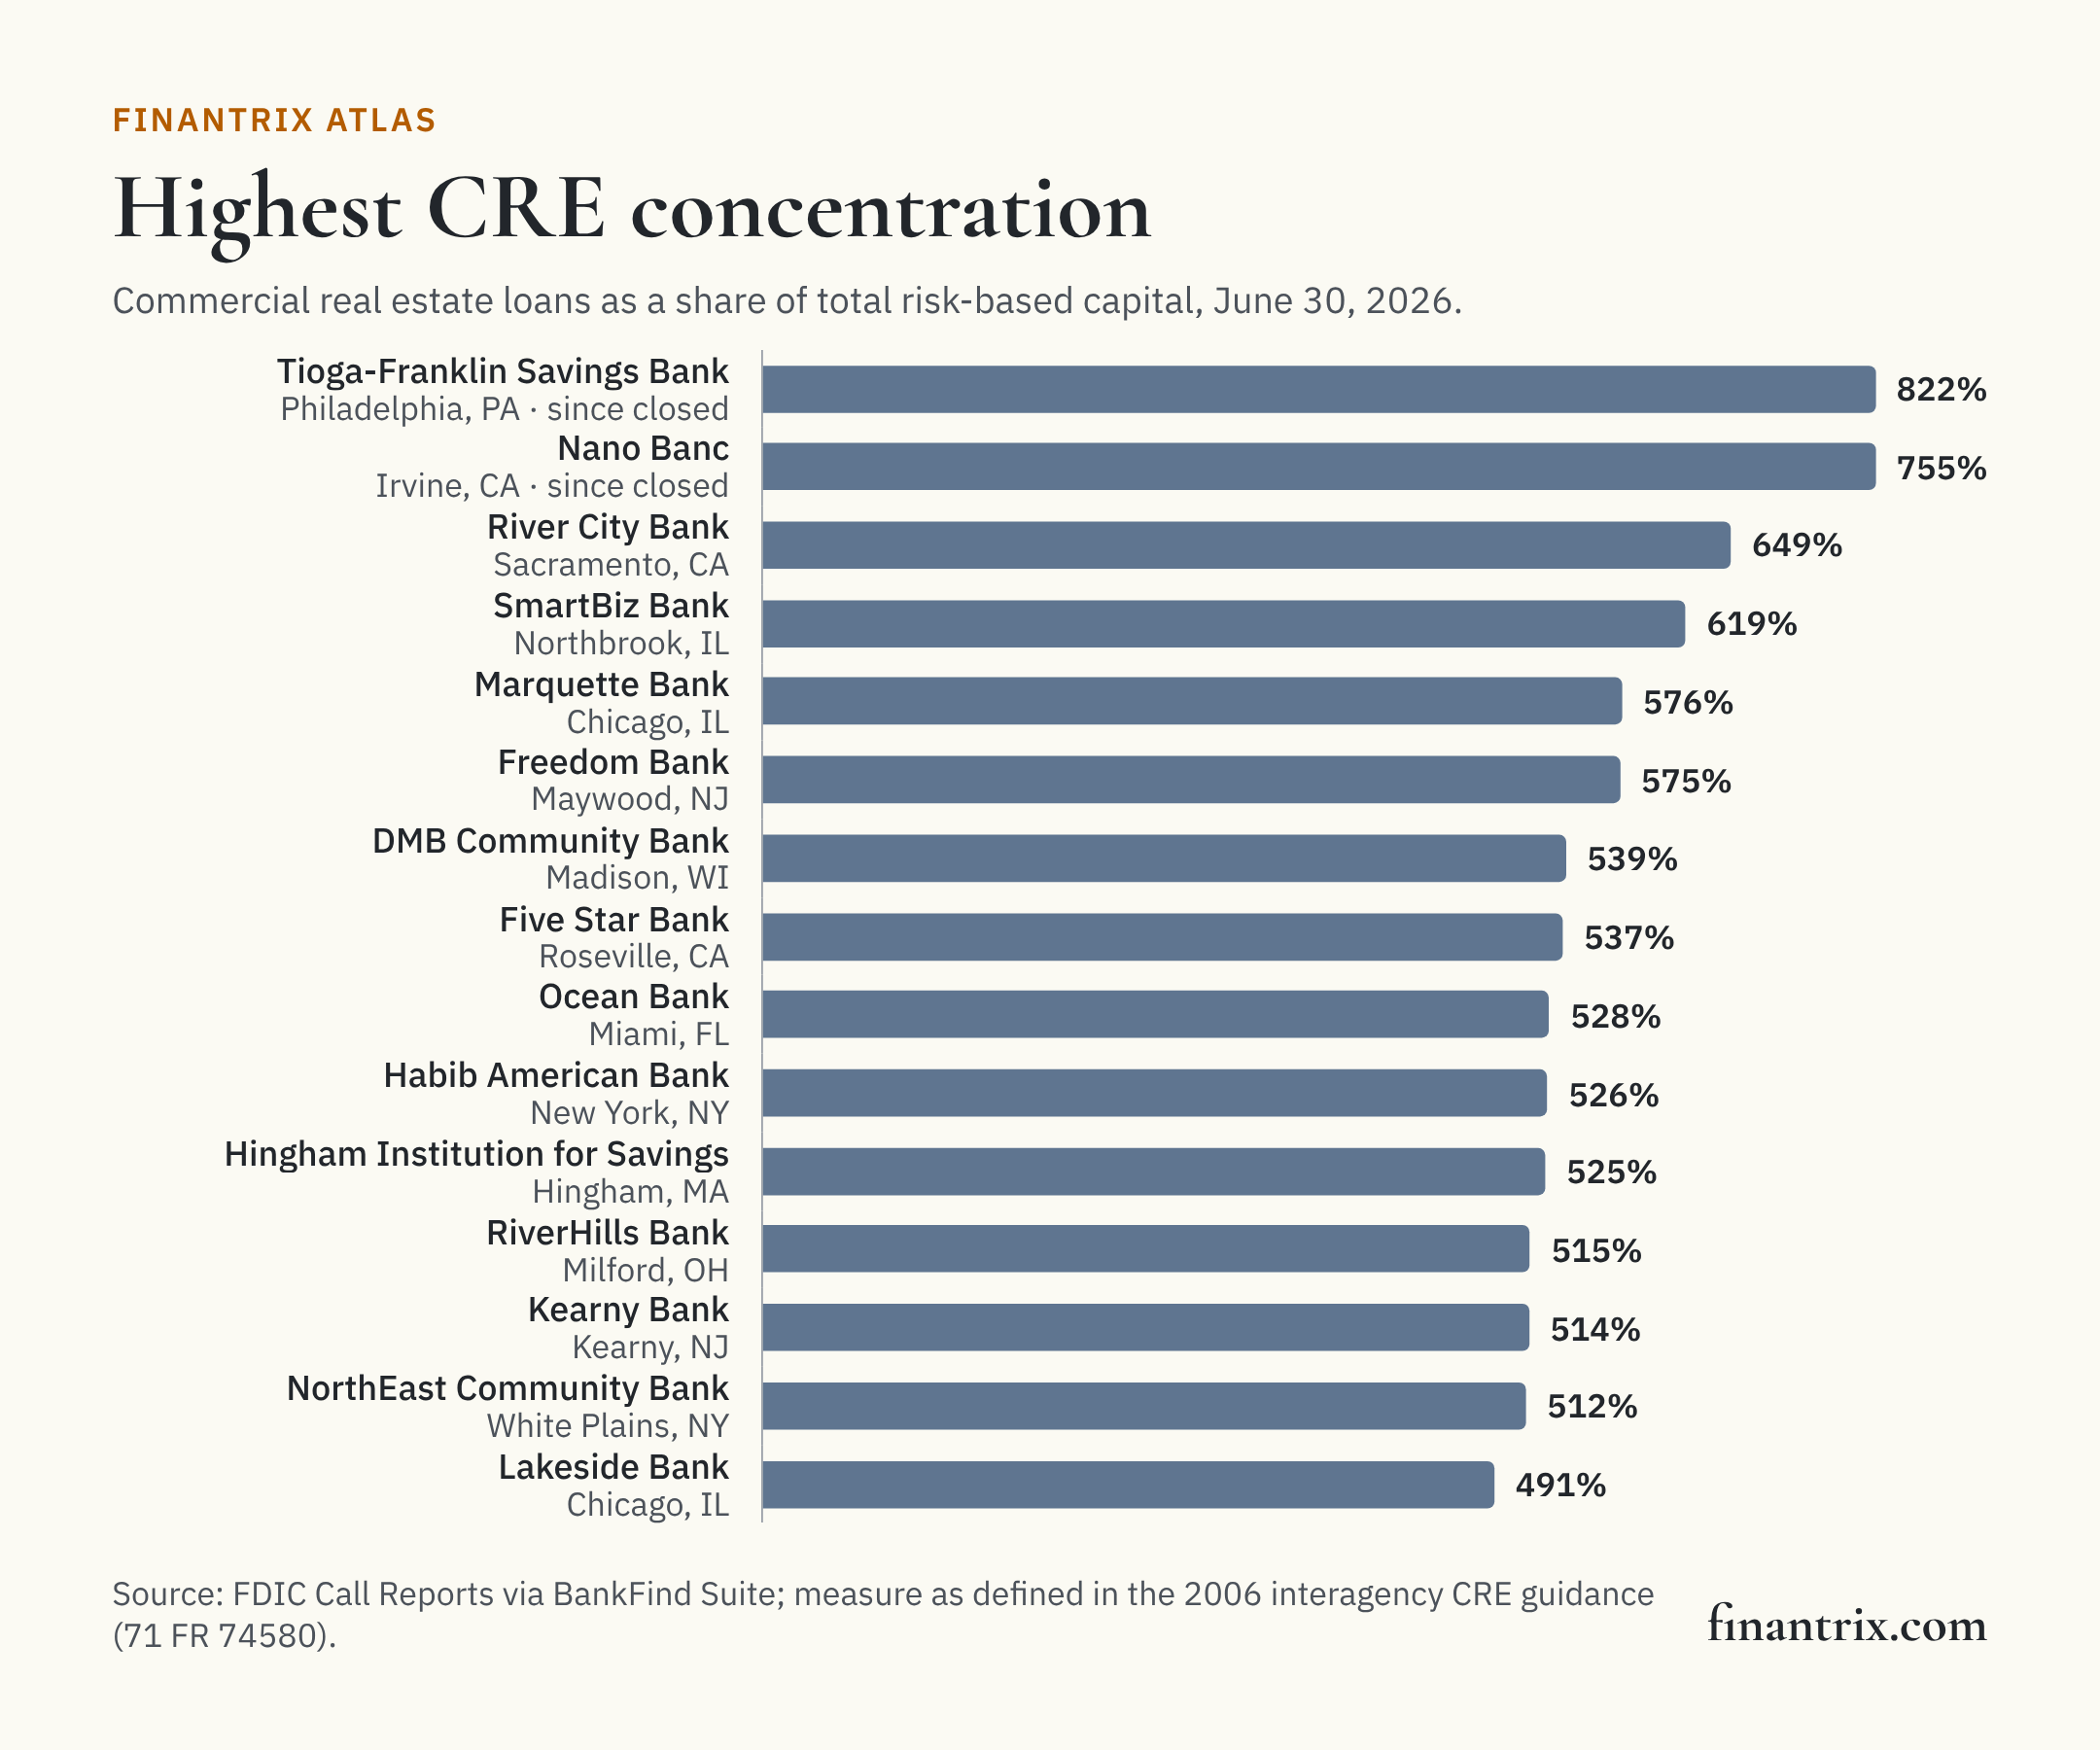
The 50 banks with the highest commercial real estate concentration
Ranked by commercial real estate loans as a share of total risk-based capital on June 30, 2026. Each row is one bank charter, with its construction and land ratio, the first criterion, and the growth in its commercial real estate loans since June 30, 2023, which the second criterion pairs with the 300% level. The ratio needed to make this list is 419%.
| Rank | Bank | Headquarters | CRE loans, share of total capital | Construction and land, share of total capital | CRE growth, three years | CRE loans | Total risk-based capital | Source |
|---|---|---|---|---|---|---|---|---|
| 1 | Tioga-Franklin Savings Bank ‡ | Philadelphia, PA | 822% | 66% | +33% | $17 million | $2 million | FDIC |
| 2 | Nano Banc ‡ | Irvine, CA | 755% | 102% | -39% | $348 million | $46 million | FDIC |
| 3 | River City Bank | Sacramento, CA | 649% | 7% | +45% | $4.0 billion | $620 million | FDIC |
| 4 | SmartBiz Bank | Northbrook, IL | 619% | 37% | +86% | $109 million | $18 million | FDIC |
| 5 | Marquette Bank | Chicago, IL | 576% | 34% | -2% | $1.1 billion | $190 million | FDIC |
| 6 | Freedom Bank | Maywood, NJ | 575% | 102% | +40% | $503 million | $87 million | FDIC |
| 7 | DMB Community Bank | Madison, WI | 539% | 1% | -1% | $535 million | $99 million | FDIC |
| 8 | Five Star Bank | Roseville, CA | 537% | 25% | +45% | $3.1 billion | $585 million | FDIC |
| 9 | Ocean Bank | Miami, FL | 528% | 38% | +27% | $4.4 billion | $836 million | FDIC |
| 10 | Habib American Bank | New York, NY | 526% | 0% | +52% | $1.4 billion | $275 million | FDIC |
| 11 | Hingham Institution for Savings | Hingham, MA | 525% | 42% | +9% | $2.8 billion | $537 million | FDIC |
| 12 | RiverHills Bank | Milford, OH | 515% | 64% | +62% | $206 million | $40 million | FDIC |
| 13 | Kearny Bank | Kearny, NJ | 514% | 37% | -4% | $3.7 billion | $716 million | FDIC |
| 14 | NorthEast Community Bank | White Plains, NY | 512% | 398% | +40% | $1.8 billion | $352 million | FDIC |
| 15 | Lakeside Bank | Chicago, IL | 491% | 137% | +21% | $1.7 billion | $343 million | FDIC |
| 16 | Northeast Bank | Portland, ME | 485% | 4% | +77% | $3.2 billion | $660 million | FDIC |
| 17 | Citizens Bank | Kilgore, TX | 485% | 164% | +43% | $184 million | $38 million | FDIC |
| 18 | Prime Security Bank | Karlstad, MN | 484% | 42% | +16% | $66 million | $14 million | FDIC |
| 19 | Liberty Bank | Irvine, CA | 480% | 30% | -29% | $282 million | $59 million | FDIC |
| 20 | First National Bank of Michigan | Kalamazoo, MI | 480% | 45% | +31% | $499 million | $104 million | FDIC |
| 21 | Bridgewater Bank | Saint Louis Park, MN | 477% | 34% | +15% | $3.2 billion | $676 million | FDIC |
| 22 | Spencer Savings Bank, SLA | Elmwood Park, NJ | 476% | 18% | +6% | $2.3 billion | $480 million | FDIC |
| 23 | Malaga Bank F.S.B. | Palos Verdes Pen, CA | 473% | 0% | -3% | $1.2 billion | $246 million | FDIC |
| 24 | Commercial Bank of California | Irvine, CA | 472% | 28% | +81% | $1.9 billion | $403 million | FDIC |
| 25 | Crown Bank | Edina, MN | 469% | 47% | +23% | $183 million | $39 million | FDIC |
| 26 | River Bank | Stoddard, WI | 465% | 31% | -1% | $625 million | $134 million | FDIC |
| 27 | Everett Co-operative Bank | Everett, MA | 463% | 55% | +53% | $802 million | $173 million | FDIC |
| 28 | First Commerce Bank | Lakewood, NJ | 461% | 55% | +44% | $967 million | $210 million | FDIC |
| 29 | Genesis Bank | Newport Beach, CA | 459% | 0% | +68% | $204 million | $44 million | FDIC |
| 30 | First Resource Bank | Exton, PA | 454% | 135% | +67% | $347 million | $76 million | FDIC |
| 31 | Parkway Bank and Trust Company | Harwood Heights, IL | 454% | 44% | +3% | $2.0 billion | $441 million | FDIC |
| 32 | First Federal Savings and Loan Association of San Rafael | San Rafael, CA | 454% | 2% | -6% | $193 million | $43 million | FDIC |
| 33 | Freedom Financial Bank | West Des Moines, IA | 453% | 30% | +24% | $127 million | $28 million | FDIC |
| 34 | Pacific Crest Bank | Lynnwood, WA | 449% | 82% | +7% | $173 million | $39 million | FDIC |
| 35 | Enterprise Bank | Omaha, NE | 448% | 72% | +16% | $318 million | $71 million | FDIC |
| 36 | First Carolina Bank | Rocky Mount, NC | 448% | 81% | +27% | $1.8 billion | $402 million | FDIC |
| 37 | International Finance Bank | Miami, FL | 448% | 31% | +76% | $668 million | $149 million | FDIC |
| 38 | Carver Federal Savings Bank | New York, NY | 442% | 8% | -6% | $283 million | $64 million | FDIC |
| 39 | Great Southern Bank | Reeds Spring, MO | 441% | 58% | +0% | $3.1 billion | $695 million | FDIC |
| 40 | Waterfall Bank | Clearwater, FL | 441% | 69% | +164% | $247 million | $56 million | FDIC |
| 41 | ConnectOne Bank | Englewood Cliffs, NJ | 439% | 53% | +36% | $7.1 billion | $1.6 billion | FDIC |
| 42 | Apple Bank | New York, NY | 436% | 0% | +5% | $6.8 billion | $1.6 billion | FDIC |
| 43 | American Bank | Allentown, PA | 435% | 53% | +33% | $539 million | $124 million | FDIC |
| 44 | United Fidelity Bank, fsb | Evansville, IN | 432% | 1% | -10% | $3.1 billion | $728 million | FDIC |
| 45 | The Park Bank | Madison, WI | 430% | 39% | +14% | $788 million | $183 million | FDIC |
| 46 | Provident Bank | Jersey City, NJ | 428% | 26% | +77% | $11.9 billion | $2.8 billion | FDIC |
| 47 | Peapack Private Bank & Trust | Bedminster, NJ | 427% | 3% | +12% | $3.3 billion | $775 million | FDIC |
| 48 | Trustar Bank | Great Falls, VA | 422% | 144% | +91% | $501 million | $119 million | FDIC |
| 49 | Alma Bank | Astoria, NY | 422% | 16% | +9% | $745 million | $177 million | FDIC |
| 50 | Core Bank | Omaha, NE | 419% | 92% | +6% | $483 million | $115 million | FDIC |
‡ Closed after June 30, 2026: Tioga-Franklin Savings Bank (Philadelphia, PA) on August 21, 2026; Nano Banc (Irvine, CA) on September 25, 2026. The FDIC records the end of the charter; the figures shown are those it reported for June 30, 2026.
Download this table (CSV), free. The full dataset, every bank in the ranking with each of the four loan lines and its figure three years earlier, is one email away.
What counts as commercial real estate here
The guidance (71 FR 74580) covers loans whose repayment depends on the commercial property market: construction and land development, multifamily, and nonfarm nonresidential property where the primary source of repayment is cash flow from the real estate itself. A loan on an office a business occupies and repays from its own operations is outside it. The Call Report has reported that split since the revisions that followed the guidance, so this page counts four FDIC fields:
- Construction and land development loans secured by real estate.
- Multifamily residential loans.
- Nonfarm nonresidential loans not secured by owner-occupied property.
- Loans to finance commercial real estate, construction and land development that are not secured by real estate.
Total capital is total risk-based capital, as the guidance defines it. Field definitions are in the FDIC's reference workbook; the guidance is in the Federal Register.
Banks this measure cannot cover
1,798 insured banks use the community bank leverage ratio framework, and they report no total risk-based capital, so the guidance's ratio cannot be computed for them as it is defined. They hold 3.5% of insured bank assets. They are left out rather than measured against a different kind of capital, which would put two different ratios in one ranking.
What this means for technology buyers
A concentrated commercial real estate book is managed loan by loan and as a portfolio: tracking each property's performance and the borrower's financials, stress testing the book against the property market, and reporting the concentration to the board. These guides compare the options side by side:
- Commercial loan origination systems: from application to booked loan for business and property credit.
- Underwriting workflow automation for commercial banks: spreading, credit memos and approvals.
- Predictive analytics platforms for credit risk: models for rating and monitoring a loan portfolio.
Planning the change before choosing the vendor? The Banking and Payments Capability Matrix states what a bank does, from taking deposits to originating credit, so a lending platform can be placed against the capabilities it supports.
More from Finantrix Atlas
- Largest US commercial real estate lenders
- US banks by unrealized losses on securities
- US banks by share of uninsured deposits
- US banks by size: how many in each asset tier
How this list was built
The population is every FDIC-insured commercial bank and savings institution that filed a Call Report for June 30, 2026 and reports total risk-based capital, read from the FDIC's BankFind Suite, including banks whose charter has ended since. Each bank's growth compares the same four loan lines with its Call Report for June 30, 2023, by charter, so a bank that absorbed another counts the loans it took on, as its own balance does.
The FDIC's Quarterly Banking Profile, the edition for the second quarter of 2026, prints the industry's construction and development, multifamily and nonfarm nonresidential loans for its population of 4,238 institutions. Summed across the same institutions, the banks' figures equal each line to the million dollars. For every bank, the owner-occupied and other nonfarm nonresidential loans add up to its nonfarm nonresidential total, which is the split the measure depends on.
Limits
- A screen, not a finding. The guidance describes these levels as indicators that identify banks for further supervisory analysis. A bank above them is not in breach of anything, and the ranking does not show how its loans are performing, how they are underwritten or what reserves it holds.
- Banks that report total capital only. Banks under the community bank leverage ratio are not ranked.
- Balances, not commitments. Undrawn construction lines are not counted.
- Banks, not holding companies. A group with several charters appears once per charter.
- One quarter. The date of the data is June 30, 2026.
Cite this
Free to quote, cite and republish, including the chart, with credit to Finantrix Atlas and a link to this page.
273 FDIC-insured US banks held commercial real estate loans of 300% or more of their total capital on June 30, 2026, according to a Finantrix Atlas analysis of FDIC Call Report data, measured as the interagency CRE guidance defines it.
Suggested citation: Finantrix Atlas, "US Banks by Commercial Real Estate Concentration," data as of June 30, 2026, from FDIC Call Reports. https://www.finantrix.com/articles/banks-cre-concentration
Embed the chart:
<a href="https://www.finantrix.com/articles/banks-cre-concentration"><img src="https://www.finantrix.com/atlas/banks-cre-concentration.png?v=2026-06-30" alt="US banks with the highest commercial real estate concentration, from FDIC data, by Finantrix Atlas"></a>
<p>Chart: <a href="https://www.finantrix.com/articles/banks-cre-concentration">Finantrix Atlas</a>, from FDIC Call Reports.</p>
Frequently asked questions
Q: Which US bank has the highest commercial real estate concentration? A: Among banks that report total risk-based capital, Tioga-Franklin Savings Bank, with commercial real estate loans of 822% of total capital on June 30, 2026, according to FDIC data.
Q: How many banks are above the CRE concentration threshold? A: 273 banks held commercial real estate loans of 300% or more of total capital on June 30, 2026, and 64 of them had also grown those loans by 50% or more over three years, according to FDIC data. 160 banks held construction and land loans of 100% or more of total capital.
Q: What are the CRE concentration criteria? A: The interagency guidance names two: construction, land development and other land loans of 100% or more of total capital; or commercial real estate loans of 300% or more of total capital with the portfolio up 50% or more over thirty-six months.
Q: Is a bank above the threshold breaking a rule? A: No. The guidance says the criteria "do not constitute limits on an institution's lending activity". A bank near or above them may be identified for further supervisory analysis of its concentration.
Download the data
Two CSV files, free: the 50 rows on this page, and the full dataset of all 2,440 rows, as of June 30, 2026.
Frequently Asked Questions
Which US bank has the highest commercial real estate concentration?
Among banks that report total risk-based capital, Tioga-Franklin Savings Bank, with commercial real estate loans of 822% of total capital on June 30, 2026, according to FDIC data.
How many banks are above the CRE concentration threshold?
273 banks held commercial real estate loans of 300% or more of total capital on June 30, 2026, and 64 of them had also grown those loans by 50% or more over three years, according to FDIC data. 160 banks held construction and land loans of 100% or more of total capital.
What are the CRE concentration criteria?
The interagency guidance names two: construction, land development and other land loans of 100% or more of total capital; or commercial real estate loans of 300% or more of total capital with the portfolio up 50% or more over thirty-six months.
Is a bank above the threshold breaking a rule?
No. The guidance says the criteria "do not constitute limits on an institution's lending activity". A bank near or above them may be identified for further supervisory analysis of its concentration.