
Key Takeaways
- Navy Federal made more home loans than any other US credit union in 2025, $18.5 billion across 80,546 loans, according to HMDA data.
- Credit unions made $194 billion of home loans in 2025, 9.1% of the US total reported under HMDA, across 998,742 loans from 1,498 credit unions.
- Federally insured credit unions held $626 billion of first-lien home loans at the end of 2025 and sold $34.4 billion of first mortgages during the year, according to NCUA data.
- The ten largest credit union mortgage lenders made 25% of credit union home loans in 2025, according to HMDA filings.
Navy Federal made more home loans than any other US credit union in 2025, $18.5 billion across 80,546 loans, according to HMDA data, followed by State Employees' and Lake Michigan. Credit unions made $194 billion of home loans in all, up 21% from 2024 and 9.1% of the $2.13 trillion reported under the Home Mortgage Disclosure Act, from 1,498 credit unions.
A credit union can keep the mortgages it makes or sell them. Federally insured credit unions held $626 billion of first-lien home loans on December 31, 2025, and sold $34.4 billion of first mortgages during the year, according to their NCUA Call Reports. The table shows both sides for each credit union: what it made, from HMDA, and what it held and sold, from the NCUA.
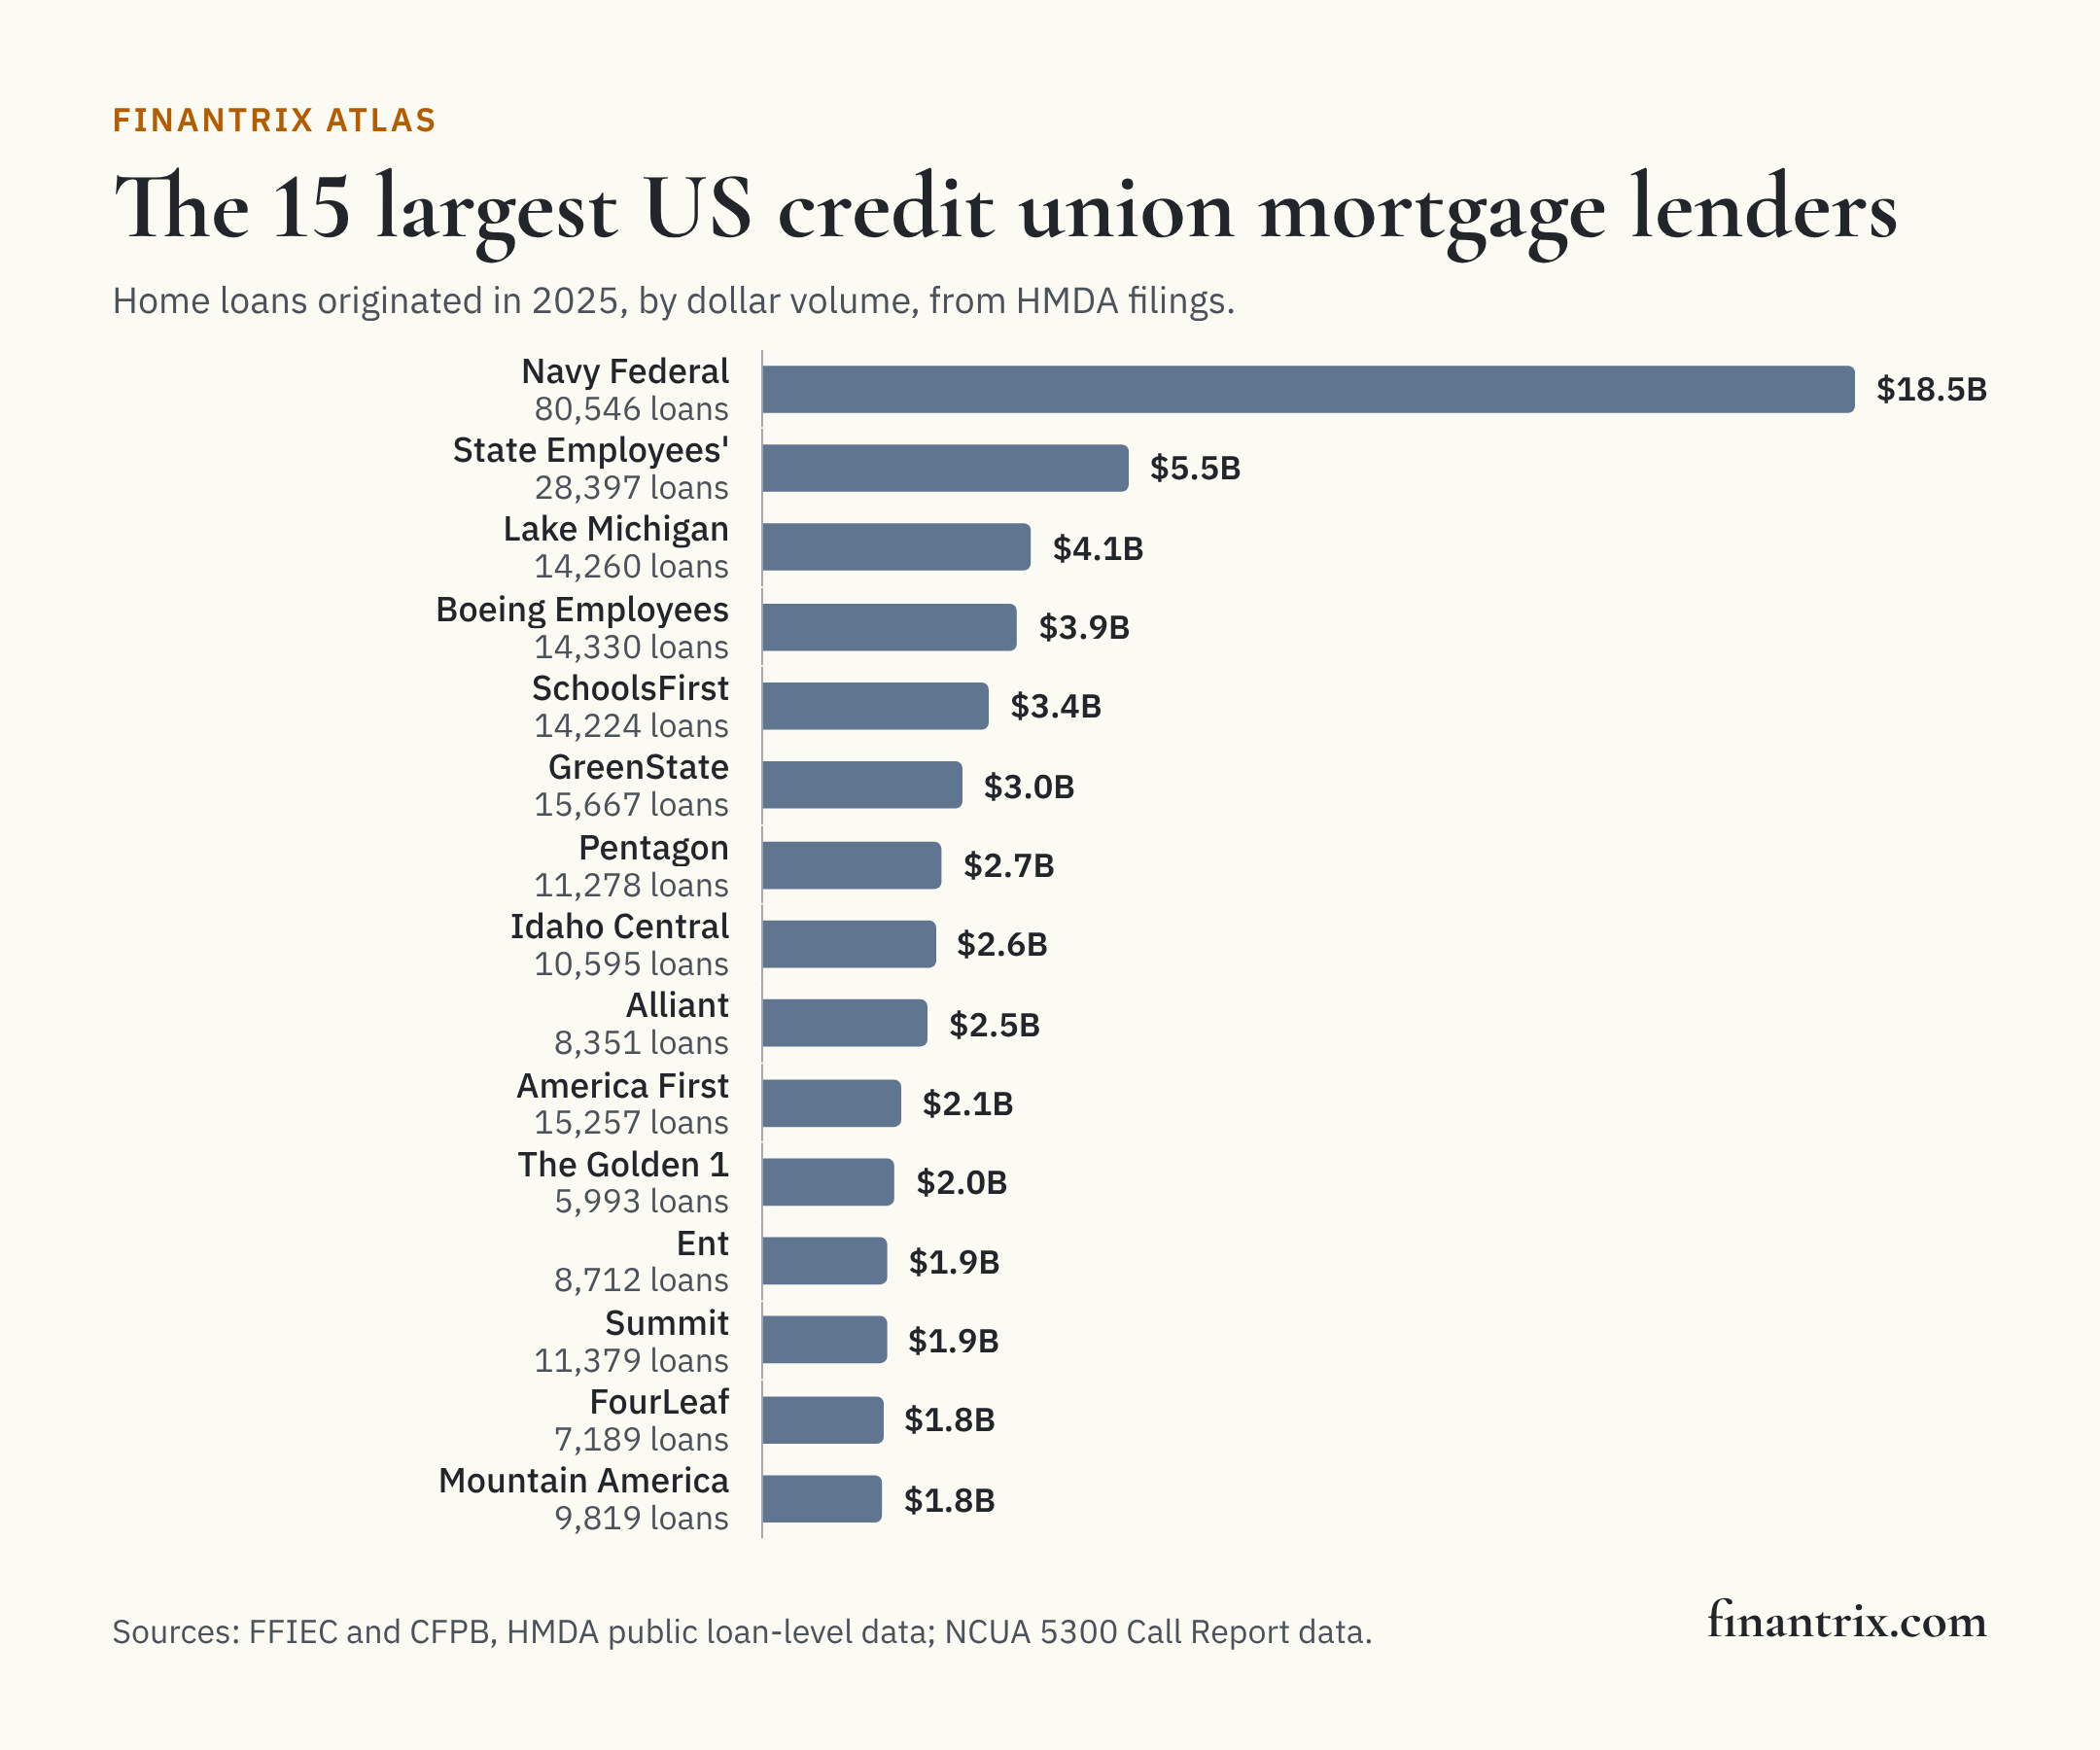
The 50 largest credit union mortgage lenders
Ranked by the dollar amount of home loans originated in 2025, loans on one-to-four family dwellings, as each credit union reported them under HMDA. The three right-hand figures are from the same credit union's Call Report for December 31, 2025. Names are as the NCUA lists them, which usually leaves out "Credit Union".
| Rank | Credit union | Headquarters | Home loans originated | Loans | Share of credit union home loans | First-lien home loans held | First mortgages sold in the year | Real estate loans granted in the year | Sources |
|---|---|---|---|---|---|---|---|---|---|
| 1 | Navy Federal | Vienna, VA | $18.5 billion | 80,546 | 9.6% | $56.6 billion | $5.7 billion | $18.3 billion | FFIEC, NCUA |
| 2 | State Employees' | Raleigh, NC | $5.5 billion | 28,397 | 2.9% | $26.9 billion | $1 million | $4.5 billion | FFIEC, NCUA |
| 3 | Lake Michigan | Caledonia, MI | $4.1 billion | 14,260 | 2.1% | $8.1 billion | $1.6 billion | $4.2 billion | FFIEC, NCUA |
| 4 | Boeing Employees | Tukwila, WA | $3.9 billion | 14,330 | 2.0% | $8.3 billion | $589 million | $3.3 billion | FFIEC, NCUA |
| 5 | SchoolsFirst | Tustin, CA | $3.4 billion | 14,224 | 1.8% | $9.2 billion | $102 million | $3.4 billion | FFIEC, NCUA |
| 6 | GreenState | North Liberty, IA | $3.0 billion | 15,667 | 1.6% | $3.8 billion | $1.8 billion | $1.5 billion | FFIEC, NCUA |
| 7 | Pentagon | McLean, VA | $2.7 billion | 11,278 | 1.4% | $11.5 billion | $1.4 billion | $2.7 billion | FFIEC, NCUA |
| 8 | Idaho Central | Chubbuck, ID | $2.6 billion | 10,595 | 1.3% | $4.3 billion | $772 million | $2.7 billion | FFIEC, NCUA |
| 9 | Alliant | Chicago, IL | $2.5 billion | 8,351 | 1.3% | $6.8 billion | $409 million | $2.8 billion | FFIEC, NCUA |
| 10 | America First | Riverdale, UT | $2.1 billion | 15,257 | 1.1% | $1.3 billion | $116 million | $2.4 billion | FFIEC, NCUA |
| 11 | The Golden 1 | Sacramento, CA | $2.0 billion | 5,993 | 1.0% | $7.4 billion | $38 million | $2.1 billion | FFIEC, NCUA |
| 12 | Ent | Colorado Springs, CO | $1.9 billion | 8,712 | 1.0% | $3.8 billion | $602 million | $1.9 billion | FFIEC, NCUA |
| 13 | Summit | Cottage Grove, WI | $1.9 billion | 11,379 | 1.0% | $3.2 billion | $335 million | $2.0 billion | FFIEC, NCUA |
| 14 | FourLeaf | Bethpage, NY | $1.8 billion | 7,189 | 0.9% | $4.0 billion | $174 million | $1.8 billion | FFIEC, NCUA |
| 15 | Mountain America | Sandy, UT | $1.8 billion | 9,819 | 0.9% | $4.0 billion | $450 million | $1.8 billion | FFIEC, NCUA |
| 16 | Liberty | Evansville, IN | $1.7 billion | 5,959 | 0.9% | $1.9 billion | $680 million | $1.7 billion | FFIEC, NCUA |
| 17 | OnPoint Community | Portland, OR | $1.7 billion | 8,134 | 0.9% | $2.5 billion | $827 million | $992 million | FFIEC, NCUA |
| 18 | University of Wisconsin | Madison, WI | $1.5 billion | 8,840 | 0.8% | $1.6 billion | $601 million | $1.6 billion | FFIEC, NCUA |
| 19 | Desert Financial | Phoenix, AZ | $1.5 billion | 10,561 | 0.8% | $567 million | $163 million | $1.5 billion | FFIEC, NCUA |
| 20 | CommunityAmerica | Lenexa, KS | $1.5 billion | 6,809 | 0.8% | $1.8 billion | $835 million | $1.2 billion | FFIEC, NCUA |
| 21 | First Technology | San Jose, CA | $1.4 billion | 4,147 | 0.7% | $5.3 billion | $272 million | $1.6 billion | FFIEC, NCUA |
| 22 | Suncoast | Tampa, FL | $1.3 billion | 8,410 | 0.7% | $4.8 billion | $2 million | $1.3 billion | FFIEC, NCUA |
| 23 | Veridian | Waterloo, IA | $1.2 billion | 8,147 | 0.6% | $2.2 billion | $236 million | $1.2 billion | FFIEC, NCUA |
| 24 | Elevations | Boulder, CO | $1.1 billion | 2,957 | 0.6% | $1.7 billion | $740 million | $1.0 billion | FFIEC, NCUA |
| 25 | Everwise | South Bend, IN | $1.1 billion | 2,253 | 0.6% | $1.1 billion | $109 million | $258 million | FFIEC, NCUA |
| 26 | Randolph-Brooks | Live Oak, TX | $1.1 billion | 7,138 | 0.6% | $5.5 billion | $38 million | $1.1 billion | FFIEC, NCUA |
| 27 | Genisys | Auburn Hills, MI | $1.1 billion | 3,537 | 0.6% | $1.6 billion | $44 million | $1.2 billion | FFIEC, NCUA |
| 28 | Space Coast | Melbourne, FL | $1.1 billion | 5,900 | 0.6% | $2.4 billion | $37 million | $1.1 billion | FFIEC, NCUA |
| 29 | Redwood | Santa Rosa, CA | $1.1 billion | 2,920 | 0.5% | $3.2 billion | $81 million | $1.1 billion | FFIEC, NCUA |
| 30 | Quorum | Purchase, NY | $984 million | 5,048 | 0.5% | $383 million | $955,225 | $1.1 billion | FFIEC, NCUA |
| 31 | Credit Union One | Ferndale, MI | $971 million | 1,844 | 0.5% | $474 million | $45 million | $303 million | FFIEC, NCUA |
| 32 | Landmark | Brookfield, WI | $970 million | 6,577 | 0.5% | $1.3 billion | $285 million | $844 million | FFIEC, NCUA |
| 33 | United Nations | Long Island City, NY | $953 million | 1,493 | 0.5% | $5.3 billion | $37 million | $970 million | FFIEC, NCUA |
| 34 | Global | Anchorage, AK | $953 million | 2,602 | 0.5% | $2.9 billion | $393 million | $1.0 billion | FFIEC, NCUA |
| 35 | Royal | Eau Claire, WI | $923 million | 4,674 | 0.5% | $1.1 billion | $522 million | $1.0 billion | FFIEC, NCUA |
| 36 | Star One | Sunnyvale, CA | $920 million | 1,665 | 0.5% | $5.3 billion | $0 | $1.3 billion | FFIEC, NCUA |
| 37 | Digital | San Jose, CA | $889 million | 3,847 | 0.5% | $3.5 billion | $5 million | $869 million | FFIEC, NCUA |
| 38 | Wright-Patt | Beavercreek, OH | $861 million | 5,316 | 0.4% | $2.3 billion | $241 million | $1.2 billion | FFIEC, NCUA |
| 39 | Baxter | Vernon Hills, IL | $859 million | 3,217 | 0.4% | $2.2 billion | $0 | $868 million | FFIEC, NCUA |
| 40 | Members 1st | Enola, PA | $829 million | 6,461 | 0.4% | $938 million | $135 million | $848 million | FFIEC, NCUA |
| 41 | Police & Fire | Philadelphia, PA | $799 million | 6,267 | 0.4% | $2.5 billion | $40 million | $808 million | FFIEC, NCUA |
| 42 | Delta Community | Atlanta, GA | $797 million | 3,188 | 0.4% | $2.6 billion | $5 million | $877 million | FFIEC, NCUA |
| 43 | TruStone Financial | Plymouth, MN | $773 million | 4,901 | 0.4% | $1.1 billion | $273 million | $863 million | FFIEC, NCUA |
| 44 | Mission | San Diego, CA | $771 million | 1,909 | 0.4% | $2.4 billion | $40 million | $766 million | FFIEC, NCUA |
| 45 | Logix | Valencia, CA | $729 million | 3,069 | 0.4% | $3.9 billion | $42 million | $735 million | FFIEC, NCUA |
| 46 | MIDFLORIDA | Lakeland, FL | $725 million | 3,709 | 0.4% | $2.1 billion | $39 million | $812 million | FFIEC, NCUA |
| 47 | VyStar | Jacksonville, FL | $717 million | 3,351 | 0.4% | $3.3 billion | $78 million | $1000 million | FFIEC, NCUA |
| 48 | Tower | Laurel, MD | $715 million | 3,617 | 0.4% | $1.0 billion | $0 | $704 million | FFIEC, NCUA |
| 49 | Pennsylvania State Employees | Harrisburg, PA | $709 million | 5,896 | 0.4% | $2.2 billion | $0 | $729 million | FFIEC, NCUA |
| 50 | Security Service | San Antonio, TX | $708 million | 3,634 | 0.4% | $4.5 billion | $67 million | $730 million | FFIEC, NCUA |
Download this table (CSV), free. The full dataset, every credit union that filed under HMDA with its identifiers, match rule and NCUA mortgage figures, is one email away.
Credit union mortgage lending in 2025
- The ten largest credit union mortgage lenders made 25% of credit union home loans, and the 50 in the table 48%, according to HMDA data.
- According to NCUA data, the 4,287 federally insured credit unions held $985 billion in real estate loans at year end: $626 billion first-lien and $178 billion junior-lien home loans, and the rest commercial and other real estate.
- They granted $211 billion of real estate loans during the year, junior liens and home equity lines included, and sold $34.4 billion of first mortgages.
What this means for technology buyers
A credit union that makes mortgages chooses what to keep and what to sell, and needs an origination system for the loan, a secondary marketing process for the sale, and servicing for what it keeps. These guides compare the options side by side:
- Loan origination systems for mortgage banks: taking, underwriting and closing a home loan.
- Loan servicing platforms: payments and escrow for the loans a credit union keeps.
- Core banking systems: where a member's mortgage sits beside the rest of the relationship.
Mapping the business? The Banking and Payments Capability Matrix covers retail lending as a credit union shares it with a retail bank.
More from Finantrix Atlas
- Largest credit unions in the US
- Largest mortgage lenders in the US
- Credit unions with the largest auto loan books
- Credit unions with the largest business loan books
How this list was built
The universe is every filer in the FFIEC's public HMDA loan-level file for 2025 that our HMDA pages classify as a credit union: from the NCUA's and FDIC's records first and the FFIEC's own lender codes after them, as on our page on banks and nonbanks in mortgage lending. Home loans are originations on one-to-four family dwellings, the measure our national ranking uses. Home loan amounts filed by Everwise Credit Union in some states were set aside after reading, as on our page on the largest mortgage lender in each state, and are left out of the dollar figures.
Each credit union is matched to its NCUA charter by the Federal Reserve identifier the FFIEC's Reporter Panel gives for it, or failing that by its exact name and state; 99.3% of credit union home loan volume matched, every credit union in the table among it. The NCUA figures are Accounts 703A (first-lien one-to-four family loans), 386A (junior-lien), RL0048 (real estate loans granted during the year) and 736 (first mortgages sold during the year).
The HMDA file's total originations match the FFIEC Data Browser's national count, and each filer's record count matches the FFIEC's filer list. The NCUA quarter reproduces the NCUA's Quarterly Credit Union Data Summary: the count of credit unions, total assets, real estate loans and real estate lending for the year.
Limits
- Credit unions that file under HMDA. A credit union below HMDA's thresholds, or one that lends through a separately filing service organization, is ranked on what it filed itself.
- Made, held and sold are different questions. The HMDA figure is what was originated; the NCUA balances include loans made in earlier years, and loans sold in the year may have been made in the year before.
- Federally insured only on the NCUA side. Amounts in the HMDA public file are rounded to the midpoint of a $10,000 band. The data are for 2025.
Cite this
Free to quote, cite and republish, including the chart, with credit to Finantrix Atlas and a link to this page.
Navy Federal made $18.5 billion in home loans in 2025, the most of any US credit union, according to a Finantrix Atlas analysis of HMDA data.
US credit unions made 9.1% of home loans by dollar volume in 2025, according to Finantrix Atlas.
Suggested citation: Finantrix Atlas, "Largest Credit Union Mortgage Lenders," 2025, from FFIEC and CFPB HMDA data and NCUA Call Report data. https://www.finantrix.com/articles/largest-credit-union-mortgage-lenders
Embed the chart:
<a href="https://www.finantrix.com/articles/largest-credit-union-mortgage-lenders"><img src="https://www.finantrix.com/atlas/largest-credit-union-mortgage-lenders.png?v=2025-12-31" alt="The largest US credit union mortgage lenders, from Finantrix Atlas"></a>
<p>Chart: <a href="https://www.finantrix.com/articles/largest-credit-union-mortgage-lenders">Finantrix Atlas</a>, from HMDA and NCUA data.</p>
Frequently asked questions
Q: Which credit union makes the most mortgages? A: Navy Federal, with $18.5 billion of home loans across 80,546 loans in 2025, according to HMDA data.
Q: What share of mortgages do credit unions make? A: 9.1% of home loans by dollar volume reported under HMDA in 2025, $194 billion.
Q: How many mortgages do credit unions hold? A: $626 billion of first-lien home loans at the end of 2025, according to the NCUA, and $178 billion of junior-lien home loans.
Download the data
Two CSV files, free: the 50 rows on this page, and the full dataset of all 1,498 rows, as of December 31, 2025.
Frequently Asked Questions
Which credit union makes the most mortgages?
Navy Federal, with $18.5 billion of home loans across 80,546 loans in 2025, according to HMDA data.
What share of mortgages do credit unions make?
9.1% of home loans by dollar volume reported under HMDA in 2025, $194 billion.
How many mortgages do credit unions hold?
$626 billion of first-lien home loans at the end of 2025, according to the NCUA, and $178 billion of junior-lien home loans.