
Key Takeaways
- Square Financial Services, Inc. reports the highest return on assets among the 1,048 FDIC-insured US banks with $1 billion or more in assets, 37.85%, according to FDIC Call Report data for the first half of 2026.
- The median bank of that size reports 1.25%; 118 report more than 2% and 17 report a loss, according to FDIC data.
- 15 of the 50 highest are Subchapter S banks, which are generally taxed through their shareholders rather than at the bank level for federal income tax, so their pretax return is the closer comparison; it is shown beside each bank.
- Industry net income, net interest income, noninterest income and noninterest expense for the quarter add up to the FDIC's Quarterly Banking Profile, to the million dollars.
Square Financial Services, Inc. reports the highest return on assets among the 1,048 FDIC-insured US banks with $1 billion or more in assets, 37.85%, according to FDIC Call Report data for the first half of 2026. Credit One Bank follows at 25.35% and The Bank of New York Mellon Trust Company at 15.27%. The median bank of that size reports 1.25%, 118 report more than 2%, and 17 report a loss.
Return on assets is net income as a share of average total assets. The FDIC computes it from each bank's Call Report and annualizes it, so a half year's return is stated as a yearly rate.
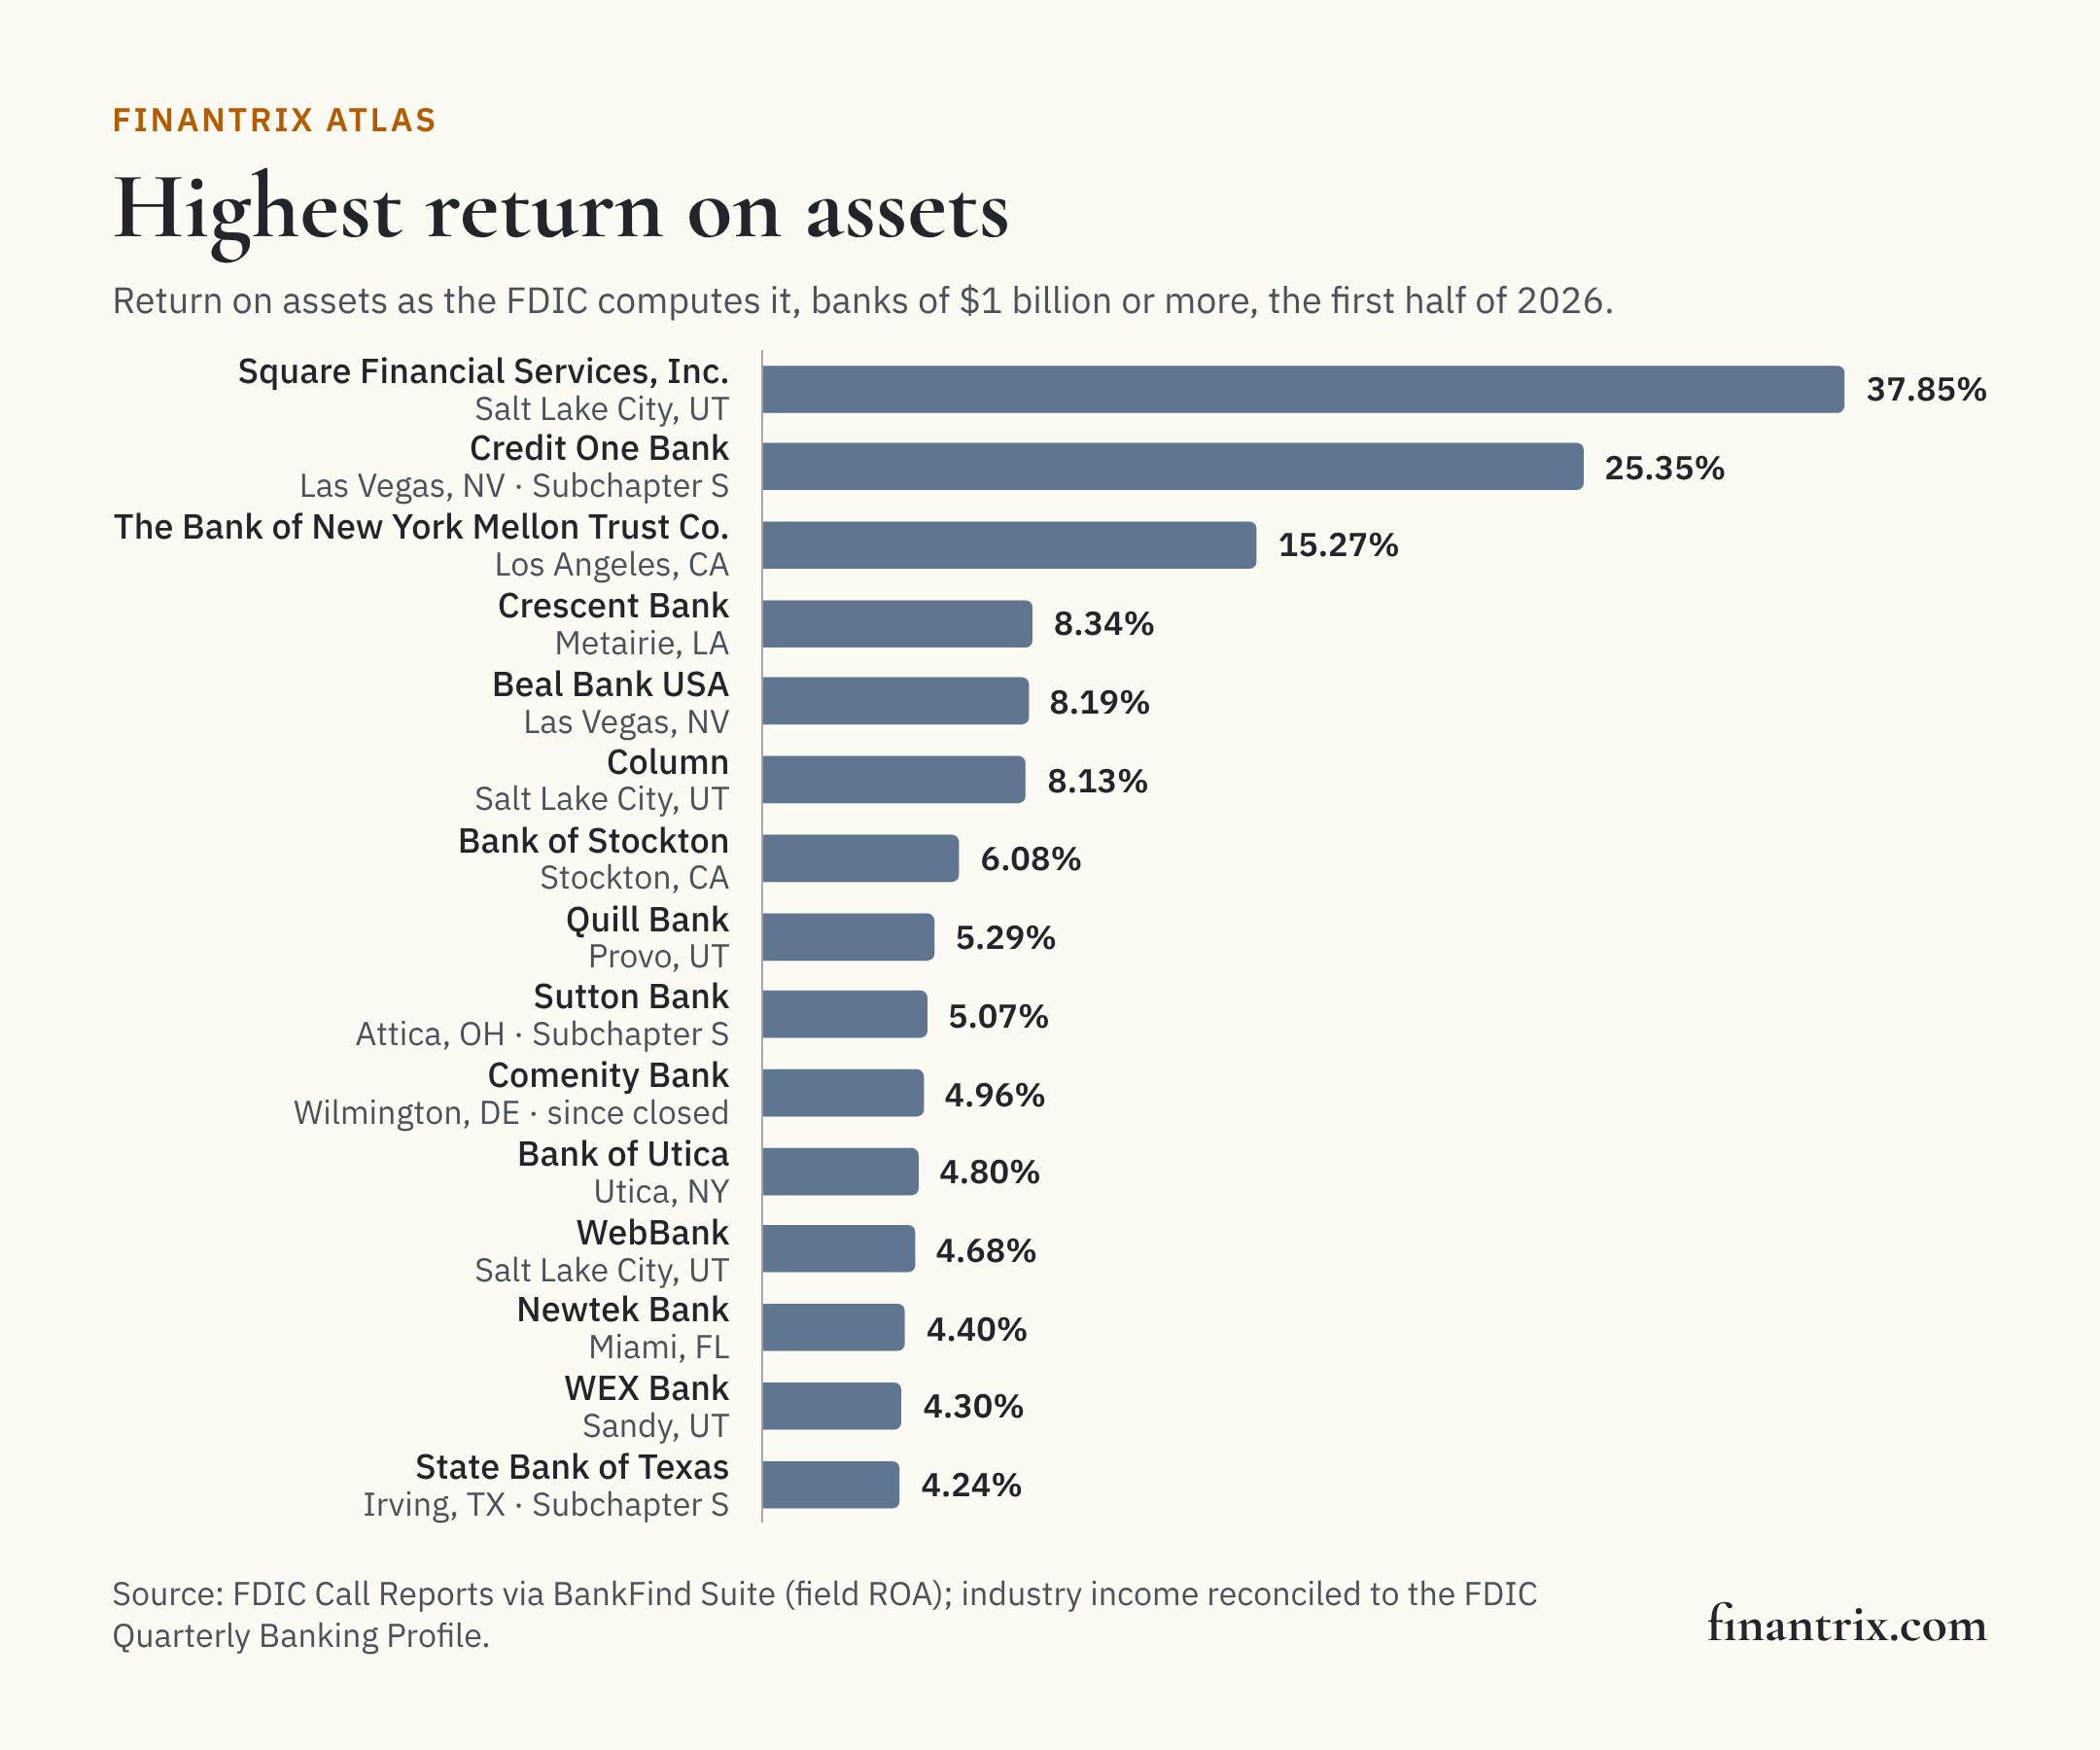
The 50 most profitable banks by return on assets
Ranked by return on assets as the FDIC computes it, for the first half of 2026, among banks with $1 billion or more in assets. Each row is one bank charter, with its pretax return on assets and return on equity. The return needed to make this list is 2.40%.
| Rank | Bank | Headquarters | Return on assets | Pretax return on assets | Return on equity | Net income, year to date | Total assets | Source |
|---|---|---|---|---|---|---|---|---|
| 1 | Square Financial Services, Inc. | Salt Lake City, UT | 37.85% | 50.40% | 60.0% | $350 million | $2.1 billion | FDIC |
| 2 | Credit One Bank § | Las Vegas, NV | 25.35% | 25.35% | 90.8% | $277 million | $2.4 billion | FDIC |
| 3 | The Bank of New York Mellon Trust Company | Los Angeles, CA | 15.27% | 20.03% | 19.0% | $105 million | $1.4 billion | FDIC |
| 4 | Crescent Bank | Metairie, LA | 8.34% | 10.93% | 59.2% | $42 million | $1.1 billion | FDIC |
| 5 | Beal Bank USA | Las Vegas, NV | 8.19% | 10.44% | 38.0% | $527 million | $11.0 billion | FDIC |
| 6 | Column | Salt Lake City, UT | 8.13% | 11.62% | 73.3% | $54 million | $1.8 billion | FDIC |
| 7 | Bank of Stockton | Stockton, CA | 6.08% | 8.64% | 32.2% | $148 million | $5.0 billion | FDIC |
| 8 | Quill Bank | Provo, UT | 5.29% | 6.89% | 38.1% | $40 million | $1.6 billion | FDIC |
| 9 | Sutton Bank § | Attica, OH | 5.07% | 5.07% | 37.7% | $42 million | $1.7 billion | FDIC |
| 10 | Comenity Bank ‡ | Wilmington, DE | 4.96% | 6.53% | 36.4% | $189 million | $7.4 billion | FDIC |
| 11 | Bank of Utica | Utica, NY | 4.80% | 6.03% | 18.7% | $35 million | $1.5 billion | FDIC |
| 12 | WebBank | Salt Lake City, UT | 4.68% | 6.33% | 28.4% | $66 million | $2.9 billion | FDIC |
| 13 | Newtek Bank | Miami, FL | 4.40% | 5.90% | 50.5% | $47 million | $2.5 billion | FDIC |
| 14 | WEX Bank | Sandy, UT | 4.30% | 5.75% | 51.9% | $205 million | $10.7 billion | FDIC |
| 15 | State Bank of Texas § | Irving, TX | 4.24% | 4.25% | 27.9% | $57 million | $2.6 billion | FDIC |
| 16 | Monet Bank | Plano, TX | 4.06% | 5.18% | 12.8% | $67 million | $3.2 billion | FDIC |
| 17 | American Express National Bank | Sandy, UT | 3.70% | 4.86% | 41.6% | $4.0 billion | $214 billion | FDIC |
| 18 | Carter Bank & Trust | Martinsville, VA | 3.66% | 4.67% | 37.1% | $88 million | $4.8 billion | FDIC |
| 19 | Celtic Bank | Salt Lake City, UT | 3.41% | 4.47% | 19.3% | $86 million | $5.3 billion | FDIC |
| 20 | Prime Alliance Bank § | Woods Cross, UT | 3.41% | 3.41% | 33.3% | $18 million | $1.1 billion | FDIC |
| 21 | InterBank § | Oklahoma City, OK | 3.22% | 3.22% | 27.3% | $87 million | $5.3 billion | FDIC |
| 22 | John Deere Financial, f.s.b. | Middleton, WI | 3.11% | 3.65% | 15.0% | $65 million | $4.9 billion | FDIC |
| 23 | Ameriprise Bank, FSB | Minneapolis, MN | 3.05% | 4.02% | 51.0% | $388 million | $25.5 billion | FDIC |
| 24 | The Yellowstone Bank § | Laurel, MT | 2.99% | 2.99% | 23.1% | $20 million | $1.3 billion | FDIC |
| 25 | The Bancorp Bank | Sioux Falls, SD | 2.94% | 3.76% | 31.8% | $139 million | $9.2 billion | FDIC |
| 26 | First American Bank § | Artesia, NM | 2.89% | 2.89% | 28.4% | $27 million | $1.9 billion | FDIC |
| 27 | Bessemer Trust Company | New York, NY | 2.88% | 3.92% | 38.2% | $77 million | $4.2 billion | FDIC |
| 28 | Synchrony Bank | Draper, UT | 2.84% | 3.75% | 22.1% | $1.6 billion | $115 billion | FDIC |
| 29 | International Bank of Commerce | Laredo, TX | 2.82% | 3.54% | 13.8% | $140 million | $10.2 billion | FDIC |
| 30 | Pathward | Sioux Falls, SD | 2.81% | 3.27% | 23.3% | $103 million | $7.3 billion | FDIC |
| 31 | First National Bank of America | East Lansing, MI | 2.79% | 3.53% | 34.7% | $94 million | $6.8 billion | FDIC |
| 32 | Sallie Mae Bank | Salt Lake City, UT | 2.77% | 3.71% | 27.5% | $404 million | $28.5 billion | FDIC |
| 33 | Cedar Rapids Bank and Trust Company | Cedar Rapids, IA | 2.72% | 3.05% | 16.4% | $39 million | $2.9 billion | FDIC |
| 34 | HNB National Bank § | Hannibal, MO | 2.66% | 2.66% | 22.8% | $15 million | $1.3 billion | FDIC |
| 35 | First Savings Bank | Beresford, SD | 2.61% | 3.39% | 13.7% | $21 million | $1.6 billion | FDIC |
| 36 | Amboy Bank § | Old Bridge, NJ | 2.60% | 2.60% | 22.0% | $38 million | $3.1 billion | FDIC |
| 37 | Pioneer Bank § | Roswell, NM | 2.58% | 2.58% | 25.1% | $14 million | $1.1 billion | FDIC |
| 38 | Farmers Bank & Trust § | Great Bend, KS | 2.56% | 2.66% | 11.3% | $13 million | $1.1 billion | FDIC |
| 39 | First National Bank of Central Texas § | Waco, TX | 2.55% | 2.55% | 22.6% | $22 million | $1.8 billion | FDIC |
| 40 | Optum Bank, Inc. | Draper, UT | 2.55% | 3.31% | 17.5% | $269 million | $21.4 billion | FDIC |
| 41 | Merrick Bank | South Jordan, UT | 2.55% | 3.39% | 13.5% | $116 million | $9.1 billion | FDIC |
| 42 | Northeast Bank | Portland, ME | 2.53% | 3.38% | 22.6% | $64 million | $5.2 billion | FDIC |
| 43 | The Bennington State Bank § | Salina, KS | 2.50% | 2.58% | 25.7% | $16 million | $1.4 billion | FDIC |
| 44 | First National Bank | Fort Pierre, SD | 2.50% | 3.33% | 11.0% | $26 million | $2.0 billion | FDIC |
| 45 | United Bank | Zebulon, GA | 2.50% | 3.23% | 22.4% | $28 million | $2.2 billion | FDIC |
| 46 | Citizens National Bank of Texas | Waxahachie, TX | 2.49% | 2.94% | 20.6% | $27 million | $2.2 billion | FDIC |
| 47 | RBC Bank, (Georgia) | Atlanta, GA | 2.47% | 3.20% | 23.8% | $109 million | $9.6 billion | FDIC |
| 48 | The Citizens National Bank of Bluffton § | Bluffton, OH | 2.45% | 2.45% | 24.8% | $13 million | $1.1 billion | FDIC |
| 49 | Edmonton State Bank § | Glasgow, KY | 2.44% | 2.51% | 20.7% | $14 million | $1.2 billion | FDIC |
| 50 | Thomasville National Bank | Thomasville, GA | 2.40% | 3.13% | 23.8% | $25 million | $2.2 billion | FDIC |
§ Subchapter S bank, according to its FDIC record: generally taxed through its shareholders rather than at the bank level for federal income tax, so compare its pretax return.
‡ Closed after June 30, 2026: Comenity Bank (Wilmington, DE) on October 1, 2026. The FDIC records the end of the charter; the figures shown are those it reported for June 30, 2026.
Download this table (CSV), free. The full dataset, every bank in the ranking with its returns, net income and identifiers, is one email away.
Before and after tax
15 of the 50 banks in the table, and 136 of the 1,048 in the ranking, are Subchapter S banks, according to their FDIC records. Their income is generally taxed through their shareholders rather than at the bank level for federal income tax, so their return after tax is not directly comparable with a bank that pays it. Pretax return on assets, also computed by the FDIC, is shown for every bank; for Square Financial Services, Inc. it is 50.40%.
What this means for technology buyers
Return on assets is what is left of a bank's revenue after its funding costs, its overhead, its credit losses and its taxes. Overhead is the part technology changes most directly: the cost of serving each account and processing each loan. These guides compare the options side by side:
- Cloud-based core banking systems: the ledger and product engine under every account.
- Financial BI and dashboarding for bank executives: measuring profitability by line and product.
- Financial close and consolidation software for banks: closing the books each period.
Planning the change before choosing the vendor? The Banking and Payments Capability Matrix states what a bank does, from taking deposits to originating credit, so a platform can be placed against the capabilities it supports.
More from Finantrix Atlas
- Largest banks in the US, ranked by total assets
- Fastest-growing US banks
- US banks by unrealized losses on securities
- US banks by size: how many in each asset tier
How this list was built
The population is every FDIC-insured commercial bank and savings institution that filed a Call Report for June 30, 2026 with $1 billion or more in total assets, read from the FDIC's BankFind Suite, including banks whose charter has ended since. Banks are ranked by the FDIC field ROA, which the FDIC's field definitions describe as net income after taxes and extraordinary items, annualized, as a percent of average total assets, year to date. Pretax return on assets is ROAPTX and return on equity is ROE, both computed by the FDIC on the same basis. Subchapter S status is the FDIC field SUBCHAPS. Nothing on this page annualizes or recomputes a ratio.
The FDIC's Quarterly Banking Profile, the edition for the second quarter of 2026, prints the industry's income statement for the quarter. Summed across the same 4,238 institutions, the banks' net income, net interest income, noninterest income and noninterest expense for the quarter equal it to the million dollars. The ratios themselves have no second publisher; each bank's return on assets is checked to carry the same sign as its net income.
Limits
- Year to date, annualized. The figures cover the first half of 2026 and are stated as yearly rates. A single large gain or loss in the period moves a bank's return.
- Before and after tax differ by bank. Subchapter S banks are marked; compare their pretax return.
- Profitability, not performance. A high return can come from a business model, a one-off gain, a release of loan-loss reserves or a small balance sheet. The ranking does not show risk, growth or asset quality.
- Banks of $1 billion or more, the floor the other Finantrix Atlas ratio pages use.
- Banks, not holding companies. A group with several charters appears once per charter.
Cite this
Free to quote, cite and republish, including the chart, with credit to Finantrix Atlas and a link to this page.
Square Financial Services, Inc. reported the highest return on assets of any FDIC-insured US bank with $1 billion or more in assets in the first half of 2026, 37.85%, according to a Finantrix Atlas analysis of FDIC data.
Suggested citation: Finantrix Atlas, "Most Profitable US Banks by Return on Assets," data for the first half of 2026, from FDIC Call Reports. https://www.finantrix.com/articles/most-profitable-banks
Embed the chart:
<a href="https://www.finantrix.com/articles/most-profitable-banks"><img src="https://www.finantrix.com/atlas/most-profitable-banks.png?v=2026-06-30" alt="The most profitable US banks by return on assets, from FDIC data, by Finantrix Atlas"></a>
<p>Chart: <a href="https://www.finantrix.com/articles/most-profitable-banks">Finantrix Atlas</a>, from FDIC Call Reports.</p>
Frequently asked questions
Q: Which US bank is the most profitable by return on assets? A: Among FDIC-insured banks with $1 billion or more in assets, Square Financial Services, Inc., with a return on assets of 37.85% for the first half of 2026, according to FDIC data.
Q: What is a typical return on assets for a US bank? A: The median bank with $1 billion or more in assets reported 1.25% for the first half of 2026, according to FDIC data.
Q: Why show pretax return on assets? A: Subchapter S banks are generally taxed through their shareholders rather than at the bank level for federal income tax, so their return after tax looks higher than a comparable bank that pays the tax itself. The pretax figure compares them on the same footing.
Download the data
Two CSV files, free: the 50 rows on this page, and the full dataset of all 1,048 rows, as of June 30, 2026.
Frequently Asked Questions
Which US bank is the most profitable by return on assets?
Among FDIC-insured banks with $1 billion or more in assets, Square Financial Services, Inc., with a return on assets of 37.85% for the first half of 2026, according to FDIC data.
What is a typical return on assets for a US bank?
The median bank with $1 billion or more in assets reported 1.25% for the first half of 2026, according to FDIC data.
Why show pretax return on assets?
Subchapter S banks are generally taxed through their shareholders rather than at the bank level for federal income tax, so their return after tax looks higher than a comparable bank that pays the tax itself. The pretax figure compares them on the same footing.