
Key Takeaways
- JPMorgan Chase Bank holds the largest share of deposits in the New York-Newark-Jersey City, NY-NJ metro area, the largest by deposits, 34.1%, according to the FDIC's Summary of Deposits for June 30, 2026.
- In 34 of the 393 US metro areas, a single bank holds more than half of the deposits booked there, according to FDIC data.
- 7 metros are flagged because one office holds more than half of their deposits, which happens where a bank books deposits gathered nationally at one location.
- Every metro code in the survey is a Metropolitan Statistical Area in the Census Bureau's delineation, and the survey's metro totals match BankFind's own.
JPMorgan Chase Bank holds the largest share of deposits in the New York-Newark-Jersey City, NY-NJ metro area, 34.1% of $2.92 trillion, according to the FDIC's Summary of Deposits for June 30, 2026. It is the largest US metro by deposits, with offices of 151 insured banks. Across all 393 metro areas, a single bank holds more than half of the deposits booked there in 34.
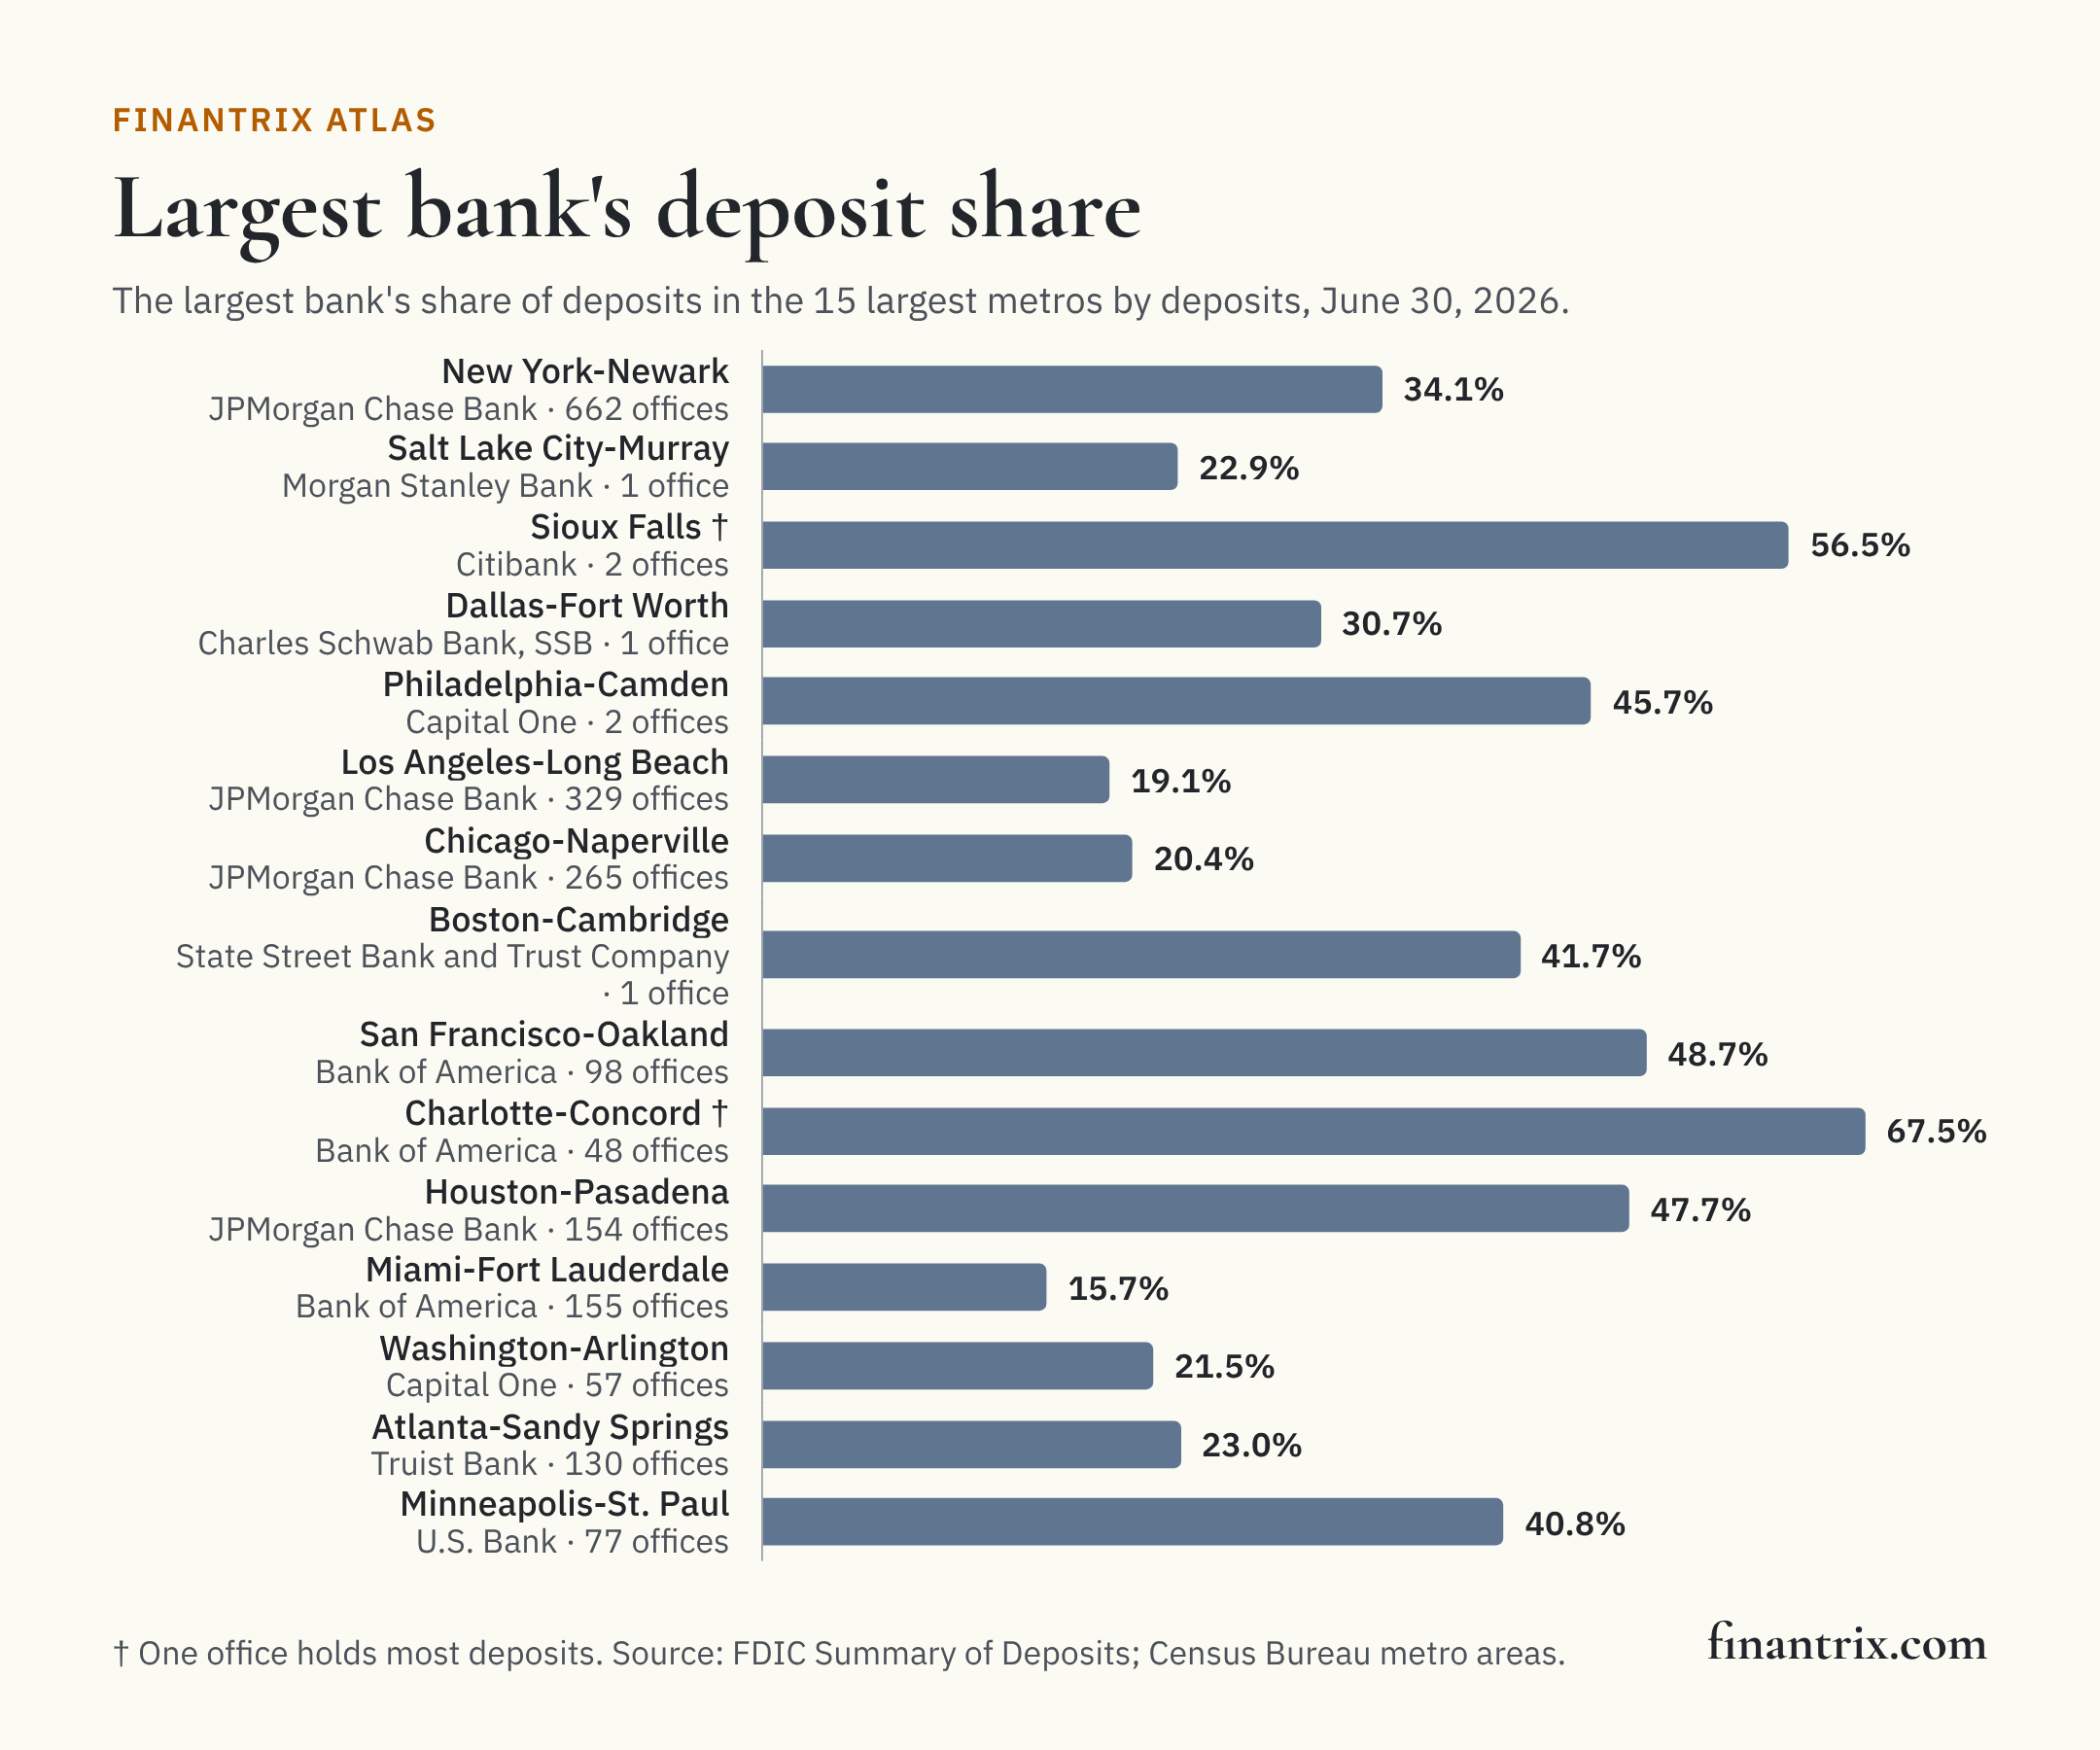
The largest bank in each of the 100 largest metro areas
Ranked by deposits held at bank offices in the metro on June 30, 2026. Each row shows the bank with the largest share, the share held by the three largest, and a concentration index: the sum of every bank's squared percentage share, which is higher when deposits sit with fewer banks.
The survey records deposits at the office a bank assigns them to, which is not always where its depositors live. A large share held at one or two offices is a sign of deposits booked there from elsewhere, so each row shows how many offices the largest bank has in the metro.
| Rank | Metro area | Deposits in the metro | Banks with offices | Largest bank | Its share | Its offices in the metro | Three largest banks' share | Concentration index |
|---|---|---|---|---|---|---|---|---|
| 1 | New York-Newark-Jersey City, NY-NJ | $2.92 trillion | 151 | JPMorgan Chase Bank | 34.1% | 662 | 52.5% | 1,482 |
| 2 | Salt Lake City-Murray, UT | $1.18 trillion | 57 | Morgan Stanley Bank | 22.9% | 1 | 54.0% | 1,355 |
| 3 | Sioux Falls, SD-MN † | $1.13 trillion | 42 | Citibank | 56.5% | 2 | 98.2% | 4,880 |
| 4 | Dallas-Fort Worth-Arlington, TX | $733 billion | 166 | Charles Schwab Bank, SSB | 30.7% | 1 | 66.6% | 1,651 |
| 5 | Philadelphia-Camden-Wilmington, PA-NJ-DE-MD | $685 billion | 88 | Capital One | 45.7% | 2 | 64.2% | 2,397 |
| 6 | Los Angeles-Long Beach-Anaheim, CA | $668 billion | 107 | JPMorgan Chase Bank | 19.1% | 329 | 48.0% | 959 |
| 7 | Chicago-Naperville-Elgin, IL-IN | $631 billion | 147 | JPMorgan Chase Bank | 20.4% | 265 | 45.1% | 917 |
| 8 | Boston-Cambridge-Newton, MA-NH | $580 billion | 100 | State Street Bank and Trust Company | 41.7% | 1 | 67.8% | 2,173 |
| 9 | San Francisco-Oakland-Fremont, CA | $513 billion | 69 | Bank of America | 48.7% | 98 | 77.3% | 2,835 |
| 10 | Charlotte-Concord-Gastonia, NC-SC † | $433 billion | 47 | Bank of America | 67.5% | 48 | 92.3% | 4,952 |
| 11 | Houston-Pasadena-The Woodlands, TX | $360 billion | 107 | JPMorgan Chase Bank | 47.7% | 154 | 65.9% | 2,506 |
| 12 | Miami-Fort Lauderdale-West Palm Beach, FL | $349 billion | 86 | Bank of America | 15.7% | 155 | 38.9% | 716 |
| 13 | Washington-Arlington-Alexandria, DC-VA-MD-WV | $301 billion | 71 | Capital One | 21.5% | 57 | 48.8% | 1,068 |
| 14 | Atlanta-Sandy Springs-Roswell, GA | $255 billion | 81 | Truist Bank | 23.0% | 130 | 57.5% | 1,264 |
| 15 | Minneapolis-St. Paul-Bloomington, MN-WI | $253 billion | 125 | U.S. Bank | 40.8% | 77 | 70.6% | 2,206 |
| 16 | Pittsburgh, PA | $209 billion | 48 | PNC Bank | 47.2% | 89 | 70.3% | 2,582 |
| 17 | Phoenix-Mesa-Chandler, AZ | $192 billion | 55 | Western Alliance Bank | 26.8% | 6 | 63.3% | 1,658 |
| 18 | Cincinnati, OH-KY-IN | $188 billion | 54 | U.S. Bank | 51.2% | 64 | 81.7% | 3,329 |
| 19 | Detroit-Warren-Dearborn, MI | $184 billion | 37 | JPMorgan Chase Bank | 29.2% | 103 | 65.4% | 1,753 |
| 20 | San Jose-Sunnyvale-Santa Clara, CA | $175 billion | 42 | First-Citizens Bank & Trust Company | 24.9% | 3 | 60.8% | 1,524 |
| 21 | San Antonio-New Braunfels, TX † | $175 billion | 66 | USAA Federal Savings Bank | 52.5% | 1 | 78.0% | 3,173 |
| 22 | Seattle-Tacoma-Bellevue, WA | $143 billion | 43 | Bank of America | 25.5% | 92 | 52.7% | 1,288 |
| 23 | St. Louis, MO-IL | $142 billion | 111 | U.S. Bank | 13.0% | 73 | 37.1% | 657 |
| 24 | Cleveland, OH | $136 billion | 35 | KeyBank | 46.5% | 60 | 67.0% | 2,497 |
| 25 | San Diego-Chula Vista-Carlsbad, CA | $135 billion | 42 | JPMorgan Chase Bank | 20.2% | 83 | 52.8% | 1,228 |
| 26 | Tampa-St. Petersburg-Clearwater, FL | $132 billion | 60 | Raymond James Bank | 31.5% | 1 | 52.3% | 1,406 |
| 27 | Columbus, OH | $125 billion | 53 | The Huntington National Bank | 41.5% | 64 | 68.4% | 2,261 |
| 28 | Jacksonville, FL | $121 billion | 36 | Bank of America | 52.4% | 25 | 82.3% | 3,424 |
| 29 | Denver-Aurora-Centennial, CO | $114 billion | 68 | Wells Fargo Bank | 21.2% | 63 | 49.8% | 1,123 |
| 30 | Raleigh-Cary, NC | $110 billion | 37 | First-Citizens Bank & Trust Company | 64.6% | 25 | 78.6% | 4,319 |
| 31 | Nashville-Davidson--Murfreesboro--Franklin, TN | $108 billion | 62 | Pinnacle Bank | 21.1% | 36 | 48.9% | 1,040 |
| 32 | Baltimore-Columbia-Towson, MD | $106 billion | 40 | Bank of America | 29.3% | 60 | 59.9% | 1,575 |
| 33 | Kansas City, MO-KS | $99.1 billion | 114 | UMB Bank | 34.5% | 34 | 49.9% | 1,413 |
| 34 | Sacramento-Roseville-Folsom, CA | $96.6 billion | 37 | U.S. Bank | 40.9% | 32 | 65.0% | 2,133 |
| 35 | Las Vegas-Henderson-North Las Vegas, NV | $95.0 billion | 41 | Bank of America | 21.5% | 40 | 53.8% | 1,237 |
| 36 | Indianapolis-Carmel-Greenwood, IN | $91.8 billion | 49 | JPMorgan Chase Bank | 16.7% | 58 | 45.6% | 911 |
| 37 | Milwaukee-Waukesha, WI | $79.9 billion | 43 | U.S. Bank | 34.3% | 37 | 58.5% | 1,634 |
| 38 | Riverside-San Bernardino-Ontario, CA | $79.7 billion | 36 | JPMorgan Chase Bank | 24.9% | 80 | 64.2% | 1,534 |
| 39 | Bridgeport-Stamford-Danbury, CT | $77.9 billion | 25 | Webster Bank | 40.7% | 19 | 61.7% | 2,038 |
| 40 | San Juan-Bayamón-Caguas, PR | $74.7 billion | 6 | Banco Popular de Puerto Rico | 66.3% | 103 | 92.5% | 4,779 |
| 41 | Austin-Round Rock-San Marcos, TX | $70.4 billion | 73 | JPMorgan Chase Bank | 18.1% | 52 | 46.7% | 949 |
| 42 | Orlando-Kissimmee-Sanford, FL | $68.8 billion | 49 | Truist Bank | 19.1% | 58 | 51.0% | 1,142 |
| 43 | Buffalo-Cheektowaga, NY † | $67.0 billion | 20 | Manufacturers and Traders Trust Company | 63.6% | 48 | 80.1% | 4,268 |
| 44 | Portland-Vancouver-Hillsboro, OR-WA | $65.4 billion | 26 | U.S. Bank | 24.2% | 59 | 59.2% | 1,529 |
| 45 | Providence-Warwick, RI-MA | $61.9 billion | 22 | Citizens Bank | 28.1% | 66 | 56.3% | 1,407 |
| 46 | Oklahoma City, OK | $60.8 billion | 71 | MidFirst Bank | 23.5% | 32 | 45.2% | 974 |
| 47 | Richmond, VA | $60.7 billion | 30 | Bank of America | 42.2% | 17 | 70.0% | 2,347 |
| 48 | Hartford-West Hartford-East Hartford, CT | $58.8 billion | 27 | Bank of America | 47.6% | 28 | 67.9% | 2,612 |
| 49 | Birmingham, AL | $53.8 billion | 49 | Regions Bank | 28.5% | 55 | 49.5% | 1,232 |
| 50 | Louisville/Jefferson County, KY-IN | $48.2 billion | 43 | PNC Bank | 19.2% | 40 | 47.5% | 1,066 |
| 51 | Memphis, TN-MS-AR | $46.3 billion | 48 | First Horizon Bank | 37.8% | 32 | 53.8% | 1,667 |
| 52 | Urban Honolulu, HI | $46.0 billion | 13 | First Hawaiian Bank | 32.6% | 27 | 79.1% | 2,461 |
| 53 | Omaha, NE-IA | $42.7 billion | 77 | First National Bank of Omaha | 35.3% | 29 | 50.8% | 1,500 |
| 54 | Tulsa, OK | $39.3 billion | 59 | BOKF | 31.1% | 21 | 43.3% | 1,177 |
| 55 | Des Moines-West Des Moines, IA | $38.0 billion | 57 | Principal Bank | 24.4% | 1 | 48.2% | 1,088 |
| 56 | Little Rock-North Little Rock-Conway, AR | $36.9 billion | 42 | Bank OZK | 22.8% | 26 | 48.0% | 1,077 |
| 57 | New Orleans-Metairie, LA | $36.0 billion | 32 | Capital One | 25.7% | 19 | 63.5% | 1,531 |
| 58 | Grand Rapids-Wyoming-Kentwood, MI | $34.4 billion | 28 | Fifth Third Bank | 18.9% | 42 | 51.4% | 1,136 |
| 59 | Albany-Schenectady-Troy, NY | $31.2 billion | 19 | KeyBank | 31.3% | 35 | 52.3% | 1,434 |
| 60 | Virginia Beach-Chesapeake-Norfolk, VA-NC | $31.1 billion | 22 | TowneBank | 35.9% | 35 | 68.3% | 2,029 |
| 61 | Madison, WI | $30.1 billion | 41 | BMO Bank | 11.5% | 16 | 31.3% | 602 |
| 62 | North Port-Bradenton-Sarasota, FL | $29.1 billion | 40 | Bank of America | 16.8% | 23 | 41.3% | 835 |
| 63 | Provo-Orem-Lehi, UT | $28.0 billion | 16 | Happen Bank | 38.8% | 1 | 67.7% | 2,104 |
| 64 | Wilmington, NC † | $27.7 billion | 24 | Live Oak Banking Company | 53.1% | 1 | 75.6% | 3,184 |
| 65 | Columbia, SC | $27.2 billion | 28 | Bank of America | 35.8% | 12 | 61.2% | 1,809 |
| 66 | Rochester, NY | $27.0 billion | 19 | Manufacturers and Traders Trust Company | 17.5% | 28 | 47.7% | 1,146 |
| 67 | Baton Rouge, LA | $26.7 billion | 40 | JPMorgan Chase Bank | 31.7% | 19 | 56.9% | 1,497 |
| 68 | Knoxville, TN | $26.6 billion | 42 | First Horizon Bank | 17.3% | 23 | 45.2% | 950 |
| 69 | Greenville-Anderson-Greer, SC | $26.1 billion | 40 | Truist Bank | 13.9% | 24 | 34.9% | 768 |
| 70 | Charleston-North Charleston, SC | $25.6 billion | 37 | Wells Fargo Bank | 20.0% | 20 | 46.4% | 984 |
| 71 | Jackson, MS | $23.5 billion | 30 | Trustmark Bank | 29.6% | 33 | 57.8% | 1,503 |
| 72 | Oxnard-Thousand Oaks-Ventura, CA | $23.4 billion | 21 | JPMorgan Chase Bank | 26.4% | 20 | 69.5% | 1,767 |
| 73 | Wichita, KS | $23.2 billion | 46 | Intrust Bank | 19.5% | 23 | 48.4% | 1,024 |
| 74 | Allentown-Bethlehem-Easton, PA-NJ | $22.9 billion | 32 | Wells Fargo Bank | 17.3% | 23 | 37.8% | 779 |
| 75 | Portland-South Portland, ME | $22.8 billion | 23 | TD Bank | 13.8% | 17 | 37.1% | 823 |
| 76 | Reading, PA | $22.7 billion | 19 | Customers Bank | 37.6% | 2 | 72.3% | 2,270 |
| 77 | Worcester, MA | $22.5 billion | 26 | Bank of America | 13.5% | 11 | 34.7% | 700 |
| 78 | Trenton-Princeton, NJ | $22.1 billion | 22 | Bank of America | 28.5% | 11 | 56.3% | 1,403 |
| 79 | Fresno, CA | $21.1 billion | 22 | Wells Fargo Bank | 18.5% | 14 | 47.1% | 1,064 |
| 80 | Cape Coral-Fort Myers, FL | $21.1 billion | 34 | Wells Fargo Bank | 15.3% | 21 | 38.9% | 803 |
| 81 | New Haven, CT | $20.4 billion | 17 | Bank of America | 20.5% | 16 | 45.9% | 1,105 |
| 82 | Fayetteville-Springdale-Rogers, AR | $20.2 billion | 42 | Arvest Bank | 43.0% | 46 | 56.4% | 2,051 |
| 83 | Harrisburg-Carlisle, PA | $20.2 billion | 25 | PNC Bank | 23.8% | 7 | 45.9% | 1,085 |
| 84 | Albuquerque, NM | $19.8 billion | 26 | Bank of America | 25.5% | 11 | 57.5% | 1,390 |
| 85 | Akron, OH | $19.7 billion | 24 | The Huntington National Bank | 28.5% | 26 | 55.6% | 1,438 |
| 86 | Santa Rosa-Petaluma, CA | $19.7 billion | 14 | Wells Fargo Bank | 24.5% | 11 | 56.1% | 1,424 |
| 87 | Kiryas Joel-Poughkeepsie-Newburgh, NY | $19.5 billion | 26 | JPMorgan Chase Bank | 19.5% | 20 | 41.8% | 915 |
| 88 | Boise City, ID | $19.4 billion | 24 | U.S. Bank | 21.3% | 24 | 48.3% | 1,123 |
| 89 | Naples-Marco Island, FL | $19.2 billion | 37 | Fifth Third Bank | 14.0% | 17 | 37.3% | 756 |
| 90 | Lancaster, PA | $18.9 billion | 25 | Fulton Bank | 29.4% | 20 | 54.4% | 1,422 |
| 91 | Tucson, AZ | $18.8 billion | 18 | JPMorgan Chase Bank | 28.0% | 30 | 70.8% | 1,831 |
| 92 | Durham-Chapel Hill, NC | $18.6 billion | 18 | Banc of California | 38.0% | 1 | 66.0% | 1,984 |
| 93 | Springfield, MO | $17.8 billion | 41 | Great Southern Bank | 11.5% | 20 | 30.4% | 622 |
| 94 | Scranton--Wilkes-Barre, PA | $16.9 billion | 21 | PNC Bank | 20.2% | 15 | 49.2% | 1,106 |
| 95 | Greensboro-High Point, NC | $16.7 billion | 26 | Truist Bank | 20.4% | 21 | 48.2% | 1,097 |
| 96 | Lakeland-Winter Haven, FL | $16.5 billion | 16 | SouthState Bank | 48.0% | 10 | 67.8% | 2,681 |
| 97 | Dayton-Kettering-Beavercreek, OH | $16.3 billion | 26 | Fifth Third Bank | 26.9% | 24 | 57.0% | 1,408 |
| 98 | Syracuse, NY | $16.2 billion | 15 | Manufacturers and Traders Trust Company | 22.5% | 28 | 49.5% | 1,233 |
| 99 | Toledo, OH | $16.1 billion | 22 | The Huntington National Bank | 22.9% | 27 | 53.3% | 1,243 |
| 100 | Lincoln, NE | $16.1 billion | 33 | Union Bank and Trust Company | 37.0% | 20 | 55.2% | 1,691 |
† One office holds more than half of this metro's deposits. The survey records deposits at the office a bank assigns them to, and some banks book deposits gathered across the country at a single office, so this metro's total and shares reflect where deposits are booked more than where depositors live.
Download this table (CSV), free. The full dataset, all 393 metro areas with the two largest banks and the concentration measures, is one email away.
Where one bank holds the most
The metro areas where the largest bank holds the biggest share of deposits, among metros with at least three banks and no single office holding most of the deposits. Banco Popular de Puerto Rico leads with 70.5% in the Arecibo, PR metro area.
| Rank | Metro area | Largest bank | Its share | Banks with offices | Deposits in the metro |
|---|---|---|---|---|---|
| 1 | Arecibo, PR | Banco Popular de Puerto Rico | 70.5% | 3 | $1.3 billion |
| 2 | Guayama, PR | Banco Popular de Puerto Rico | 69.9% | 3 | $566 million |
| 3 | Aguadilla, PR | Banco Popular de Puerto Rico | 68.4% | 3 | $2.3 billion |
| 4 | Mayagüez, PR | Banco Popular de Puerto Rico | 66.4% | 3 | $2.6 billion |
| 5 | San Juan-Bayamón-Caguas, PR | Banco Popular de Puerto Rico | 66.3% | 6 | $74.7 billion |
| 6 | Raleigh-Cary, NC | First-Citizens Bank & Trust Company | 64.6% | 37 | $110 billion |
| 7 | Muncie, IN | First Merchants Bank | 63.6% | 6 | $3.6 billion |
| 8 | Ithaca, NY | Tompkins Community Bank | 63.1% | 11 | $2.9 billion |
| 9 | Abilene, TX | First Financial Bank | 62.3% | 18 | $5.5 billion |
| 10 | Eagle Pass, TX | International Bank of Commerce | 61.9% | 3 | $1.2 billion |
| 11 | Amarillo, TX | Amarillo National Bank | 61.6% | 21 | $11.7 billion |
| 12 | Gettysburg, PA | ACNB Bank | 60.6% | 4 | $1.8 billion |
| 13 | Glens Falls, NY | Arrow Bank | 60.4% | 10 | $4.1 billion |
| 14 | Elmira, NY | Chemung Canal Trust Company | 60.0% | 5 | $1.3 billion |
| 15 | Michigan City-La Porte, IN | Horizon Bank | 57.9% | 8 | $2.7 billion |
| 16 | Victoria, TX | Prosperity Bank | 57.6% | 12 | $2.6 billion |
| 17 | Columbus, GA-AL | Pinnacle Bank | 57.1% | 16 | $9.5 billion |
| 18 | Hammond, LA | First Guaranty Bank | 55.9% | 13 | $3.9 billion |
| 19 | Ponce, PR | Banco Popular de Puerto Rico | 55.3% | 3 | $3.1 billion |
| 20 | Jefferson City, MO | The Central Trust Bank | 54.5% | 20 | $7.7 billion |
| 21 | Jacksonville, FL | Bank of America | 52.4% | 36 | $121 billion |
| 22 | Terre Haute, IN | First Financial Bank | 51.7% | 8 | $4.0 billion |
| 23 | South Bend-Mishawaka, IN-MI | 1st Source Bank | 51.4% | 17 | $6.2 billion |
| 24 | Cincinnati, OH-KY-IN | U.S. Bank | 51.2% | 54 | $188 billion |
| 25 | Columbus, IN | First Financial Bank | 51.1% | 9 | $2.0 billion |
What this means for technology buyers
Deposit share is local: a bank competes for deposits metro by metro, against the banks with offices there and against banks that gather deposits without them. Pricing, products and the channels depositors use decide where those deposits go. These guides compare the options side by side:
- Deposit management platforms for retail banks: product configuration, pricing and the account lifecycle.
- Mobile banking apps for regional banks: competing for depositors beyond the branch footprint.
- Financial BI and dashboarding for bank executives: measuring share and growth by market.
Planning the change before choosing the vendor? The Banking and Payments Capability Matrix states what a bank does, from taking deposits to managing accounts, so a platform can be placed against the capabilities it supports.
More from Finantrix Atlas
- Largest banks in each state by deposits
- US banks with the most branches
- US banks that closed the most branches
- Largest US banks by deposits
How this list was built
The FDIC's Summary of Deposits lists every office of every FDIC-insured institution on June 30, 2026, the deposits the bank assigns to it, and the metro area it sits in. Offices are summed by metro area and by bank; each metro's totals match BankFind's own sums. 16,501 offices holding $1.34 trillion sit outside any metro area and are not ranked.
Metro areas are the Metropolitan Statistical Areas defined by the Office of Management and Budget and published by the US Census Bureau. Every metro code in the survey is checked against the Census Bureau's July 2023 delineation (Census delineation files), and the page prints the Bureau's names.
The concentration index is computed here from the survey's deposits: each bank's share of the metro's deposits in percent, squared, and summed. This page states no threshold for it.
Limits
- Where deposits are booked. Deposits are counted at the office the bank assigns them to, which is not always where the depositor lives. Metros where one office holds most of the deposits are marked and left out of the concentration list.
- Banks with offices only. Credit unions, and banks that gather deposits without an office in the metro, are not counted in a metro's share.
- Insured deposits and others alike. The survey counts all domestic deposits at each office.
- One date. The survey describes June 30, 2026.
Cite this
Free to quote, cite and republish, including the chart, with credit to Finantrix Atlas and a link to this page.
In 34 of 393 US metro areas, a single bank holds more than half of the deposits booked there, according to a Finantrix Atlas analysis of the FDIC's Summary of Deposits for June 30, 2026.
Suggested citation: Finantrix Atlas, "Largest Bank in Each US Metro Area by Deposits," data as of June 30, 2026, from the FDIC Summary of Deposits and US Census Bureau metro area definitions. https://www.finantrix.com/articles/deposit-market-share-by-metro
Embed the chart:
<a href="https://www.finantrix.com/articles/deposit-market-share-by-metro"><img src="https://www.finantrix.com/atlas/deposit-market-share-by-metro.png?v=2026-06-30" alt="The largest bank's deposit share in each large US metro area, from FDIC data, by Finantrix Atlas"></a>
<p>Chart: <a href="https://www.finantrix.com/articles/deposit-market-share-by-metro">Finantrix Atlas</a>, from the FDIC Summary of Deposits.</p>
Frequently asked questions
Q: Which bank has the largest deposit share in the biggest US metro area? A: JPMorgan Chase Bank, with 34.1% of deposits in the New York-Newark-Jersey City, NY-NJ metro area on June 30, 2026, according to the FDIC's Summary of Deposits.
Q: How many US metro areas have one dominant bank? A: In 34 of 393 metro areas, a single bank held more than half of the deposits booked there on June 30, 2026, according to FDIC data.
Q: Why do some small metros show enormous deposits? A: The survey records deposits at the office a bank assigns them to, and some banks book deposits from depositors nationwide at one office. Those metros are marked on this page.
Download the data
Two CSV files, free: the 100 rows on this page, and the full dataset of all 393 rows, as of June 30, 2026.
Frequently Asked Questions
Which bank has the largest deposit share in the biggest US metro area?
JPMorgan Chase Bank, with 34.1% of deposits in the New York-Newark-Jersey City, NY-NJ metro area on June 30, 2026, according to the FDIC's Summary of Deposits.
How many US metro areas have one dominant bank?
In 34 of 393 metro areas, a single bank held more than half of the deposits booked there on June 30, 2026, according to FDIC data.
Why do some small metros show enormous deposits?
The survey records deposits at the office a bank assigns them to, and some banks book deposits from depositors nationwide at one office. Those metros are marked on this page.