
Key Takeaways
- The median federally insured US credit union reported a net worth ratio of 12.66% on June 30, 2026, according to NCUA data; among the 25 largest it ranged from 8.33% to 18.56%.
- 4,156 of 4,214 credit unions, 98.6%, were classified well capitalized on their Call Report data, and 31 were below adequately capitalized.
- Across all federally insured credit unions, net worth was $285 billion, 11.42% of assets, matching the NCUA's own summary for the quarter.
- Among credit unions of $1.0 billion or more, Self-Help reported the highest net worth ratio, 25.18%.
The median federally insured US credit union reported a net worth ratio of 12.66% on June 30, 2026, according to NCUA Call Report data. The ratio is a credit union's net worth, its retained earnings plus, for a low-income designated credit union, certain subordinated debt, as a share of its assets. Among the 25 largest credit unions by assets it ranged from 8.33% to 18.56%, and Navy Federal, the largest, reported 11.65%.
Across all 4,214 federally insured credit unions, net worth was $285 billion, 11.42% of assets, according to the NCUA. Both figures match the NCUA's own published summary for the quarter.
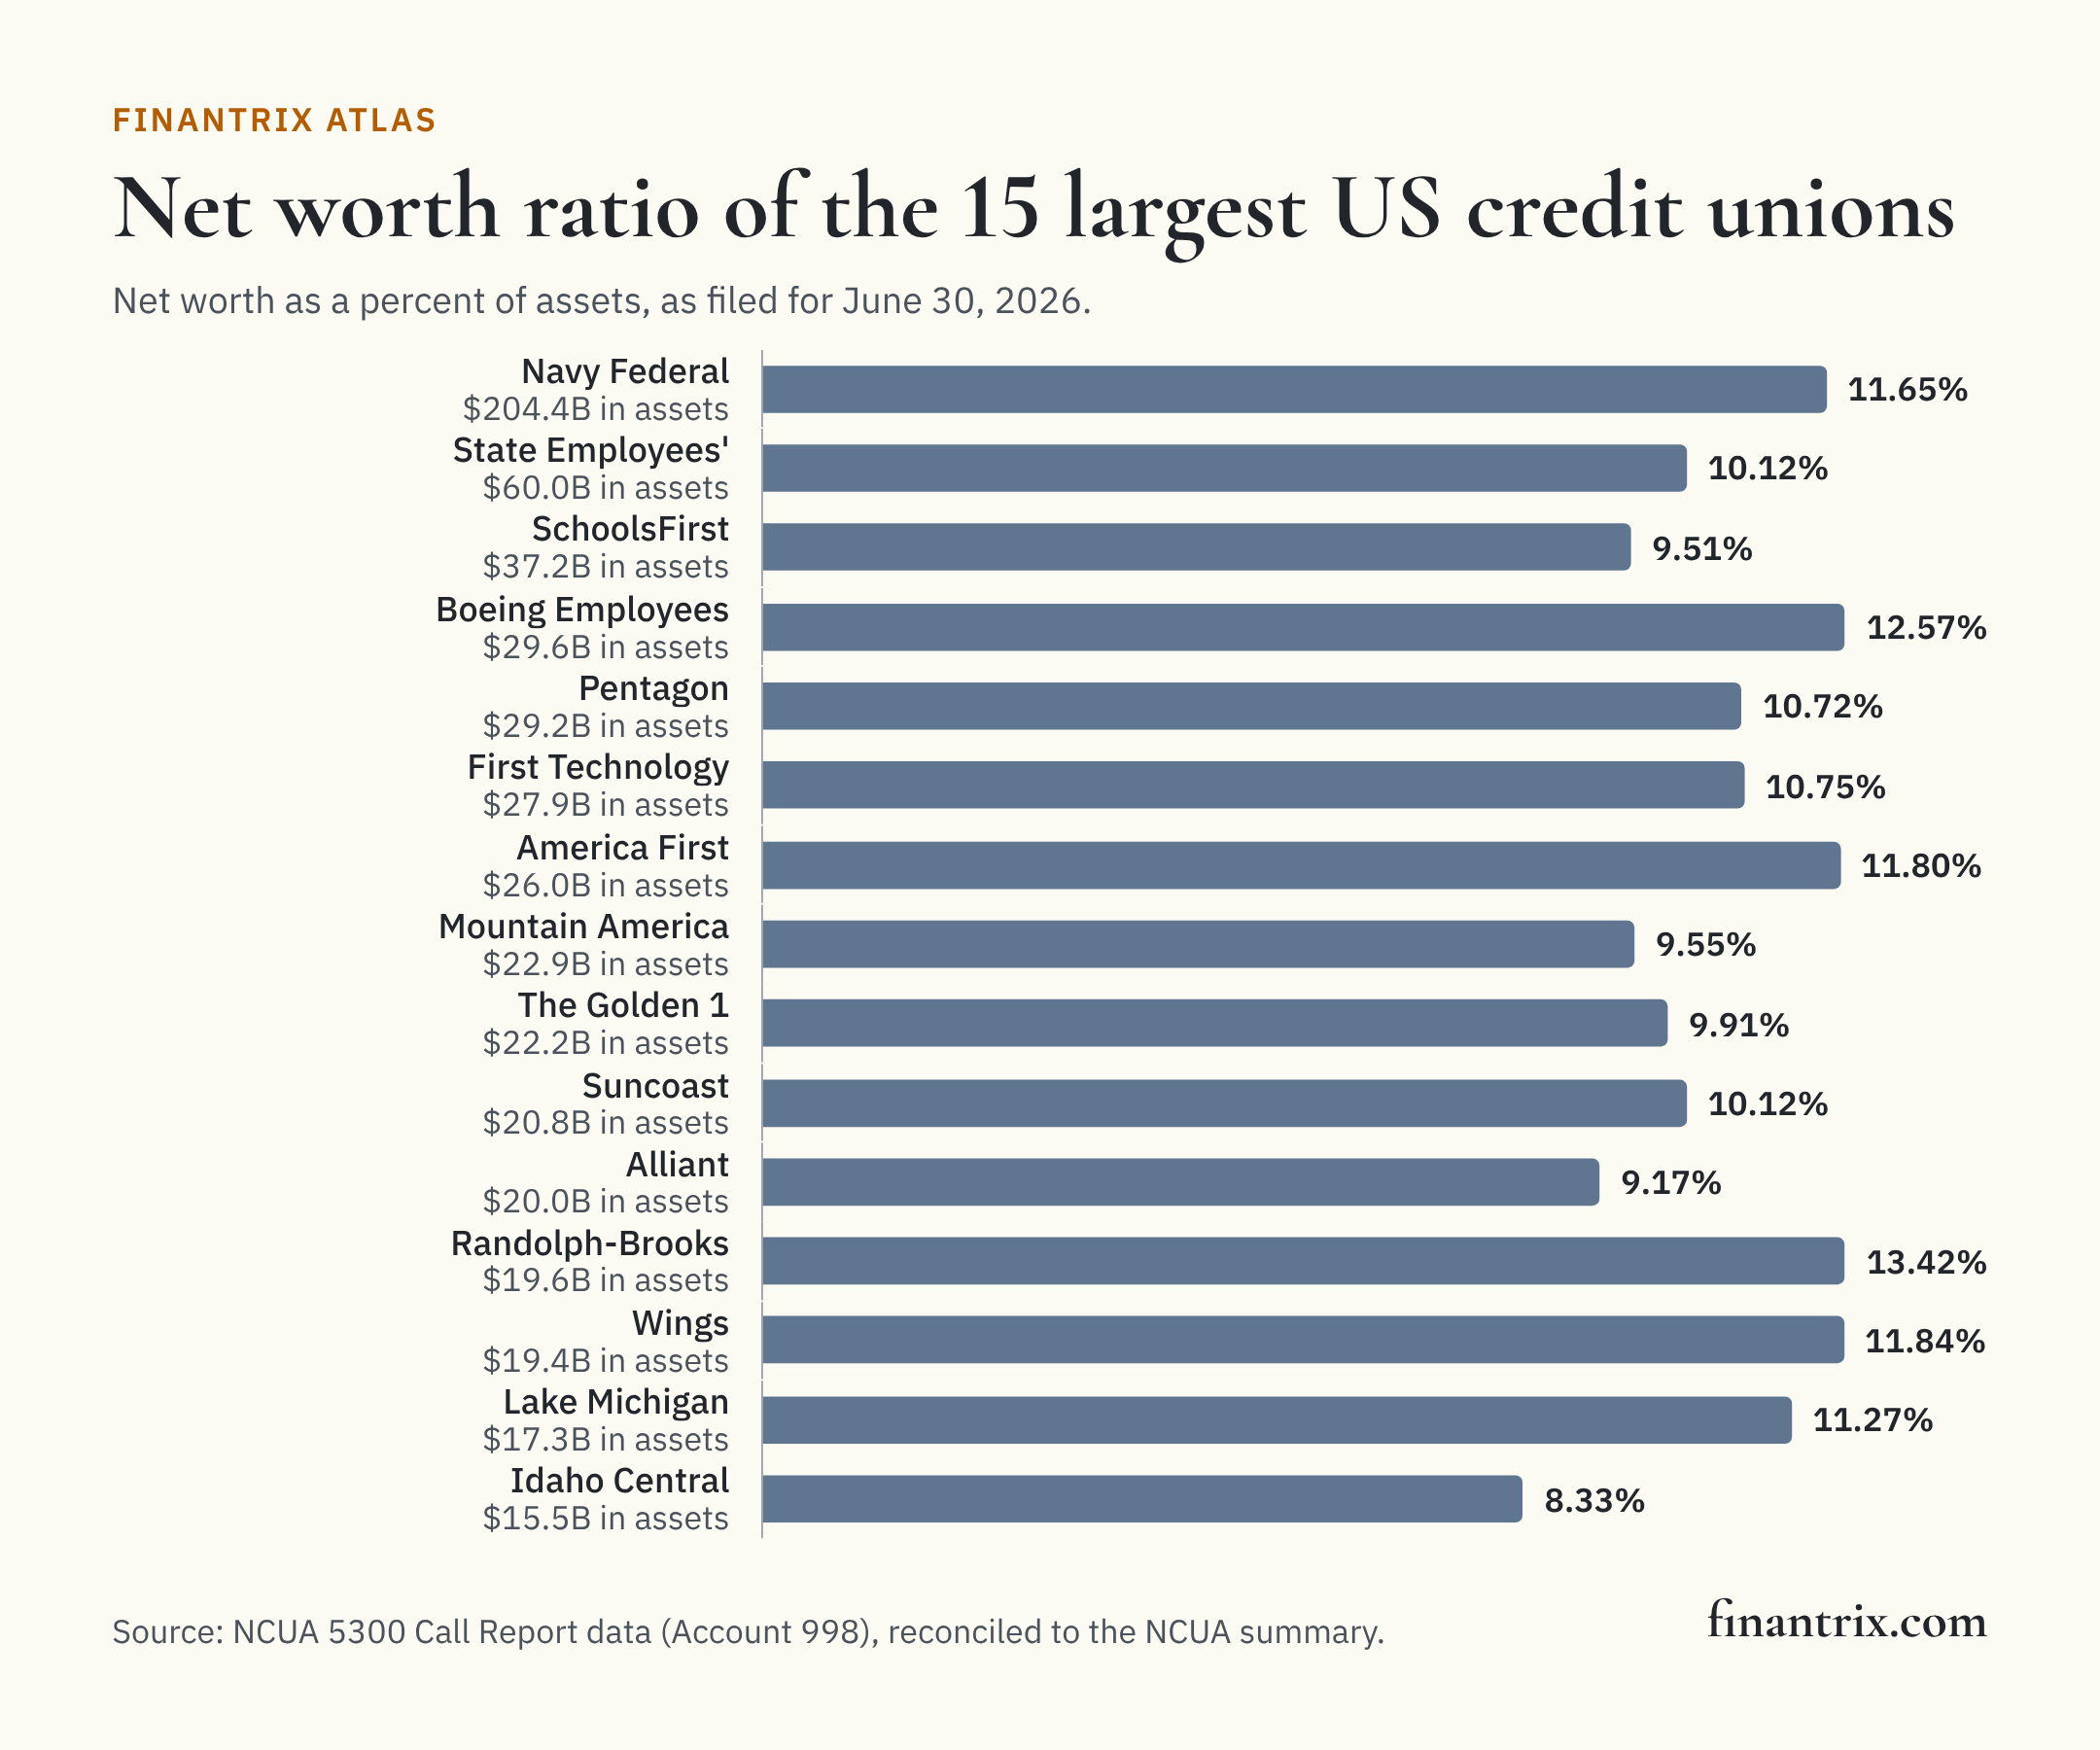
The 25 largest credit unions
The largest credit unions by total assets on June 30, 2026, with the net worth ratio each reported to the NCUA and its net worth. Names are as the NCUA lists them, which usually leaves out "Credit Union".
| Rank by assets | Credit union | Headquarters | Net worth ratio | Net worth | Total assets | Source |
|---|---|---|---|---|---|---|
| 1 | Navy Federal | Vienna, VA | 11.65% | $23.8 billion | $204 billion | NCUA |
| 2 | State Employees' | Raleigh, NC | 10.12% | $6.1 billion | $60.0 billion | NCUA |
| 3 | SchoolsFirst | Tustin, CA | 9.51% | $3.5 billion | $37.2 billion | NCUA |
| 4 | Boeing Employees | Tukwila, WA | 12.57% | $3.7 billion | $29.6 billion | NCUA |
| 5 | Pentagon | McLean, VA | 10.72% | $3.1 billion | $29.2 billion | NCUA |
| 6 | First Technology | San Jose, CA | 10.75% | $3.0 billion | $27.9 billion | NCUA |
| 7 | America First | Riverdale, UT | 11.80% | $2.9 billion | $26.0 billion | NCUA |
| 8 | Mountain America | Sandy, UT | 9.55% | $2.2 billion | $22.9 billion | NCUA |
| 9 | The Golden 1 | Sacramento, CA | 9.91% | $2.2 billion | $22.2 billion | NCUA |
| 10 | Suncoast | Tampa, FL | 10.12% | $2.1 billion | $20.8 billion | NCUA |
| 11 | Alliant | Chicago, IL | 9.17% | $1.8 billion | $20.0 billion | NCUA |
| 12 | Randolph-Brooks | Live Oak, TX | 13.42% | $2.6 billion | $19.6 billion | NCUA |
| 13 | Wings | Colorado Springs, CO | 11.84% | $2.3 billion | $19.4 billion | NCUA |
| 14 | Lake Michigan | Caledonia, MI | 11.27% | $1.9 billion | $17.3 billion | NCUA |
| 15 | Idaho Central | Chubbuck, ID | 8.33% | $1.3 billion | $15.5 billion | NCUA |
| 16 | FourLeaf | Bethpage, NY | 9.12% | $1.3 billion | $14.4 billion | NCUA |
| 17 | Security Service | San Antonio, TX | 11.26% | $1.6 billion | $14.4 billion | NCUA |
| 18 | VyStar | Jacksonville, FL | 8.93% | $1.2 billion | $14.3 billion | NCUA |
| 19 | Global | Anchorage, AK | 9.70% | $1.3 billion | $13.0 billion | NCUA |
| 20 | GreenState | North Liberty, IA | 9.03% | $988 million | $10.9 billion | NCUA |
| 21 | ESL | Rochester, NY | 16.40% | $1.8 billion | $10.8 billion | NCUA |
| 22 | Redwood | Santa Rosa, CA | 13.26% | $1.3 billion | $10.7 billion | NCUA |
| 23 | United Nations | Long Island City, NY | 9.78% | $1.0 billion | $10.7 billion | NCUA |
| 24 | Police & Fire | Philadelphia, PA | 18.56% | $1.9 billion | $10.2 billion | NCUA |
| 25 | Eastman | Kingsport, TN | 14.87% | $1.5 billion | $10.2 billion | NCUA |
The highest ratios among credit unions of $1.0 billion or more
Ranked by net worth ratio among the 471 credit unions with $1.0 billion or more in assets, whose median was 10.85%. Self-Help reports the highest, 25.18%, followed by Self-Help at 24.51%. The ratio needed to make this list is 14.52% or higher.
| Rank | Credit union | Headquarters | Net worth ratio | Net worth | Total assets |
|---|---|---|---|---|---|
| 1 | Self-Help | Durham, NC | 25.18% | $607 million | $2.4 billion |
| 2 | Self-Help | Durham, NC | 24.51% | $532 million | $2.2 billion |
| 3 | Latino Community | Durham, NC | 24.23% | $252 million | $1.0 billion |
| 4 | LAFCU | Lansing, MI | 20.67% | $233 million | $1.1 billion |
| 5 | Family Security | Decatur, AL | 19.92% | $217 million | $1.1 billion |
| 6 | San Diego County | San Diego, CA | 19.82% | $1.9 billion | $9.5 billion |
| 7 | Zeal | Livonia, MI | 19.82% | $210 million | $1.1 billion |
| 8 | Webster First | Worcester, MA | 19.66% | $300 million | $1.5 billion |
| 9 | AllSouth | Columbia, SC | 19.60% | $297 million | $1.5 billion |
| 10 | East Texas Professional | Longview, TX | 19.38% | $280 million | $1.4 billion |
| 11 | Police & Fire | Philadelphia, PA | 18.56% | $1.9 billion | $10.2 billion |
| 12 | Orion | Memphis, TN | 18.42% | $240 million | $1.3 billion |
| 13 | Park | Louisville, KY | 17.86% | $255 million | $1.4 billion |
| 14 | ELGA | Grand Blanc, MI | 17.80% | $445 million | $2.5 billion |
| 15 | Robins Financial | Warner Robins, GA | 17.61% | $876 million | $5.0 billion |
| 16 | DATCU | Corinth, TX | 17.19% | $307 million | $1.8 billion |
| 17 | Self Reliance Financial | New York, NY | 17.16% | $350 million | $2.0 billion |
| 18 | One Nevada | Las Vegas, NV | 16.73% | $251 million | $1.5 billion |
| 19 | First Financial of Maryland | Sparks, MD | 16.73% | $240 million | $1.4 billion |
| 20 | Kellogg Community | Battle Creek, MI | 16.71% | $171 million | $1.0 billion |
| 21 | 1st Advantage | Yorktown, VA | 16.66% | $181 million | $1.1 billion |
| 22 | Houston Police | Houston, TX | 16.42% | $167 million | $1.0 billion |
| 23 | ESL | Rochester, NY | 16.40% | $1.8 billion | $10.8 billion |
| 24 | Safe 1 | Bakersfield, CA | 16.03% | $186 million | $1.2 billion |
| 25 | Abound | Radcliff, KY | 15.85% | $437 million | $2.8 billion |
| 26 | Michigan First | Lathrup Village, MI | 15.80% | $235 million | $1.5 billion |
| 27 | Utilities Employees | Wyomissing, PA | 15.73% | $237 million | $1.5 billion |
| 28 | Gulf Coast Educators | Pasadena, TX | 15.70% | $199 million | $1.3 billion |
| 29 | Logix | Valencia, CA | 15.67% | $1.5 billion | $9.7 billion |
| 30 | Westby Co-Op | Westby, WI | 15.64% | $160 million | $1.0 billion |
| 31 | S. C. State | Columbia, SC | 15.57% | $229 million | $1.5 billion |
| 32 | Pacific Service | Concord, CA | 15.54% | $206 million | $1.3 billion |
| 33 | Credit Union 1 | Anchorage, AK | 15.48% | $242 million | $1.7 billion |
| 34 | Operating Engineers Local Union #3 | Livermore, CA | 15.48% | $262 million | $1.7 billion |
| 35 | Genisys | Auburn Hills, MI | 15.47% | $1.0 billion | $6.6 billion |
| 36 | Educational | Miami, FL | 15.45% | $285 million | $1.8 billion |
| 37 | Merck Employees | Rahway, NJ | 15.45% | $260 million | $1.7 billion |
| 38 | Superior | Lima, OH | 15.20% | $299 million | $2.0 billion |
| 39 | Members 1st | Enola, PA | 15.13% | $1.3 billion | $8.7 billion |
| 40 | OnPoint Community | Portland, OR | 15.00% | $1.4 billion | $9.5 billion |
| 41 | Mayo Employees | Rochester, MN | 14.90% | $223 million | $1.5 billion |
| 42 | Eastman | Kingsport, TN | 14.87% | $1.5 billion | $10.2 billion |
| 43 | Midwest America | Fort Wayne, IN | 14.80% | $145 million | $1.0 billion |
| 44 | Tennessee Valley | Chattanooga, TN | 14.75% | $481 million | $3.3 billion |
| 45 | Tinker | Oklahoma City, OK | 14.72% | $901 million | $6.1 billion |
| 46 | Neches | Port Neches, TX | 14.66% | $180 million | $1.2 billion |
| 47 | Southern Energy | Birmingham, AL | 14.59% | $525 million | $3.6 billion |
| 48 | Educational Employees | Fresno, CA | 14.58% | $782 million | $5.4 billion |
| 49 | Ascend | Tullahoma, TN | 14.55% | $705 million | $4.8 billion |
| 50 | MAX | Montgomery, AL | 14.52% | $345 million | $2.4 billion |
Download this table (CSV), free. The full dataset, every federally insured credit union with its net worth, assets, ratio and classification, is one email away.
How many credit unions are well capitalized
NCUA rules place a credit union in a capital category by its net worth ratio: 7.0 percent or greater is well capitalized, 6.0 percent or greater adequately capitalized, and three categories below 6.0 percent, divided at 4.0 percent and 2.0 percent. A complex credit union, one with more than $500 million in assets, must also meet a risk-based capital requirement unless it has opted into the complex credit union leverage ratio, so its category can be lower than its net worth ratio alone would place it.
The Call Report records the classification that follows from each credit union's own filing. On June 30, 2026:
| Classification on Call Report data | Credit unions | Share |
|---|---|---|
| Well Capitalized | 4,156 | 98.6% |
| Adequately Capitalized | 27 | 0.6% |
| Undercapitalized | 18 | 0.4% |
| Significantly Undercapitalized | 5 | 0.1% |
| Critically Undercapitalized | 8 | 0.2% |
6 credit unions are classified lower than their net worth ratio alone would place them; all of them are complex credit unions. These counts are of classifications computed from Call Report data. The NCUA's own supervisory determination can differ, and this page does not name the credit unions below well capitalized.
What this means for technology buyers
Net worth grows from earnings, and a credit union manages it through the ledger, the forecasts behind its budget, and the capital reporting it files each quarter. These guides compare the options side by side:
- Regulatory reporting platforms: computing and reporting capital ratios.
- Ledger systems for financial services: the books net worth is computed from.
- Financial BI and dashboarding for executives: tracking capital against growth plans.
Planning the change before choosing the vendor? The Banking and Payments Capability Matrix states what a depository institution does, from taking deposits to reporting to regulators, so a platform can be placed against the capabilities it supports.
More from Finantrix Atlas
- Largest credit unions in the US, ranked by assets
- US banks by leverage ratio
- Credit unions by state
- Fastest-growing credit unions
How this list was built
The universe is every federal credit union and federally insured state-chartered credit union in the NCUA's quarterly Call Report data for June 30, 2026. The ratio is Account 998, the net worth ratio each credit union reports for prompt corrective action, as filed. NCUA rules define it as net worth to total assets, rounded to two decimal places, and let each credit union choose every quarter how total assets are measured: the quarter-end balance, or an average of quarter-end, month-end or daily balances. So the ratio is not recomputed here. For 3,985 credit unions it equals net worth (Account 997) over quarter-end assets, excluding Paycheck Protection Program loans pledged to the Federal Reserve's facility (Account NW0010); the other 229 measured assets another way. The classification is Account 700.
The NCUA separately publishes a Quarterly Credit Union Data Summary from the same filings. This page reproduces its count of credit unions, total assets, aggregate net worth and the ratio of the two. The summary's net worth leaves out the CECL transition provision (Account NW0004), an add-back the rules allow for prompt corrective action through 2026, so the aggregate here does too; each credit union's own ratio includes it where it applies.
Limits
- A ratio, not a rating. Net worth to assets treats every asset alike. It says nothing about credit quality, interest rate risk or liquidity, and for complex credit unions it is one of two capital tests.
- Classifications from the filing. The categories counted above follow from the Call Report data; a credit union classified as "new" has its own categories, and the NCUA can reach a different supervisory conclusion.
- Assets measured four ways. Because each credit union picks its measure of assets, two credit unions with the same net worth and quarter-end assets can report different ratios.
- Federally insured only. Privately insured credit unions are not in it. One publisher, one quarter, June 30, 2026.
Cite this
Free to quote, cite and republish, including the chart, with credit to Finantrix Atlas and a link to this page.
The median federally insured US credit union reported a net worth ratio of 12.66% on June 30, 2026, and 98.6% were classified well capitalized on their Call Report data, according to a Finantrix Atlas analysis of NCUA data.
Suggested citation: Finantrix Atlas, "US Credit Unions by Net Worth Ratio," data as of June 30, 2026, from NCUA Call Report data. https://www.finantrix.com/articles/credit-unions-net-worth-ratio
Embed the chart:
<a href="https://www.finantrix.com/articles/credit-unions-net-worth-ratio"><img src="https://www.finantrix.com/atlas/credit-unions-net-worth-ratio.png?v=2026-06-30" alt="Net worth ratio of the largest US credit unions, from Finantrix Atlas"></a>
<p>Chart: <a href="https://www.finantrix.com/articles/credit-unions-net-worth-ratio">Finantrix Atlas</a>, from NCUA Call Report data.</p>
Frequently asked questions
Q: What is a credit union's net worth ratio? A: Its net worth, chiefly its retained earnings, as a percentage of its total assets, as NCUA rules define it. The median federally insured credit union reported 12.66% on June 30, 2026, according to NCUA data.
Q: What net worth ratio makes a credit union well capitalized? A: 7.0 percent or greater, under 12 CFR 702.102. A complex credit union must also meet a risk-based capital requirement or have opted into the complex credit union leverage ratio.
Q: How many credit unions are well capitalized? A: 4,156 of the 4,214 federally insured credit unions, 98.6%, on their Call Report data for June 30, 2026, according to the NCUA.
Q: What is the net worth ratio of the largest credit union? A: Navy Federal reported 11.65% on June 30, 2026, according to its Call Report filed with the NCUA.
Download the data
Two CSV files, free: the 50 rows on this page, and the full dataset of all 4,214 rows, as of June 30, 2026.
Frequently Asked Questions
What is a credit union's net worth ratio?
Its net worth, chiefly its retained earnings, as a percentage of its total assets, as NCUA rules define it. The median federally insured credit union reported 12.66% on June 30, 2026, according to NCUA data.
What net worth ratio makes a credit union well capitalized?
7.0 percent or greater, under 12 CFR 702.102. A complex credit union must also meet a risk-based capital requirement or have opted into the complex credit union leverage ratio.
How many credit unions are well capitalized?
4,156 of the 4,214 federally insured credit unions, 98.6%, on their Call Report data for June 30, 2026, according to the NCUA.
What is the net worth ratio of the largest credit union?
Navy Federal reported 11.65% on June 30, 2026, according to its Call Report filed with the NCUA.