
Key Takeaways
- According to NCUA data, the number of federally insured credit unions fell from 5,887 on June 30, 2016 to 4,214 on June 30, 2026, 28.4% in ten years, or 3.3% a year.
- In NCUA data, credit unions with less than $100 million in assets went from 4,345 to 2,438, while those with $500 million or more went from 494 to 748.
- Of the 1,723 credit unions under $10 million on June 30, 2016, 50.5% no longer filed a Call Report on June 30, 2026, according to the NCUA, against 5.1% of those with $500 million or more.
- According to the NCUA, the 471 credit unions with $1 billion or more in assets hold 79.5% of federally insured credit union assets and serve 76.7% of members on June 30, 2026.
The number of federally insured US credit unions fell from 5,887 on June 30, 2016 to 4,214 on June 30, 2026, a drop of 28.4%, or 3.3% a year, according to NCUA data. In NCUA data, credit unions with less than $100 million in assets went from 4,345 to 2,438, a loss larger than the whole system's, while those with $500 million or more went from 494 to 748. The total fell in every one of the ten years. Of the 1,723 credit unions that had less than $10 million in assets ten years ago, 50.5% no longer filed a Call Report on June 30, 2026, according to the NCUA; of those with $500 million or more, 5.1%.
According to NCUA data, the 471 credit unions with $1 billion or more in assets, 11.2% of the total, hold 79.5% of credit union assets and serve 76.7% of members. The tiers are the asset-size groups the NCUA uses in its Quarterly Credit Union Data Summary. Every year's total below matches that publication, and so does every tier count for the years it prints them.
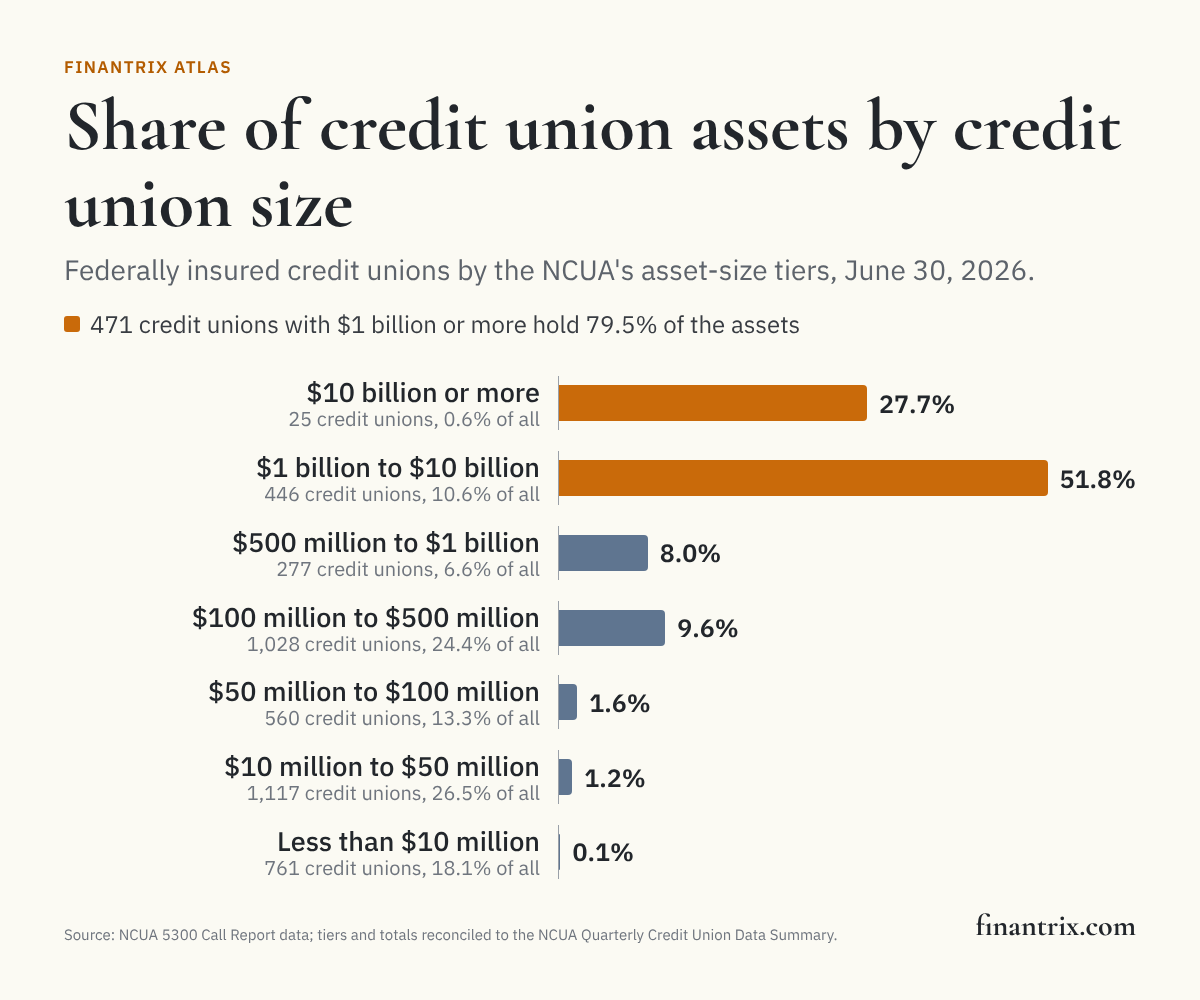
US credit unions by asset tier, June 30, 2026
Each federally insured credit union is placed in a tier by the total assets in its Call Report for June 30, 2026. Shares are of all federally insured credit unions. The last columns compare the count with June 30, 2016.
| Asset tier | Credit unions | Share of credit unions | Total assets | Share of assets | Share of members | Credit unions, June 30, 2016 | Change | Source |
|---|---|---|---|---|---|---|---|---|
| Less than $10 million | 761 | 18.1% | $3.2 billion | 0.1% | 0.4% | 1,723 | −962 | NCUA, NCUA |
| $10 million to $50 million | 1,117 | 26.5% | $29.8 billion | 1.2% | 1.8% | 1,901 | −784 | NCUA, NCUA |
| $50 million to $100 million | 560 | 13.3% | $40.8 billion | 1.6% | 2.1% | 721 | −161 | NCUA, NCUA |
| $100 million to $500 million | 1,028 | 24.4% | $239 billion | 9.6% | 10.7% | 1,048 | −20 | NCUA, NCUA |
| $500 million to $1 billion | 277 | 6.6% | $199 billion | 8.0% | 8.3% | 229 | +48 | NCUA, NCUA |
| $1 billion to $10 billion | 446 | 10.6% | $1.30 trillion | 51.8% | 48.1% | 259 | +187 | NCUA, NCUA |
| $10 billion or more | 25 | 0.6% | $691 billion | 27.7% | 28.6% | 6 | +19 | NCUA, NCUA |
| All federally insured credit unions | 4,214 | 100.0% | $2.50 trillion | 100.0% | 100.0% | 5,887 | −1,673 | NCUA, NCUA |
Download the tier figures for every year (CSV), free. The full dataset, every federally insured credit union in every year with its tier, assets, members and NCUA charter number, and where each credit union of 2016 stood in 2026, is one email away.
How fast the count is falling
According to the NCUA, the number of federally insured credit unions fell by between 135 and 216 a year over the ten years to June 30, 2026, 1,673 in all.
Credit unions in each tier, on the same date each year:
| Date (NCUA data) | <$10M | $10M–$50M | $50M–$100M | $100M–$500M | $500M–$1B | $1B–$10B | $10B+ | All | Fewer than a year earlier | Source |
|---|---|---|---|---|---|---|---|---|---|---|
| June 30, 2016 | 1,723 | 1,901 | 721 | 1,048 | 229 | 259 | 6 | 5,887 | NCUA | |
| June 30, 2017 | 1,585 | 1,813 | 732 | 1,046 | 238 | 275 | 7 | 5,696 | −191 | NCUA |
| June 30, 2018 | 1,464 | 1,731 | 709 | 1,034 | 240 | 293 | 9 | 5,480 | −216 | NCUA |
| June 30, 2019 | 1,363 | 1,677 | 680 | 1,012 | 259 | 307 | 10 | 5,308 | −172 | NCUA |
| June 30, 2020 | 1,231 | 1,580 | 665 | 1,061 | 270 | 343 | 14 | 5,164 | −144 | NCUA |
| June 30, 2021 | 1,084 | 1,498 | 694 | 1,073 | 288 | 373 | 19 | 5,029 | −135 | NCUA |
| June 30, 2022 | 990 | 1,393 | 684 | 1,083 | 291 | 391 | 21 | 4,853 | −176 | NCUA |
| June 30, 2023 | 945 | 1,320 | 653 | 1,060 | 287 | 399 | 22 | 4,686 | −167 | NCUA |
| June 30, 2024 | 899 | 1,236 | 622 | 1,058 | 276 | 421 | 21 | 4,533 | −153 | NCUA |
| June 30, 2025 | 830 | 1,178 | 581 | 1,042 | 284 | 433 | 22 | 4,370 | −163 | NCUA |
| June 30, 2026 | 761 | 1,117 | 560 | 1,028 | 277 | 446 | 25 | 4,214 | −156 | NCUA |
Share of credit union assets held by each tier:
| Date (NCUA data) | <$10M | $10M–$50M | $50M–$100M | $100M–$500M | $500M–$1B | $1B–$10B | $10B+ | All credit union assets | Source |
|---|---|---|---|---|---|---|---|---|---|
| June 30, 2016 | 0.6% | 3.8% | 4.1% | 18.5% | 12.8% | 46.8% | 13.5% | $1.25 trillion | NCUA |
| June 30, 2017 | 0.5% | 3.3% | 3.9% | 17.3% | 12.4% | 48.1% | 14.4% | $1.35 trillion | NCUA |
| June 30, 2018 | 0.4% | 3.0% | 3.6% | 16.3% | 11.9% | 48.5% | 16.3% | $1.43 trillion | NCUA |
| June 30, 2019 | 0.4% | 2.8% | 3.2% | 14.7% | 11.9% | 49.4% | 17.6% | $1.52 trillion | NCUA |
| June 30, 2020 | 0.3% | 2.3% | 2.7% | 13.5% | 10.9% | 49.9% | 20.4% | $1.75 trillion | NCUA |
| June 30, 2021 | 0.2% | 2.0% | 2.6% | 12.3% | 10.3% | 49.6% | 23.1% | $1.98 trillion | NCUA |
| June 30, 2022 | 0.2% | 1.7% | 2.3% | 11.6% | 9.8% | 49.8% | 24.6% | $2.14 trillion | NCUA |
| June 30, 2023 | 0.2% | 1.6% | 2.1% | 11.0% | 9.5% | 50.6% | 25.0% | $2.22 trillion | NCUA |
| June 30, 2024 | 0.2% | 1.4% | 2.0% | 10.6% | 8.7% | 52.3% | 24.9% | $2.30 trillion | NCUA |
| June 30, 2025 | 0.1% | 1.3% | 1.8% | 10.1% | 8.6% | 52.6% | 25.5% | $2.38 trillion | NCUA |
| June 30, 2026 | 0.1% | 1.2% | 1.6% | 9.6% | 8.0% | 51.8% | 27.7% | $2.50 trillion | NCUA |
- In NCUA data, every tier below $100 million shrank over the decade and every tier from $500 million up grew. The tier from $100 million to $500 million shrank, from 1,048 credit unions to 1,028.
- Credit unions with $10 billion or more in assets went from 6 to 25, and they hold 27.7% of credit union assets, according to the NCUA.
- The median federally insured credit union held $28 million in assets on June 30, 2016 and $68 million on June 30, 2026, according to NCUA data.
- The largest tier by count is still $10 million to $50 million, with 1,117 credit unions, according to the NCUA.
Where a tier's credit unions went
A tier's count falls for two reasons: a credit union stops filing, or it grows into the next tier. The table below follows every credit union that filed on June 30, 2016 to June 30, 2026. A credit union stops filing when it merges into another, liquidates, converts to another kind of charter or leaves federal insurance; the Call Report does not say which.
| Tier on June 30, 2016 | Credit unions then | No longer filing on June 30, 2026 | Same tier now | Larger tier now | Smaller tier now | Source |
|---|---|---|---|---|---|---|
| Less than $10 million | 1,723 | 50.5% | 709 | 144 | 0 | NCUA, NCUA |
| $10 million to $50 million | 1,901 | 29.6% | 968 | 336 | 34 | NCUA, NCUA |
| $50 million to $100 million | 721 | 15.4% | 253 | 351 | 6 | NCUA, NCUA |
| $100 million to $500 million | 1,048 | 12.4% | 637 | 276 | 5 | NCUA, NCUA |
| $500 million to $1 billion | 229 | 5.2% | 40 | 177 | 0 | NCUA, NCUA |
| $1 billion to $10 billion | 259 | 5.0% | 227 | 19 | 0 | NCUA, NCUA |
| $10 billion or more | 6 | 0.0% | 6 | 0 | 0 | NCUA, NCUA |
- According to NCUA data, 50.5% of the credit unions that had less than $10 million ten years ago no longer file, and 144 have grown into a larger tier.
- The share that stopped filing falls with each step up in size: 29.6% of the tier from $10 million to $50 million, 15.4% of the tier from $50 million to $100 million, 12.4% of the tier from $100 million to $500 million, 5.2% of the tier from $500 million to $1 billion and 5.0% of the tier from $1 billion to $10 billion, according to the NCUA.
- Only 26 credit unions that file today did not file as a federally insured credit union ten years ago, in NCUA data, against 1,699 that stopped filing. The decline is credit unions leaving, with few entering.
Who absorbed whom is in the NCUA's merger reports, not the Call Report; the credit union mergers page counts them.
What this means for technology buyers
Fewer, larger credit unions change what gets bought. For the continuing credit union, each merger means converting the merging credit union's members onto its own core, cards and online banking. These guides compare the options side by side:
- Cloud-based core banking systems: what a move off a legacy core involves, and who can take it on.
- Mobile banking apps: digital channel platforms for institutions below money-center scale.
- Deposit management platforms: for competing on share and deposit growth.
- Credit decision engines for consumer lending: auto, card and personal loan decisioning.
Planning the change before choosing the vendor? The Retail Bank Business Capability Model maps the work a credit union shares with a retail bank, whatever its size.
More from Finantrix Atlas
- Largest credit unions in the US, ranked by assets
- Credit union mergers
- Fastest-growing credit unions
- Largest credit union in each state
- US banks by asset tier
How this list was built
The universe on each date is every federal credit union and federally insured state-chartered credit union in the NCUA's quarterly Call Report data for that quarter, read at the same quarter-end in each of the eleven years. Privately insured state credit unions file too, but are outside the NCUA's own totals and are left out, as the NCUA leaves them out.
Each credit union is placed in a tier by its total assets on that date. The seven tiers are less than $10 million, $10 million to $50 million, $50 million to $100 million, $100 million to $500 million, $500 million to $1 billion, $1 billion to $10 billion and $10 billion or more: the groups of the NCUA's Quarterly Credit Union Data Summary, whose editions before 2024 print a single group for $1 billion or more. No credit union's assets sit exactly on a tier bound.
The NCUA publishes the summary separately from the same filings. For every date shown, the count, total assets and members here equal the summary's figures, read from that year's edition or, where ncua.gov has none for the year, the earliest edition that prints the quarter. In the seven editions that print the asset-size table, every tier's count and assets equal it; the newest edition dropped that table, and its small and complex credit union columns match instead. Each year's quartiles and ninetieth percentile of assets are within one percent of the summary's asset distribution rows; the NCUA does not say how it takes a percentile, and no single rule reproduces every printed value to the decimal.
The cohort follows each credit union of June 30, 2016 by its NCUA charter number. A credit union that converts between a federal and a state charter files under a new number, so when a charter number is gone it is followed by its Federal Reserve RSSD ID, which a conversion keeps; 123 were followed that way.
Limits
- Federally insured only. Privately insured credit unions are not counted, so a credit union that leaves federal insurance counts as no longer filing.
- No longer filing is not one event. The Call Report shows that a credit union stopped filing, not whether it merged, liquidated or converted. The merger reports answer that, and only for mergers.
- Fixed dollar tiers. The bounds are not adjusted for inflation or for the growth of the system, so a credit union can move up a tier without any change in its business.
- One quarter a year. Each year is read at the same quarter-end, June 30, 2026 for the latest. A credit union's tier can change between filings.
- Assets are one measure of size. Members are shown beside assets, and the two shares differ by tier.
Cite this
Free to quote, cite and republish, including the chart, with credit to Finantrix Atlas and a link to this page.
The number of federally insured US credit unions fell from 5,887 to 4,214 in the ten years to June 30, 2026, a drop of 28.4%, according to a Finantrix Atlas analysis of NCUA Call Report data.
The 471 US credit unions with $1 billion or more in assets hold 79.5% of federally insured credit union assets, according to Finantrix Atlas, from NCUA data for June 30, 2026.
Suggested citation: Finantrix Atlas, "Credit Unions by Size Tier: How Fast the Count Is Falling," data as of June 30, 2026, from NCUA Call Report data and the NCUA Quarterly Credit Union Data Summary. https://www.finantrix.com/articles/credit-union-concentration
Embed the chart:
<a href="https://www.finantrix.com/articles/credit-union-concentration"><img src="https://www.finantrix.com/atlas/credit-union-concentration.png" alt="Share of US credit union assets by credit union size tier, from NCUA data, by Finantrix Atlas"></a>
<p>Chart: <a href="https://www.finantrix.com/articles/credit-union-concentration">Finantrix Atlas</a>, from NCUA Call Report data.</p>
Frequently asked questions
Q: How many credit unions are there in the US? A: 4,214 federally insured credit unions filed a Call Report for June 30, 2026, according to the NCUA, down from 5,887 on June 30, 2016.
Q: How fast is the number of credit unions falling? A: By 3.3% a year on average over the ten years to June 30, 2026, according to NCUA data, or between 135 and 216 credit unions a year.
Q: What is a small credit union? A: In its Quarterly Credit Union Data Summary the NCUA reports small credit unions as those with less than $100 million in assets. There were 2,438 on June 30, 2026, 58% of all federally insured credit unions, holding 3.0% of credit union assets, according to NCUA data.
Q: How many billion-dollar credit unions are there? A: 471 federally insured credit unions had $1 billion or more on June 30, 2026, according to NCUA data, and together they hold 79.5% of credit union assets.
Download the data
The 77 rows on this page (CSV), free. The full dataset has all 55,220 rows, as of June 30, 2026; we email you a link.
Frequently Asked Questions
How many credit unions are there in the US?
4,214 federally insured credit unions filed a Call Report for June 30, 2026, according to the NCUA, down from 5,887 on June 30, 2016.
How fast is the number of credit unions falling?
By 3.3% a year on average over the ten years to June 30, 2026, according to NCUA data, or between 135 and 216 credit unions a year.
What is a small credit union?
In its Quarterly Credit Union Data Summary the NCUA reports small credit unions as those with less than $100 million in assets. There were 2,438 on June 30, 2026, 58% of all federally insured credit unions, holding 3.0% of credit union assets, according to NCUA data.
How many billion-dollar credit unions are there?
471 federally insured credit unions had $1 billion or more on June 30, 2026, according to NCUA data, and together they hold 79.5% of credit union assets.